Published online Mar 21, 2014. doi: 10.3748/wjg.v20.i11.2979
Revised: December 5, 2013
Accepted: January 2, 2014
Published online: March 21, 2014
Processing time: 208 Days and 14.8 Hours
AIM: To study KRAS/BRAF mutations in colorectal-cancer (CRC) that influences the efficacy of treatment. To develop strategies for overcoming combination of treatment.
METHODS: Five colonic cell-lines were investigated: DLD-1 with KRAS (G13D) mutation, HT 29 and Colo 205 with BRAF (V600E) mutation as well as the wild type (Wt) cell-lines Caco2 and Colo-320. DLD-1 (KRAS), HT-29 (BRAF) and Caco2 (Wt) cell lines were treated with cytokines (TNFα 50 ng, IL-1β 1 ng and IFNγ 50 ng) and harvested at different time points (1-24 h). KRAS inhibition was performed by the siRNA-approach. Two colorectal cancer cells DLD-1 and Caco2 were used for KRAS inhibition. About 70% confluency were confirmed before transfection with small interferring RNA (siRNA) oligonucleotides. All the synthetic siRNA sequences were designed in our laboratory. Total RNA and protein was isolated from the cells for RT-PCR and Western blotting. Densitometry of the Western blotting was analyzed with the Image J software (NIH). Results are shown as mean ± SD.
RESULTS: RT-PCR analysis in non-stimulated cells showed a low basal expression of TNFα and IL-1β in the DLD-1 KRAS-mutated cell-line, compared to Caco2 wild type. No detection was found for IL-6 and IFNγ in any of the studied cell lines. In contrast, pro-angiogenic chemokines (CXCL1, CXCL8) showed a high constitutive expression in the mutated cell-lines DLD-1 (KRAS), HT-29 and Colo205 (BRAF), compared to wild type (Caco2). The anti-angiogenic chemokine (CXCL10) showed a high basal expression in wild-type, compared to mutated cell-lines. KRAS down-regulation by siRNA showed a significant decrease in CXCL1 and CXCL10 gene expression in the DLD-1 (KRAS) cell-line in comparison to wild type (Caco2) at 72 h after KRAS silencing. In contrast, the specific KRAS inhibition resulted in an up-regulation of CXCL1 and CXCL10. The results of our study show a higher expression of pro-angiogenic chemokines at basal level in mutated cell-lines, which was further increased by cytokine treatment.
CONCLUSION: To summarize, basal chemokine gene expression for pro-angiogenic chemokines was high in mutated as compared to wild type cell-lines. This reflects the likely existence of a different microenvironment in tumours consistent of wild type or mutated cells. This may help to rationalize the choice of molecular targets for suitable therapeutic investigation in clinical studies.
Core tip: The presence of KRAS/BRAF mutations in advanced colorectal-cancer influences the efficacy of treatment. It is not known whether the composition of tumor-associated immune cells is influenced by the mutational status of the tumor. The results of our study show a higher expression of pro-angiogenic chemokines at basal level in mutated cell-lines, which was further up-regulated by cytokine treatment. Moreover, specific KRAS inhibition resulted in an increase of pro-angiogenic chemokines, mainly through the NF-κB pathway in wt (Caco2). Our findings point to the interconnection of tumor mutation and its microenvironment.
-
Citation: Khan S, Cameron S, Blaschke M, Moriconi F, Naz N, Amanzada A, Ramadori G, Malik IA. Differential gene expression of chemokines in
KRAS andBRAF mutated colorectal cell lines: Role of cytokines. World J Gastroenterol 2014; 20(11): 2979-2994 - URL: https://www.wjgnet.com/1007-9327/full/v20/i11/2979.htm
- DOI: https://dx.doi.org/10.3748/wjg.v20.i11.2979
Colorectal carcinoma (CRC) is considered as one of the most common lethal cancers all over the world[1]. The major causes for CRC are environmental factors rather than heritable genetic changes. The most important risk factors for sporadic CRC include food-born mutagens, specific intestinal pathogens, chronic intestinal inflammation and age[2].
Mutations in oncogenic and loss of tumor suppressor genes trigger tumor development through mutiple pathways[3]. KRAS and BRAF are the most common mutations found in CRC which can alter the cell signalling pathways[4,5].
The RAS and RAF family of genes code for proteins which belong to the RAS/RAF/MEK/ERK signalling cascade within cells[6]. This cascade is involved in the transmission of extracellular signals which control a variety of biological processes such as cell growth, cell survival and migration[7]. Disruption of this pathway, through gain-of-function mutations in RAS and RAF family members, is well described in several different types of cancer. In CRCs, mutations are less frequently found in the BRAF and to a larger extent in the KRAS genes[8,9]. The later is an early event[10,11] and occuring in 30%-50% of these tumors[8].
KRAS and its downstream effector molecules play a central role in the development of several tumor types, including colon cancer[12]. In fact, the KRAS and BRAF proteins are known to be a key downstream component of epidermal growth factor receptor (EGFR) signaling[13]. EGFR signaling is an important mediator within the tumor microenvironment and is well established in autocrine and paracrine circuits that result in enhanced tumor growth[14].
A major contributor to the tumor microenvironment are inflammation and its mediators (especially the cytokines)[15].
Tumor cells themselves can produce cytokines, including interleukin-1 α/β (IL-1α/β), interferon gamma (IFNγ) and tumor necrosis factor α (TNFα)[16] maintaining a pro-inflammatory microenvironment. They also secrete chemokines inducing further infiltration of immune-cells. It is known that colorectal tumors that are not associated with clinically detectable inflammatory bowel disease (IBD) show an immune cell infiltrate and an increased expression of pro-inflammatory cytokines (IL-1β, IFNγ and TNFα)[17-20]. Not only tumor cells themselves, but also stromal cells of the tumor microenvironment may release pro-inflammatory cytokines which in turn act on CRC-cells to secrete chemokines[21]. These chemokines attract immune cells which act on the tumor cell and its microenvironment, thereby multiplying the inflammatory effects and subsequent tumor initiation and promotion[22].
Chemo-attractant cytokines play a key role in the modulation of the immune system[23]. Chemokines are thought to be responsible for recruiting immune cells. They are actively involved in inflammation, tissue repair, development of fibrosis and tumor growth[24-26]. Chemokines, comprise a set of low-molecular weight cytokines (7-10 kDa), which play a key role in directing migration and activation of leukocytes in the inflammatory processes[27]. Based on their primary structure, chemokines are distinguished as C, CC, CXC or CX3C where “X” represents a non-conserved amino acid substitution[28].
Several studies have been published to elucidate the dual role of chemokines in promotion and inhibition of angiogenesis[22,29]. Of the CXC chemokines which regulate angiogenesis, CXCL1 promotes tumor angiogenesis, whilst CXCL10 inhibits neo-vascularisation[20,30-32].
Based on these studies, we hypothesized that stromal cells of the tumor microenvironment may release pro-inflammatory cytokines (IL-1β, IFNγ, and TNFα) EGF which in turn act on CRC-cells to secrete chemokines (CXCL1 and CXCL10). These chemokines in turn attract inflammatory cells which influence on the tumor cells and their microenvironment, thereby multiplying the inflammatory effects and subsequent tumor initiation and promotion.
Little is known about the effect of these pro-inflammatory mediators on the gene expression of chemokines (CXCL1 and CXCL10) in the presence/absence of KRAS mutation. Hence, the profile of cytokine (TNFα, IFNγ and IL-1β) and pro- (CXCL1) and anti-angiogenic (CXCL10) chemokine gene expression was examined in view of the different mutations in CRC cell lines. It was the aim of this study to further investigate the regulation of these chemokines in CRC mutated and non-mutated cell lines after administration of pro-inflammatory cytokines (TNFα, IFNγ and IL-1β). Finally, the role of these chemokines was explored by knocking down the KRAS gene in mutant (DLD-1) and wild type (Caco2) colorectal cancer cell lines.
Our findings would give an insight into the interconnection of the tumour and its micro-environmental factors.
The chemicals used in the present study were of analytical/molecular biology grade and purchased from commercial sources as follows: The recombinant cytokines IL-1β, TNFα and IFNγ were purchased from Roche (Mannheim, Germany). The chemicals and solutions were purchased from Sigma (Steinheim, Germany): aprotinin, DL-dithiothreitol (DTT), EDTA, leupeptin, phenylmethylsulfonyl fluoride (PMSF), phorbol 12-myristate 13-acetate (PMA), phosphatase inhibitor cocktail 1 and 2, thiourea, urea; from Merck (Darmstadt, Germany): Glycerin, HCl; RPMI 1640 medium, foetal calf serum (FCS), penicillin/streptomycin and phosphate buffered saline were purchased from Biochrom AG (Berlin,Germany); and from Bio-Rad (Munich, Germany): The protein assay kit and ampholytes (Bio-Lyte® 3/10) were obtained from BIO-RAD (Munich, Germany): Primers, protector RNAse inhibitor and 1x RT buffer were supplied by Invitrogen (Darmstadt, Germany). The FAST Sybr Green master mix was purchased from Applied Biosystems (Darmstadt, Germany) and moloney murine leukaemia virus reverse transcriptase (M-MLV RT) from Promega (Mannheim, Germany). A list of primers used in the study is shown in (Tables 1 and 2). A list of all antibodies used in this study is listed with its concentrations in (Table 3).
| Primer | 5’→3’ forward | 5’→3’ reverse |
| Human β-actin | CTG GCACCCAGCACAATG | CCGATCCACACGGAGTACTTG |
| Human CXCL1 (GROα) | GTGTGAACGTGAAGTCCCCC | GCTGCAGAAATCAGGAAGGC |
| Human CXCL8 (IL-8) | ATGACTTCCAAGCTGGCCG | GCTGCAGAAATCAGGAAGGC |
| Human CXCL10 (IP-10) | CCAGAATCGAAGGCCATCAA | CATTTCCTTGCTAACTGCTTTCAG |
| Human TNFα | CCCAGGCAGTCAGATCATCTTC | AGCTGCCCCTCAGCTTGA |
| Human IFNγ | CCAACGCAAAGCAATACATGA | TTTTCGCTTCCCTGTTTTAGC |
| Human IL-1β | AATTTGAGTCTGCCCAGTTCCC | AGTCAGTTATATCCTGGCCGCC |
| Human TNFα Rec1 | AGGAAGAACCAGTACCGGCAT | TCTGTTTCTCCTGGCAGGAGA |
| Human IL1β Rec1 | TGTTCAGGAGCTGAAGCCCAT | AATTCACACAGCAGGACAG |
| Human IFNγ Rec1 | AAGAGCCGTTGTCTCCAGCAA | TAAAGCGATGCTGCCAGGTTC |
| Human KRAS Codon 12 and 13 | RAS A (Forward): 5' ACTGAATATAAACTTGTGGTCCATGGAGCT 3' | |
| RAS B (Reverse): 5' TTATCTGTATCAAAGAATGGTCCTGCACCA 3' | ||
| RAS C (Reverse): 5' GGATGGTCCTCCACCAGTAATATGGATATT 3' | ||
| Human BRAF V600E | A-Allele (Forward): 5' AAAAATAGGTGATTTTGGTCTAGCTACTGTA 3' | |
| T-Allele (Forward): 5' AAAAATAGGTGATTTTGGTCTAGCTACTGT 3' | ||
| (Reverse): 5' ACACTGATTTTTGTGAATACTGGGAACT 3' | ||
| KRAS siRNA sequence | 5’→3’ forward | 5’→3’ reverse |
| Sequence 1 | GCAAGUAGUAAUUGAUGGA | UCCAUCAAUUACUACUUGC |
| Sequence 2 | ACAGGCUCAGGACUUAGCA | UGCUAAGUCCUGAGCCUGU |
| Sequence 3 | GCAAGAAGUUAUGGAAUUCUA | GAAUUCCAUAACUUCUUGCUC |
| Primary antibody | Origin | Dilutions primary Ab | Provider |
| β-actin | Mouse | 1:5000 | Sigma aldrich |
| CXCL1/GROα | Goat | 1:500 | R and D system |
| CXCL10/IP-10 | Goat | 1:500 | R and D system |
| CXCL8/IL-8 | Goat | 1:500 | R and D system |
| MAPK1 (ERK1/2) | Rabbit | 1:1000 | Cell signalling |
| IκBα | Rabbit | 1:10000 | Abcam |
| KRAS | Rabbit | 1:1000 | ABBIO technology |
The human colon adenocarcinoma cell lines Caco2, HT-29, Colo-320, Colo-205 and DLD-1 were obtained from DSMZ (Deutsche Sammlung von Mikroorganismen und Zellkulturen GmbH, Germany).
Caco2 cells were grown in EMEM (Eagle’s minimal essential medium), BioWhittacker, (Darmstadt, Germany) containing 20% fetal calf serum (FCS) supplemented with 100 U/mL each of penicillin and streptomycin and 1% non-essential amino acids at 37 °C and 5% CO2. DLD-1, HT-29, Colo-320 and Colo-205 were grown in RPMI (Roswell Park Memorial Institute Medium) with glutamin purchased from Biochrom AG (Berlin,Germany);containing 10% FCS and 100 U/mL penicillin and streptomycin at 37 °C and 5% CO2. Caco2, HT-29 and DLD-1 cells were plated into six-well plates at a density of 5 × 10⁵ cells per well for real-time polymerase chain reactions (PCRs), Western Blot analysis and siRNA experiments unless until stated and grown till they reached 70%-80% confluence. These cells were then stimulated with IL-1β (1 ng/mL), TNFα (50 ng/mL) and IFNγ (50 ng/mL) based on the type of experiments.
Total Ribonucleic acid (RNA) was isolated from cell lysates by using Qiagen (Hilden,Germany) RNeasy mini kit, according to the manufacturer’s protocol. The RNA concentrations were determined photometrically using a Gene Quant RNA/deoxyribonucleic acid (DNA) calculator Pharmacia, (Freiburg, Germany). RNA was subsequently used for real-time PCR. The cDNA was generated by reverse transcription of 1μg of total RNA using 100 nmol/L of dNTPs from Invitrogen (Darmstadt, Germany), 50 pM of primer oligo(dT)15 Roche (Mannheim, Germany), 200 units of (M-MLV) Moulony murine leukemia virus reverse (Roche) transcriptase 16U of protector RNAse inhibitor (Roche) in 1 × RT buffer Invitrogen (Darmstadt, Germany) and 2.5 mL of 0.1 mol/L dithiothreitol (DTT) from Invitrogen (Darmstadt, Germany) for 1 h at 40 °C as described[33]. Reverse transcription of messenger RNA (mRNA) was performed using 1 μg of total cellular RNA. To determine the mRNA expression real-time PCR was carried out using human gene-specific primers Invitrogen GmbH (Karlsruhe, Germany). Primers sequences are given in (Tables 1 and 2) for in an ABI Prism 7000 sequence detection system. PCR reaction was set up with Sybr® Green PCR Master mix from Invitrogen (Darmstadt, Germany) containing 0.3 μmol/L primers each and 1 μL of RT-product in 25 μL volume. A two-step amplification protocol was chosen consisting of initial denaturation at 95 °C for 10 min followed by 45 cycles with 15 s denaturation at 95 °C and 30 s annealing/extension at 60 °C. Finally, a dissociation protocol was performed to control specificity of amplification products. The results were normalised to the house keeping gene, and fold change expression was calculated using threshold cycle (Ct) values. Beta actin was chosen as house keeping gene its expression remained stable thoughout the study.
Proteins were isolated from the cell lysate at the different time points and Western blotting was performed as described previously[34]. Briefly, protein contents were calculated by the Commassie Protein Assay BIO-RAD (Munich, Germany). 20 μg of total protein were loaded on a 4%-12% Nu-PAGE Bis-Tris Invitrogen (Darmstadt, Germany) gel and separated after 2 h electrophoresis at 80 V. After the transfer of gel into nitrocellulose membrane in a semi-dry apparatus at 30 V for 1.5 h, the membranes were blocked in 5% (non-fat dried milk), and blotted with primary antibodies overnight at 4 °C. The secondary antibodies were horse raddish peroxidase conjugated goat anti-rabbit and goat anti-mouse immunoglobulins Dako (Hamburg, Germany) diluted at 1:1000. Membranes were developed with the ECL chemiluminescence Kit purchased from Amersham Pharmacia Biotech (Freiburg, Germany). β-actin was used as an internal loading control.
Two colorectal cancer cells DLD-1 and Caco2 were plated in 24 wells at a density of 5 × 10⁴ cells per well. About 70% confluency were confirmed before transfection with small interferring RNA (siRNA) oligonucleotides. All the synthetic siRNAs sequences were designed in our laboratory and synthesized by Eurofins MWG Operon (Ebersberg, Germany). Transfection reagent Lipofectamine from Invitrogen (Darmstadt, Germany) according to the standard protocol of the manufacturer parameters were optimized for each cell line prior to validation according to the instructions given in the transfection reagent handbook. Briefly, for triplicate transfections, siRNA and Lipofectamine from Invitrogen (Darmstadt, Germany) were diluted in 100 μL DMEM from Gibco (Grand Island, United States) without serum and incubated for 10 min at room temperature. After cell culture medium removal, 500 μL fresh medium and 100 μL transfection complexes were added per well. Cells were incubated for 48 and 72 h before analyzing the degree of knockdown. 20 nmol/L siRNA (6 μL) and 10 nmol/L lipofectamine (12 μL) which was considered to be a combination which resulted in an acceptable KRAS knock down after 48 and 72 h incubation time for the following experiments. Transfection performance was monitored using a validated scrambled siRNA control Qiagen (Hilden, Germany). The experiments were performed in three replicates for both cell lines. KRAS was determined by real time PCR and at protein level through Western blotting. A list of the KRAS siRNA sequences is shown in Table 2.
The data were analyzed using Prism Graph pad 5 software (San Diego, United States). All experimental errors are shown as SEM. Statistical significance was calculated by one way ANOVA test and Student′s t test. Significance was accepted at P < 0.05. Densitometry of the Western blotting was analyzed with the Image-J software (NIH). Results are shown as mean ± SD. Significant difference was accepted at P < 0.05 against control group and calculated according to the Student t-test.
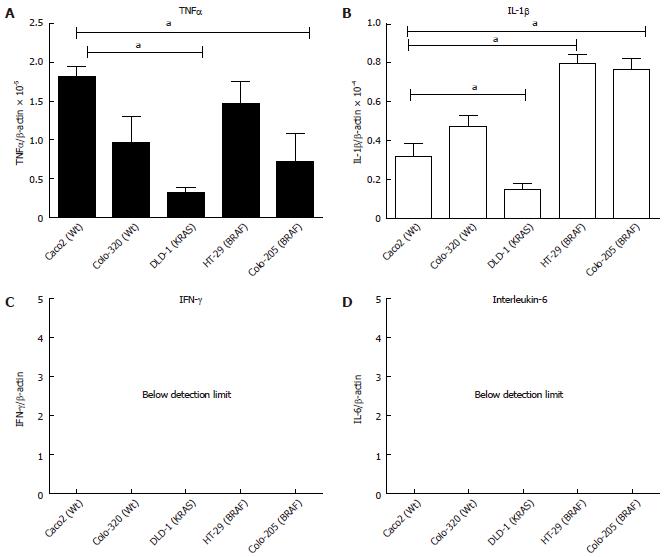
The gene expression of major cytokines (TNFα, IL-1β and IFNγ) was studied at basal level in five CRC cell lines. Previously, it has been published that intestinal epithelial cell lines (IECs) depending on their origin and maturity may have a different and distinct pattern of chemokine/cytokine expression[35]. Using gene specific primers the real time PCR data showed that the basal mRNA expression of TNFα, normalised to β-actin expression, was highest in Caco2 (Wt) followed by HT-29 (BRAF) and the lowest expression was observed in the DLD-1(KRAS) cell line (Figure 1A; P < 0.05). The highest IL-1β expression was observed in both BRAF mutated cell lines HT-29 and Colo-205, followed by the two wild type Colo-320 and Caco2 cell lines respectively. The lowest expression for IL-1β was found in DLD-1 (KRAS) (Figure 1B; P < 0.05). To summarize, basal expression was very low in the KRAS mutated cell line DLD-1 for the pro-inflammatory cytokines (TNFα and IL-1β). Moreover, IFNγ and IL-6 showed no expression in any of the cell lines (Figure 1C, D).
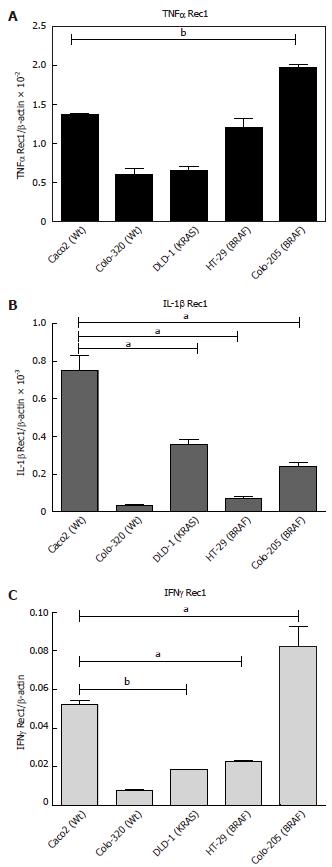
The basal level of cytokine receptor mRNA expression in the five cell lines revealed that Colo-205 and HT-29 (BRAF mutated) have the highest expression of TNFα Rec1 (Figure 2A; P < 0.05). IL-1β Rec was found in Caco2 (Wt) followed by DLD-1 (KRAS) and Colo-205 (BRAF) (Figure 2B; P < 0.05). Even though IFNγ did not show any expression for the five cell lines at the basal level. However, IFNγ Rec1 showed the maximum expression in Colo-205 and HT-29 (BRAF) followed by Caco2 (Wt) in comparison with TNFα Rec1 and IL-1β Rec 1. (Figure 2C; P < 0.05).
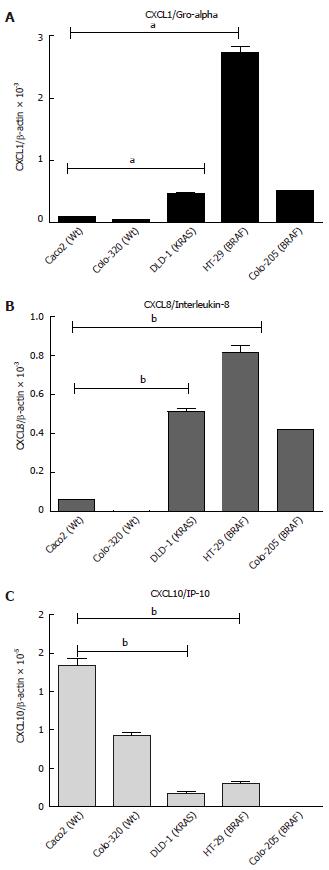
The differences in the basal level of mRNA expression of chemokines were studied in five different cell lines. The mRNA expression of CXCL1 was significantly higher in the mutated cell lines HT-29 (BRAF) followed by Colo-205 (BRAF) and DLD-1 (KRAS) (Figure 3A, B; P < 0.05). However, the expression was low in the wild type cell lines Caco2 and Colo-320. In contrast, CXCL10 mRNA was significantly increased in the wild type cell lines Caco2 and Colo-320. It was found that CXCL10 mRNA expression was lowest in the mutated cell lines (HT-29, DLD-1 and Colo-205) (Figure 3C; P < 0.05).
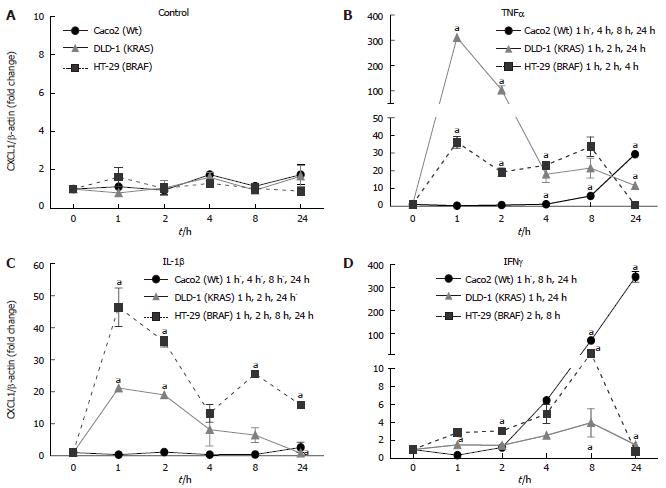
Three cell lines with two different mutations DLD-1 (KRAS), HT-29 (BRAF) and Caco2 (Wild type) were examined for the time kinetics of CXCL1 mRNA expression and protein secretion. The cytokines were administered at the following concentrations: IL-1β (1 ng/mL), TNFα (50 ng/mL) and IFNγ (50 ng/mL) were administered to IECs.
Under control conditions (Figure 4A), CXCL1 mRNA expression did not change over the experiment. CXCL1 mRNA was inducible early at 1h after stimulation with TNFα in DLD-1 (KRAS) (310 ± 2.18 fold), followed by HT-29 (BRAF; 36.15 ± 3.28 fold), whereas no change was detected in CXCL1 mRNA expression in the Caco2 cell line. The induction by TNFα of CXCL1 in HT-29 was milder as compared to DLD-1 but lasted until 8 h after stimulation, while in DLD-1 it lasted only until 2 h at high levels (Figure 4B; P < 0.05). IL-1β induced the highest gene expression of CXCL1 in HT-29 (BRAF; 46.42 ± 5.98 fold), followed by DLD-1 (KRAS; 21.19 ± 0.37 fold), However, in Caco2 (Wt) IL-1β did not affect the CXCL1 gene expression (Figure 4C; P < 0.05). IFNγ stimulation showed a delayed increase of CXCL1 gene expression in Caco2 (Wt; 346.84 ± 23.01 fold) which was highest at 24 h, followed by HT-29 (BRAF; 14.43 ± 2.50 fold) at 8 h (Figure 4D; P < 0.05).
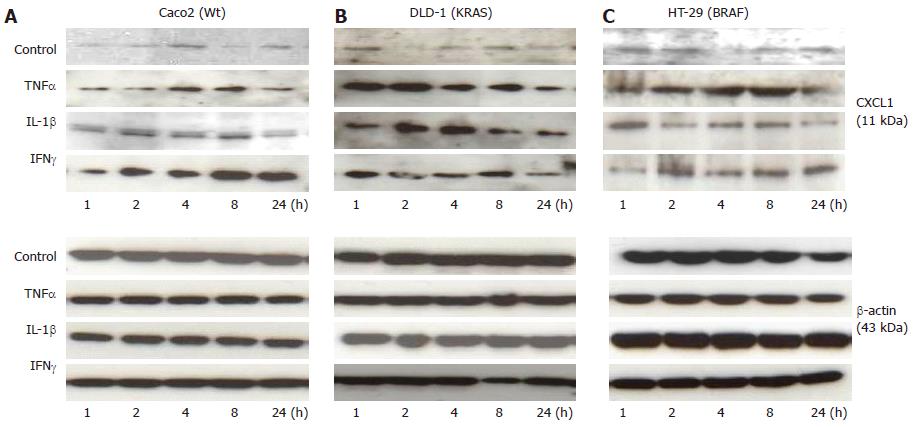
The effect of cytokine stimulation on CXCL1 was further analysed at protein level by Western blotting (Figure 5A-C) in Caco2 (Wt), DLD-1 (KRAS) and HT-29 (BRAF) cell lines. Western blotting analysis was performed by using anti-CXCL1 antibody to confirm the changes occurring at mRNA level and to document the protein expression of CXCL1 chemokine in IECs over the time.
TNFαstimulation: The CXCL1 protein secretion under control conditions did not vary to a greater extent in the analysed cell lines. Similar to what was observed at mRNA level, DLD-1 showed a significant and early increase at 1h and a maximum at 2h after TNFα stimulation compared to the baseline conditions. In contrary to mRNA level, an increase in CXCL1 was detected with a maximum at 8 h in the Caco2 cell line in comparison to their controls. The HT-29 cell line showed an increase at 2 h and 8 h followed by decrease at 24 h as compared to respective controls. The data demonstrates that TNFα at protein level also showed significant increase in KRAS mutated cell line (DLD-1).
IL-1βstimulation: Similar to the mRNA expression, IL-1β induced a significant protein level of CXCL1 in all the studied cell lines. Among them, an increase in Caco2 was the most pronounced at 2 and 8 h compared to untreated cells. However, a statistically significant expression was detected in all studied time points as was also observed for HT-29 and DLD-1 after IL-1β stimulation.
IFNγstimulation: Likewise regarding mRNA expression, a clear gradual increase for CXCL1 in Caco2 was observed after IFNγ stimulation. This increase was at its maximum by 8 h in Caco2. HT-29 (BRAF) and DLD-1 (KRAS) also showed an increase with a maximum at 2h after IFNγ stimulation (Figure 5A-C).
Taken together, a significant increased protein level of CXCL1 was observed by treatment of cytokines (TNFα, IL1-β and IFNγ) in all studied cell lines Caco2(Wt), DLD-1 (KRAS) and HT-29 (BRAF). However, we could observe a difference among some cytokines treatments and cell lines between the mRNA and protein expression. It might be due to the secretory nature of proteins which makes it difficult to compare CXCL1 protein expression to mRNA expression in mutated and wild type cell lines, as the proteins might be released into the supernatant.
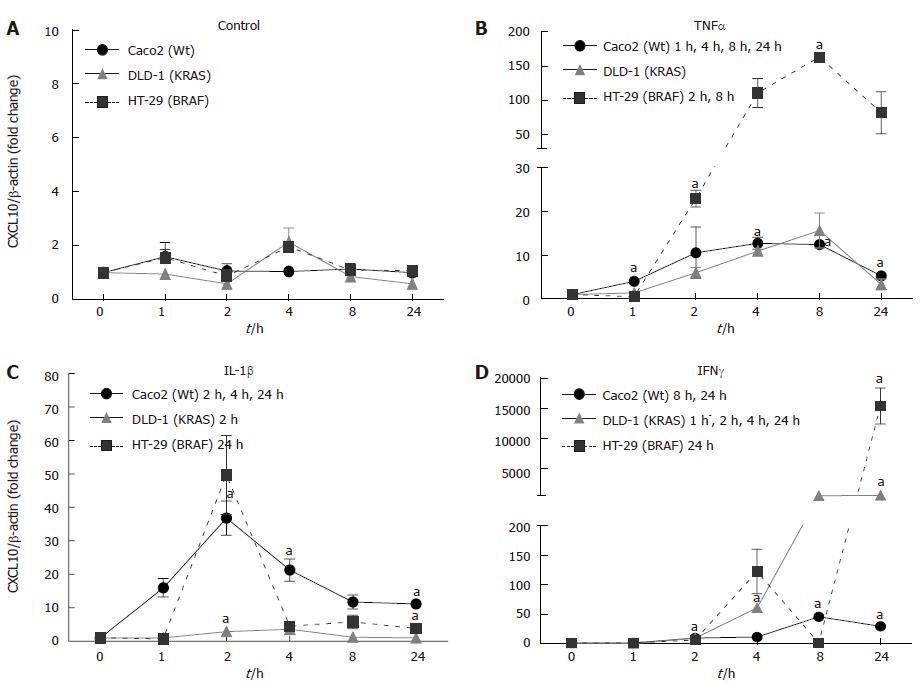
CXCL10 showed a distinct expression after cytokine stimulation in each cell line. The mRNA expression under control conditions showed no difference in the cell lines during the study (Figure 6A). TNFα induced the maximum CXCL10 gene expression in HT-29 (BRAF; 163.14 ± 0.1 fold) after 8 h. In DLD-1 (KRAS) and Caco2 (Wt) cell lines a low CXCL10 mRNA expression was observed (Figure 6B; P < 0.05).
IL-1β treatment showed a maximum CXCL10 gene expression in HT-29 (BRAF) (49.72 ± 6.25 fold) followed by Caco2 (Wt) (36.86 ± 5.13 fold) with a maximum expression at 2h, whereas DLD-1 only showed mild changes compared to non-stimulated controls (Figure 6C; P < 0.05).
In our experiment, IFNγ significantly enhanced CXCL10 mRNA expression in mutated cell lines HT-29 (BRAF; 15361.19 ± 2974.33 fold) followed by DLD-1 (KRAS; 597.71 ± 64.62 fold) in contrast to the wild type cell line Caco2 (Wt; 45.75 ± 1.44 fold) (Figure 6D; P < 0.05).
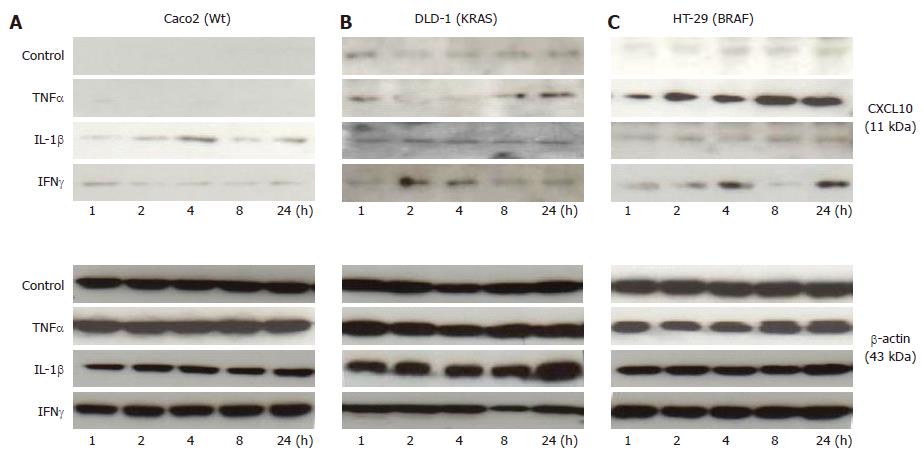
Changes in the protein expression of CXCL10 in colorectal cancer cell lines Caco2 (Wt), DLD-1 (KRAS) and HT-29 (BRAF) by cytokines (TNFα, IL-1βand IFNγ)
The Western blotting analysis of CXCL10 revealed weak expression for all the cell lines under control conditions (Figure 7A-C).
IL-1β stimulation showed no significant changes in any of the three cell lines.
HT-29 showed a highly significant increase due to TNFα after one hour and reaching at its maximum by 24 h.
Also IFNγ stimulation increased CXCL10 expression in HT-29 at early 1h and the same expression was found throughout the study (Figure 7A-C).
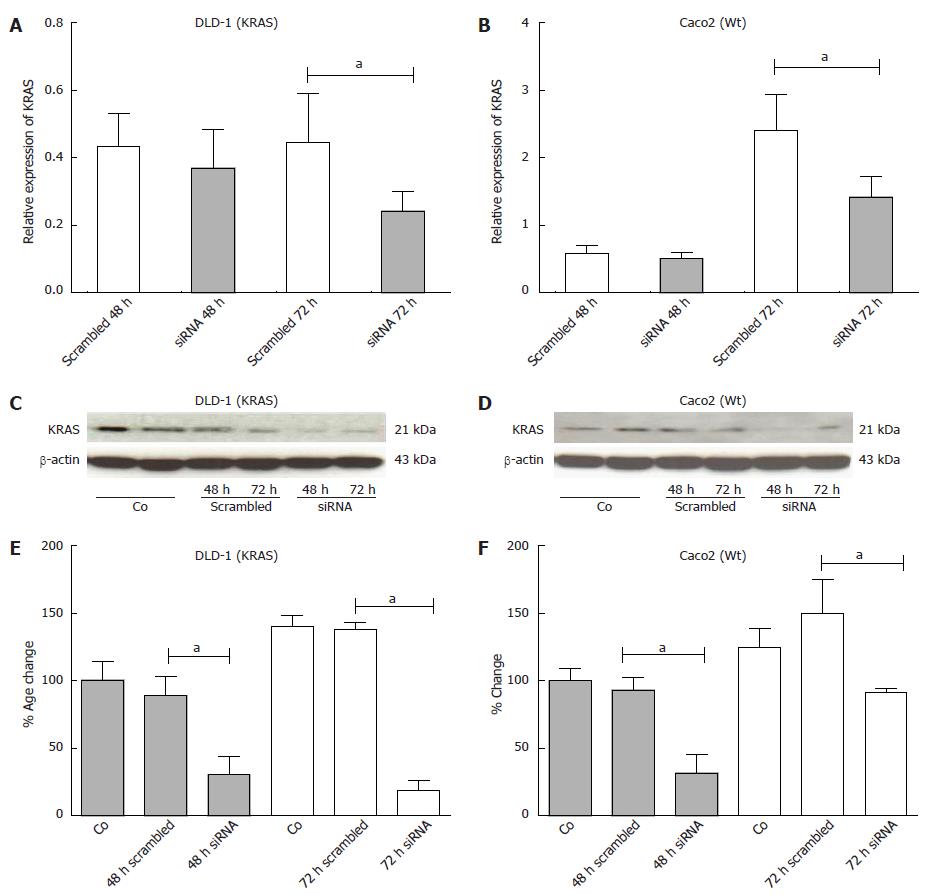
For down-regulation of KRAS expression in DLD-1 (KRAS) and Caco2 (Wt) cells, KRAS-specific siRNA was used in transfection studies. Two human colorectal carcinoma cell lines DLD-1 and Caco2 were chosen to examine the different effects of KRAS knockdown in a wild type compared to a KRAS mutated cell line after 48 h and 72 h in comparison to the scrambled siRNA. The results revealed that siRNAs down-regulated KRAS mRNA expression after 48 h in DLD-1 (25%) and Caco2 (20%), respectively. After 72 h, incubation with siRNA significantly reduced KRAS mRNA expression to approximately DLD-1 (55%) and Caco2 (58%), respectively (Figure 8A, B; P < 0.05).
The silencing of KRAS was more pronounced at protein level compared to mRNA data. By using a KRAS antibody, Western blotting analysis of three independent experiments revealed a significant reduction in KRAS protein expression in the DLD-1 cell line. The most pronounced inhibition was observed at 48 h (67% KRAS knockdown) and 72 h (85% KRAS knockdown) after siRNA transfection (Figure 8C, E).
Similar results were also detected in the Caco2 cell line with a maximum at 48 h (67% KRAS knockdown) and after 72 h (62% KRAS knockdown) (Figure 8D, F; P < 0.05).
To further explore the consequences of decreased KRAS expression due to KRAS siRNA silencing, we studied the chemokine gene expression at mRNA level.
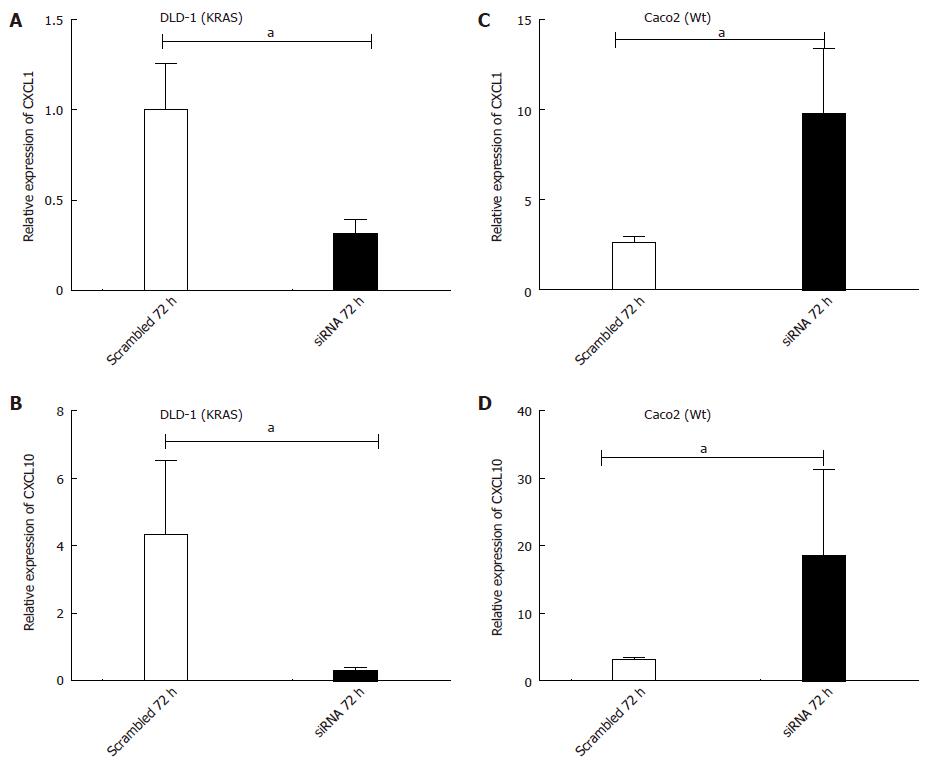
In the DLD-1 cell line, a significant decrease in CXCL1 mRNA level was detected at 72 h (0.31 ± 0.07 fold; P < 0.05 vs scrambled control) after transfection. Similarly CXCL10 also showed a decreased (0.30 ± 0.08 fold; P < 0.05 vs scrambled control) gene expression after 72 h transfection due to KRAS inhibition (Figure 9A, B; P < 0.05).
Contrary to DLD-1 (KRAS), in Caco2 (Wt) cells, the KRAS knockdown resulted in significant up-regulation of CXCL1 (9.79 ± 3.6 fold; P < 0.05 vs scrambled Control), and CXCL10 (18.40 ± 12.80 fold; P < 0.05 vs scrambled Control) mRNA expression after 72 h transfection (Figure 9C, D; P < 0.05).
To summarize, the results indicate a change in cytokine-gene expression of both cell lines after KRAS inhibition. Moreover, CXCL1 and CXCL10 showed an opposite expression in the two cell lines.
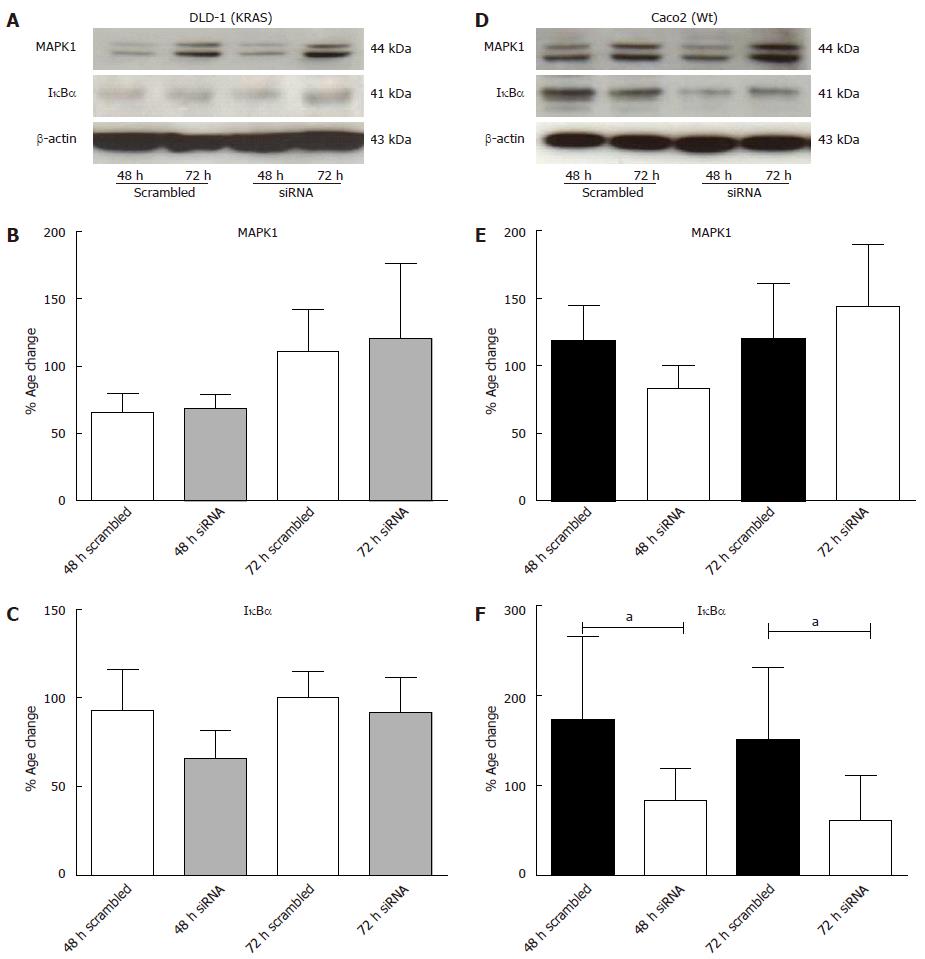
To further evaluate the reason of change in chemokine gene expression by KRAS-knock down in both DLD-1 and Caco2 cell lines, transcription factors MAPK1 and IκBα were analysed at protein level (Figure 10A, D). MAPK1 specific protein band was detectable at 44 kDa in DLD-1 and Caco2 cells. The MAPK1 desitometric analysis of three experiments showed no significant change after 48 h and 72 h by KRAS reduction. The data suggested that inhibition of KRAS has no significant effect in either cell lines for MAPK1 (Figure 10B, E).
To analyse the activation of the NF-κB pathway, cell lysates were analyzed for changes in the level of total IκBα (subunits of NF-κB), as phosphorylation of the p65 subunit and the degradation of IκBα are known to be associated with activation of the NF-κB classical pathway[36]. However, inhibition of KRAS expression by siRNA affects significantly the levels of IκBα in Caco2 (Figure 10F). Our results revealed that after 48 h of transfection, it reduced IκBα protein level to 46% and approximately 70% after 48 h and 72 h respectively. Furthermore, a non-significant decrease in DLD-1 was also detected after KRAS gene knockdown (Figure 10C).
Chronic inflammation drives cancer development through tissue damage and release of pro-inflammatory mediators[37]. It is known that cytokine stimulation of tumor cells can cause the tumor to produce growth factors, inflammatory mediators (i.e., chemokines) and proangiogenic factors[38]. The tumor is thus able to influence and maintain its own microenvironment, which includes immune cells, stromal cells and microvessels. It can be hypothesized that different mutations caused during tumorigenesis might drive a varying microenvironment. KRAS and BRAF mutation has been reported in approximately 50% of CRCs. For lung tumors, it has been shown that KRAS activation generates a proinflammatory microenvironment which may promote tumor growth and invasion[39]. Similar data have also been reported for pancreatic cancer[40]. Recently, a RAS-mutation dependent behaviour of CRC cell lines after exposure to inflammatory mediators was documented[41]. The significance of WT, KRAS and BRAF mutational status for chemokine production of the various CRC cell lines has not been studied so far. Hence, the aim of our study was to investigate the influence of different CRC-mutations in view of the regulation and induction of inflammatory cytokines and chemokines.
A panel of cytokines (TNFα, IL-1β, IFNγ and IL-6) and cytokine receptors, which are more commonly involved in the tumor control and progression in colorectal carcinoma cell lines, was evaluated. We showed a low basal transcript expression of TNFα and IL-1β in the KRAS mutated (DLD-1) cell line, compared to wild type (Caco2). No detection at basal level was found for IL-6 and IFNγ in any of the studied cell lines. In contrast, the pro-angiogenic chemokines CXCL1, CXCL8 showed a high constitutive expression in mutated cell lines DLD-1 (KRAS), HT-29 and Colo205 (BRAF), compared to wild type (Caco2). However, the anti-angiogenic chemokine (CXCL10) showed a high basal expression in wild type, compared to the mutated cell lines. The high basal expression of pro-angiogenic chemokines together with a low basal expression of inflammatory cytokines in mutated cell lines implies that these cell-lines became independent of external pro-inflammatory stimuli. A pro-angiogenic microenvironment promotes neovascularisation and as a consequence facilitates metastasis[14].
Treatment with pro-inflammatory cytokines showed an induction of CXCL1 gene expression in mutated, and to a lesser extent in wild type cell lines at mRNA and protein level. The most pronounced and quick induction of CXCL1 gene expression was detected after TNFα stimulation in DLD-1 (KRAS-mutated) followed by HT-29 (BRAF-mutated) compared to Caco2 (Wt). Similar results were found after treatment with IL-1β which induced the maximum gene expression of CXCL1 in HT-29 followed by DLD-1; a minor but significant increase was also found in Caco2 (Wt).
CXCL10 at mRNA level were significantly induced by IFNγ in the mutated cell lines HT-29 followed by DLD-1, in comparison to wild type (Caco2).
A decreased CXCL1 and CXCL10 gene expression was detected in the DLD-1 (KRAS) cell line in comparison to wild type (Caco2) at 72h after KRAS silencing. The specific KRAS inhibition resulted in an up-regulation of CXCL1 and CXCL10 and induction of the NF-κB pathway in wild type (Caco2) cell line.
Inflammatory cytokines play an important role in CRC[37]. Significant differences were observed for basal TNFα and IL-1β expression between mutated (KRAS and BRAF) and non-mutated CRC cell lines. A pro- as well as anti-cancer role of TNF has been described[42]. This anticancer effect is multi-factorial as TNF can cause vascular necrosis, tumor necrosis and has a direct apoptotic effect on tumor cells[32]. Gene expression of TNFα was found to be the lowest in KRAS and BRAF mutated cell lines compared to non-mutated cells. Based on these data, it could be suggested that a reduction in basal TNFα level in mutated cell lines compared to wild type cell lines could be related to a reduced cell necrosis and apoptosis in this rapid turnover system. In other words, reduction in TNF expression might help mutated cells to survive in a rather hypoxic tumor microenvironment.
Similar results were obtained for IL-1β basal expression with the exception of BRAF mutated cell lines which showed an induction of IL-1β compared to KRAS mutated or non-mutated cell lines.
Another important aspect of the current study was the absence of IFNγ and IL-6 at basal mRNA level. However, IFNγ and IL-6 cytokine receptors were detected, as were TNFα and IL-1β receptors at basal level. The presence of the receptors points to a functional cytokine sensitivity. A role of IL-6 in tumor progression has already been described[43]. In fact, interferons are proteins involved in many functions including, apoptosis, cell cycle control and they act as mediators of other cytokines[44,45]. IFNγ is known for anti-proliferative and furthermore anti-tumor activity in CRC[46]. The lack of detection of these main pro-inflammatory cytokines in any of the studied cell lines could explain that tumor cells are able to promote their microenvironment according to their needs. Additionally, IFNγ might induce the anti-tumorigenic role of TNF[47] and the absence of IFNγ might thus prevent TNF-induced classic apoptosis pathway. Reduced expression of TNFα in mutated cell lines and the complete abolishment of IFNγ expression in our data could be associated with increased tumor progression as has been suggested above.
Chemokines are known to attract leukocytes during stress conditions[27] and promote tumor development[48].
According to our results, the increased gene expression of CXCL1 and CXCL8 as well as the decreased CXCL10 gene expression in KRAS and BRAF mutated cell lines compared to wild type (Caco2 and Colo-320) cell lines indicates the likely existence of a specific microenvironment depending on the mutation status. Previously, CXCL1 protein secretion was found to be enhanced in a highly metastatic cell line as compared to a cell line with low metastatic potential[49]. This is in accordance with our results. Recent studies have also shown a difference of chemokine expression in intestinal epithelial cells of normal and IBD patients[50]. The levels of chemokine expression also correlated well with activity of the disease. Some differences were found in chemokine expression between ulcerative colitis (UC) and Crohn’s disease (CD)[50], suggesting that they share common inflammatory pathways.
Moreover, in the tumor microenvironment, the balance between pro-and anti-angiogenic chemokines may determine the degree of angiogenesis and the ensuing tumor progression.
In our experiments, TNFα and IFNγ were the main inducers for CXCL1 and CXCL10 gene expression in mutated cell lines compared to the wild type (Caco2) cell line. However, an exception was observed for CXCL8 which showed a higher induction in wild type than in mutated cell lines after IL1β administration.
To understand the possible role of KRAS and the consequences of inhibiting its activity or expression in colorectal cancer cell lines, a KRAS knockdown experiment was performed in KRAS-mutant (DLD-1) and wild type (Caco2) cell lines. Specific siRNA inhibition of the KRAS gene in a KRAS-mutated cell line (DLD-1) showed a reduced gene expression of the chemokines CXCL1 and CXCL10.
These results support that mutation of the RAS gene in colon cancer influences gene regulation of chemokines which is in accordance to previous reports. A previous report stated a reduced expression of chemokines after mutant KRAS inhibition in a human cancer cell line[51]. Furthermore, a stable knockdown of oncogenic KRAS led to reduced proliferation rates and anchorage independent growth in lung adenocarcinoma cell lines[52].
It suggests that mutant KRAS may affect the chemokine levels by shifting to additional pathways. An upregulated chemokine levels mean increased recruitment of immune cells or stromal cells which are known to play a role in tumor growth and metastasis[53-55].
A large fraction of CRC tumors and cell lines exhibit constitutive activation of transcription factors that are essential components of multiple inflammatory pathways such as NF-κB and MAPK1[38,56] which can be acivated by inflammatory cytokines[37,40].
A previous study reported that inhibition of NF-κB pathway reduces chemokine gene expression which could imply a pharmacological importance in treating IBD[33]. These results are in accordance with our study, where inhibition of KRAS by the siRNA approach induced NF-κB (reduced IκBα-level) followed by an increase in chemokine gene expression in the wild type cell line (Caco2).
To summarize the data, basal chemokine gene expression for pro-angiogenic chemokines was high in mutated as compared to wild type cell lines. Furthermore, cytokine treatment induces the expression of pro-angiogenic (CXCL1) and anti-angiogenic (CXCL10) chemokines differentially in mutated cell lines compared to wild type.
Our findings give an insight into the interconnection of the tumor and its microenvironmental factors. A pro-angiogenic microenvironment promotes neovascularisation and as a consequence facilitates metastasis[38]. The pro-angiogenic microenvironment in mutated CRC cell lines might thus be prognostic for a more aggressive and pro-metastatic tumor behaviour, predictive for the use of anti-angiogenic therapies. It is known, that wild type mutational status is an important predictor of anti-EGF-receptor therapies[57]. In the head-to-head comparison of the FOLFIRI chemotherapy with anti-EGFR or anti-VEGF-supplementation, patients with RAS-mutant tumors seem to benefit from anti-VEGF therapy in view of the progression free survival. However, these data still need further validation. The results of this study may be helpful to build a rationale for the understanding of microenvironment remodelling and tumor-microenvironment interactions in view of the different mutations. It may help to rationalize the choice of molecular targets for suitable therapeutic investigation in clinical studies.
We acknowledge support by the German Research Foundation and the Open Access Publication Funds of the Göttingen University. We also greatly appreciate the skillful technical assistance of Mrs. Elke Neumann, Ms. Daniela Gerke and Corrina Dunaiski.
Colorectal-cancer (CRC) is the third most common malignancy. In CRC, the most frequently found mutations are in the KRAS (30%-50%) and BRAF (approximately 10%) genes. It is known that the presence of KRAS and BRAF mutations in CRC may influence the efficacy of chemotherapy. It is not known whether the composition of the immune cells recruited into the tumor is influenced by the KRAS or BRAF mutational status.
The tumor is able to influence and maintain its own microenvironment, which includes immune cells, stromal cells and micro-vessels. It can be hypothesized that different mutations caused during tumorigenesis might drive a varying microenvironment. KRAS and BRAF mutation has been reported in approximately 50% of CRCs. For tumors, it has been shown that KRAS activation generates a proinflammatory microenvironment which may promote tumor growth and invasion. Hence the presence of these mutations suggests that mutant KRAS may affect the chemokine levels by shifting to additional pathways.
Their data suggests that mutant KRAS may affect the chemokine levels by shifting to additional pathways. In addition an upregulated chemokine levels mean increased recruitment of immune cells or stromal cells which are known to play a role in tumor growth and metastasis. The current study build a rationale for the understanding of microenvironment remodelling and tumor-microenvironment interactions in view of the different mutations.
The chemotherapy with anti-epidermal growth factor receptor or anti-vascular endothelial growth factor -supplementation, patients with RAS-mutant tumors seem to benefit from anti-VEGF therapy in view of the progression free survival. However, these data still need further validation. The results of this study may be helpful to build a rationale for the understanding of microenvironment remodelling and tumor-microenvironment interactions in view of the different mutations. It may help to rationalize the choice of molecular targets for suitable therapeutic investigation in clinical studies.
This research work in this manuscript relates to KRAS mutational status in colorectal carcinoma cell lines. It states that the pro-angiogenic microenvironment in mutated CRC cell lines might thus be prognostic for a more aggressive and pro-metastatic tumor behaviour, predictive for the use of anti-angiogenic therapies. The study is interesting and well addressed. The point is clearly made.
P- Reviewers: Luca M, Kannen V, Sagaert X, Wang SK, Yu YX S- Editor: Wen LL L- Editor: A E- Editor: Zhang DN
| 1. | Weitz J, Koch M, Debus J, Höhler T, Galle PR, Büchler MW. Colorectal cancer. Lancet. 2005;365:153-165. [RCA] [PubMed] [DOI] [Full Text] [Cited by in Crossref: 862] [Cited by in RCA: 943] [Article Influence: 47.2] [Reference Citation Analysis (0)] |
| 2. | Cappell MS. Pathophysiology, clinical presentation, and management of colon cancer. Gastroenterol Clin North Am. 2008;37:1-24, v. [RCA] [PubMed] [DOI] [Full Text] [Cited by in Crossref: 176] [Cited by in RCA: 144] [Article Influence: 8.5] [Reference Citation Analysis (0)] |
| 3. | Shaw P, Tardy S, Benito E, Obrador A, Costa J. Occurrence of Ki-ras and p53 mutations in primary colorectal tumors. Oncogene. 1991;6:2121-2128. [PubMed] |
| 4. | Sheng H, Shao J, Williams CS, Pereira MA, Taketo MM, Oshima M, Reynolds AB, Washington MK, DuBois RN, Beauchamp RD. Nuclear translocation of beta-catenin in hereditary and carcinogen-induced intestinal adenomas. Carcinogenesis. 1998;19:543-549. [RCA] [PubMed] [DOI] [Full Text] [Cited by in Crossref: 58] [Cited by in RCA: 63] [Article Influence: 2.3] [Reference Citation Analysis (0)] |
| 5. | Lakatos PL, Lakatos L. Risk for colorectal cancer in ulcerative colitis: changes, causes and management strategies. World J Gastroenterol. 2008;14:3937-3947. [RCA] [PubMed] [DOI] [Full Text] [Full Text (PDF)] [Cited by in CrossRef: 339] [Cited by in RCA: 321] [Article Influence: 18.9] [Reference Citation Analysis (0)] |
| 6. | Dhomen N, Marais R. New insight into BRAF mutations in cancer. Curr Opin Genet Dev. 2007;17:31-39. [RCA] [PubMed] [DOI] [Full Text] [Cited by in Crossref: 185] [Cited by in RCA: 194] [Article Influence: 10.8] [Reference Citation Analysis (0)] |
| 7. | Malumbres M, Barbacid M. RAS oncogenes: the first 30 years. Nat Rev Cancer. 2003;3:459-465. [RCA] [PubMed] [DOI] [Full Text] [Cited by in Crossref: 1287] [Cited by in RCA: 1375] [Article Influence: 62.5] [Reference Citation Analysis (0)] |
| 8. | Downward J. Targeting RAS signalling pathways in cancer therapy. Nat Rev Cancer. 2003;3:11-22. [RCA] [PubMed] [DOI] [Full Text] [Cited by in Crossref: 2345] [Cited by in RCA: 2378] [Article Influence: 108.1] [Reference Citation Analysis (0)] |
| 9. | McWilliams A. Author’s reply. Can Vet J. 1990;31:9. [RCA] [PubMed] [DOI] [Full Text] [Cited by in Crossref: 88] [Cited by in RCA: 92] [Article Influence: 6.1] [Reference Citation Analysis (0)] |
| 10. | Fearon ER, Vogelstein B. A genetic model for colorectal tumorigenesis. Cell. 1990;61:759-767. [RCA] [PubMed] [DOI] [Full Text] [Cited by in Crossref: 8087] [Cited by in RCA: 7994] [Article Influence: 228.4] [Reference Citation Analysis (1)] |
| 11. | Ilyas M, Straub J, Tomlinson IP, Bodmer WF. Genetic pathways in colorectal and other cancers. Eur J Cancer. 1999;35:335-351. [RCA] [PubMed] [DOI] [Full Text] [Cited by in Crossref: 106] [Cited by in RCA: 95] [Article Influence: 3.7] [Reference Citation Analysis (0)] |
| 12. | Karapetis CS, Khambata-Ford S, Jonker DJ, O’Callaghan CJ, Tu D, Tebbutt NC, Simes RJ, Chalchal H, Shapiro JD, Robitaille S. K-ras mutations and benefit from cetuximab in advanced colorectal cancer. N Engl J Med. 2008;359:1757-1765. [RCA] [PubMed] [DOI] [Full Text] [Cited by in Crossref: 2724] [Cited by in RCA: 2756] [Article Influence: 162.1] [Reference Citation Analysis (0)] |
| 13. | Hanahan D, Weinberg RA. The hallmarks of cancer. Cell. 2000;100:57-70. [RCA] [PubMed] [DOI] [Full Text] [Cited by in Crossref: 19834] [Cited by in RCA: 19469] [Article Influence: 778.8] [Reference Citation Analysis (0)] |
| 14. | De Luca A, Carotenuto A, Rachiglio A, Gallo M, Maiello MR, Aldinucci D, Pinto A, Normanno N. The role of the EGFR signaling in tumor microenvironment. J Cell Physiol. 2008;214:559-567. [RCA] [PubMed] [DOI] [Full Text] [Cited by in Crossref: 247] [Cited by in RCA: 276] [Article Influence: 16.2] [Reference Citation Analysis (0)] |
| 15. | Secombes C, Cunningham C. Cytokines: an evolutionary perspective. Dev Comp Immunol. 2004;28:373-374. [RCA] [PubMed] [DOI] [Full Text] [Cited by in Crossref: 7] [Cited by in RCA: 5] [Article Influence: 0.2] [Reference Citation Analysis (0)] |
| 16. | Popivanova BK, Kitamura K, Wu Y, Kondo T, Kagaya T, Kaneko S, Oshima M, Fujii C, Mukaida N. Blocking TNF-alpha in mice reduces colorectal carcinogenesis associated with chronic colitis. J Clin Invest. 2008;118:560-570. [PubMed] |
| 17. | Atreya I, Neurath MF. Immune cells in colorectal cancer: prognostic relevance and therapeutic strategies. Expert Rev Anticancer Ther. 2008;8:561-572. [RCA] [PubMed] [DOI] [Full Text] [Cited by in Crossref: 66] [Cited by in RCA: 72] [Article Influence: 6.5] [Reference Citation Analysis (0)] |
| 18. | Clevers H. At the crossroads of inflammation and cancer. Cell. 2004;118:671-674. [RCA] [PubMed] [DOI] [Full Text] [Cited by in Crossref: 393] [Cited by in RCA: 373] [Article Influence: 17.8] [Reference Citation Analysis (0)] |
| 19. | MacDermott RP. Chemokines in the inflammatory bowel diseases. J Clin Immunol. 1999;19:266-272. [RCA] [PubMed] [DOI] [Full Text] [Cited by in Crossref: 113] [Cited by in RCA: 115] [Article Influence: 4.4] [Reference Citation Analysis (0)] |
| 20. | Wang JM, Deng X, Gong W, Su S. Chemokines and their role in tumor growth and metastasis. J Immunol Methods. 1998;220:1-17. [RCA] [PubMed] [DOI] [Full Text] [Cited by in Crossref: 236] [Cited by in RCA: 234] [Article Influence: 8.7] [Reference Citation Analysis (0)] |
| 21. | Waldner MJ, Neurath MF. Cytokines in colitis associated cancer: potential drug targets? Inflamm Allergy Drug Targets. 2008;7:187-194. [RCA] [PubMed] [DOI] [Full Text] [Cited by in Crossref: 35] [Cited by in RCA: 41] [Article Influence: 2.4] [Reference Citation Analysis (0)] |
| 22. | Keeley EC, Mehrad B, Strieter RM. Chemokines as mediators of neovascularization. Arterioscler Thromb Vasc Biol. 2008;28:1928-1936. [RCA] [PubMed] [DOI] [Full Text] [Full Text (PDF)] [Cited by in Crossref: 157] [Cited by in RCA: 156] [Article Influence: 9.2] [Reference Citation Analysis (0)] |
| 23. | Aggarwal BB, Pocsik E. Cytokines: from clone to clinic. Arch Biochem Biophys. 1992;292:335-359. [RCA] [PubMed] [DOI] [Full Text] [Cited by in Crossref: 52] [Cited by in RCA: 53] [Article Influence: 1.6] [Reference Citation Analysis (0)] |
| 24. | Malik IA, Moriconi F, Sheikh N, Naz N, Khan S, Dudas J, Mansuroglu T, Hess CF, Rave-Fränk M, Christiansen H. Single-dose gamma-irradiation induces up-regulation of chemokine gene expression and recruitment of granulocytes into the portal area but not into other regions of rat hepatic tissue. Am J Pathol. 2010;176:1801-1815. [RCA] [PubMed] [DOI] [Full Text] [Cited by in Crossref: 49] [Cited by in RCA: 56] [Article Influence: 3.7] [Reference Citation Analysis (0)] |
| 25. | Marra F. Chemokines in liver inflammation and fibrosis. Front Biosci. 2002;7:d1899-d1914. [PubMed] |
| 26. | Owen JD, Strieter R, Burdick M, Haghnegahdar H, Nanney L, Shattuck-Brandt R, Richmond A. Enhanced tumor-forming capacity for immortalized melanocytes expressing melanoma growth stimulatory activity/growth-regulated cytokine beta and gamma proteins. Int J Cancer. 1997;73:94-103. [PubMed] |
| 27. | Mackay CR. Chemokines: immunology’s high impact factors. Nat Immunol. 2001;2:95-101. [PubMed] |
| 28. | Fernandez EJ, Lolis E. Structure, function, and inhibition of chemokines. Annu Rev Pharmacol Toxicol. 2002;42:469-499. [RCA] [PubMed] [DOI] [Full Text] [Cited by in Crossref: 446] [Cited by in RCA: 461] [Article Influence: 20.0] [Reference Citation Analysis (0)] |
| 29. | Kiefer F, Siekmann AF. The role of chemokines and their receptors in angiogenesis. Cell Mol Life Sci. 2011;68:2811-2830. [RCA] [PubMed] [DOI] [Full Text] [Full Text (PDF)] [Cited by in Crossref: 102] [Cited by in RCA: 96] [Article Influence: 6.9] [Reference Citation Analysis (0)] |
| 30. | Belperio JA, Keane MP, Arenberg DA, Addison CL, Ehlert JE, Burdick MD, Strieter RM. CXC chemokines in angiogenesis. J Leukoc Biol. 2000;68:1-8. [PubMed] |
| 31. | Moore BB, Arenberg DA, Addison CL, Keane MP, Strieter RM. Tumor angiogenesis is regulated by CXC chemokines. J Lab Clin Med. 1998;132:97-103. [RCA] [PubMed] [DOI] [Full Text] [Cited by in Crossref: 40] [Cited by in RCA: 33] [Article Influence: 1.2] [Reference Citation Analysis (0)] |
| 32. | Rossi D, Zlotnik A. The biology of chemokines and their receptors. Annu Rev Immunol. 2000;18:217-242. [RCA] [PubMed] [DOI] [Full Text] [Cited by in Crossref: 1803] [Cited by in RCA: 1790] [Article Influence: 71.6] [Reference Citation Analysis (0)] |
| 33. | Yeruva S, Ramadori G, Raddatz D. NF-kappaB-dependent synergistic regulation of CXCL10 gene expression by IL-1beta and IFN-gamma in human intestinal epithelial cell lines. Int J Colorectal Dis. 2008;23:305-317. [RCA] [PubMed] [DOI] [Full Text] [Full Text (PDF)] [Cited by in Crossref: 74] [Cited by in RCA: 85] [Article Influence: 5.0] [Reference Citation Analysis (0)] |
| 34. | Naz N, Moriconi F, Ahmad S, Amanzada A, Khan S, Mihm S, Ramadori G, Malik IA. Ferritin L is the sole serum ferritin constituent and a positive hepatic acute-phase protein. Shock. 2013;39:520-526. [RCA] [PubMed] [DOI] [Full Text] [Cited by in Crossref: 13] [Cited by in RCA: 18] [Article Influence: 1.5] [Reference Citation Analysis (0)] |
| 35. | Yang SK, Eckmann L, Panja A, Kagnoff MF. Differential and regulated expression of C-X-C, C-C, and C-chemokines by human colon epithelial cells. Gastroenterology. 1997;113:1214-1223. [RCA] [PubMed] [DOI] [Full Text] [Cited by in Crossref: 251] [Cited by in RCA: 253] [Article Influence: 9.0] [Reference Citation Analysis (0)] |
| 36. | Hayden MS, Ghosh S. Shared principles in NF-kappaB signaling. Cell. 2008;132:344-362. [RCA] [PubMed] [DOI] [Full Text] [Cited by in Crossref: 3245] [Cited by in RCA: 3784] [Article Influence: 222.6] [Reference Citation Analysis (0)] |
| 37. | Coussens LM, Werb Z. Inflammation and cancer. Nature. 2002;420:860-867. [RCA] [PubMed] [DOI] [Full Text] [Cited by in Crossref: 10123] [Cited by in RCA: 11255] [Article Influence: 489.3] [Reference Citation Analysis (2)] |
| 38. | Terzić J, Grivennikov S, Karin E, Karin M. Inflammation and colon cancer. Gastroenterology. 2010;138:2101-2114.e5. [RCA] [PubMed] [DOI] [Full Text] [Cited by in Crossref: 1333] [Cited by in RCA: 1504] [Article Influence: 100.3] [Reference Citation Analysis (0)] |
| 39. | Iwanaga K, Yang Y, Raso MG, Ma L, Hanna AE, Thilaganathan N, Moghaddam S, Evans CM, Li H, Cai WW. Pten inactivation accelerates oncogenic K-ras-initiated tumorigenesis in a mouse model of lung cancer. Cancer Res. 2008;68:1119-1127. [RCA] [PubMed] [DOI] [Full Text] [Full Text (PDF)] [Cited by in Crossref: 94] [Cited by in RCA: 95] [Article Influence: 5.6] [Reference Citation Analysis (0)] |
| 40. | O’Hayer KM, Brady DC, Counter CM. ELR+ CXC chemokines and oncogenic Ras-mediated tumorigenesis. Carcinogenesis. 2009;30:1841-1847. [RCA] [PubMed] [DOI] [Full Text] [Cited by in Crossref: 22] [Cited by in RCA: 29] [Article Influence: 1.8] [Reference Citation Analysis (0)] |
| 41. | Kreeger PK, Mandhana R, Alford SK, Haigis KM, Lauffenburger DA. RAS mutations affect tumor necrosis factor-induced apoptosis in colon carcinoma cells via ERK-modulatory negative and positive feedback circuits along with non-ERK pathway effects. Cancer Res. 2009;69:8191-8199. [RCA] [PubMed] [DOI] [Full Text] [Cited by in Crossref: 42] [Cited by in RCA: 41] [Article Influence: 2.6] [Reference Citation Analysis (0)] |
| 42. | Dalum I, Butler DM, Jensen MR, Hindersson P, Steinaa L, Waterston AM, Grell SN, Feldmann M, Elsner HI, Mouritsen S. Therapeutic antibodies elicited by immunization against TNF-alpha. Nat Biotechnol. 1999;17:666-669. [RCA] [PubMed] [DOI] [Full Text] [Cited by in Crossref: 108] [Cited by in RCA: 109] [Article Influence: 4.2] [Reference Citation Analysis (0)] |
| 43. | Waldner MJ, Foersch S, Neurath MF. Interleukin-6--a key regulator of colorectal cancer development. Int J Biol Sci. 2012;8:1248-1253. [RCA] [PubMed] [DOI] [Full Text] [Full Text (PDF)] [Cited by in Crossref: 233] [Cited by in RCA: 304] [Article Influence: 23.4] [Reference Citation Analysis (0)] |
| 44. | Gough DJ, Levy DE, Johnstone RW, Clarke CJ. IFNgamma signaling-does it mean JAK-STAT? Cytokine Growth Factor Rev. 2008;19:383-394. [RCA] [PubMed] [DOI] [Full Text] [Cited by in Crossref: 244] [Cited by in RCA: 252] [Article Influence: 14.8] [Reference Citation Analysis (0)] |
| 45. | Slattery ML, Lundgreen A, Bondurant KL, Wolff RK. Interferon-signaling pathway: associations with colon and rectal cancer risk and subsequent survival. Carcinogenesis. 2011;32:1660-1667. [RCA] [PubMed] [DOI] [Full Text] [Cited by in Crossref: 82] [Cited by in RCA: 81] [Article Influence: 5.8] [Reference Citation Analysis (0)] |
| 46. | Schroder K, Hertzog PJ, Ravasi T, Hume DA. Interferon-gamma: an overview of signals, mechanisms and functions. J Leukoc Biol. 2004;75:163-189. [RCA] [PubMed] [DOI] [Full Text] [Cited by in Crossref: 2690] [Cited by in RCA: 3021] [Article Influence: 137.3] [Reference Citation Analysis (0)] |
| 47. | Liu F, Hu X, Zimmerman M, Waller JL, Wu P, Hayes-Jordan A, Lev D, Liu K. TNFα cooperates with IFN-γ to repress Bcl-xL expression to sensitize metastatic colon carcinoma cells to TRAIL-mediated apoptosis. PLoS One. 2011;6:e16241. [RCA] [PubMed] [DOI] [Full Text] [Full Text (PDF)] [Cited by in Crossref: 39] [Cited by in RCA: 50] [Article Influence: 3.6] [Reference Citation Analysis (0)] |
| 48. | Mukaida N, Baba T. Chemokines in tumor development and progression. Exp Cell Res. 2012;318:95-102. [RCA] [PubMed] [DOI] [Full Text] [Cited by in Crossref: 70] [Cited by in RCA: 68] [Article Influence: 5.2] [Reference Citation Analysis (0)] |
| 49. | Li A, Varney ML, Singh RK. Constitutive expression of growth regulated oncogene (gro) in human colon carcinoma cells with different metastatic potential and its role in regulating their metastatic phenotype. Clin Exp Metastasis. 2004;21:571-579. [RCA] [PubMed] [DOI] [Full Text] [Cited by in Crossref: 61] [Cited by in RCA: 64] [Article Influence: 3.2] [Reference Citation Analysis (0)] |
| 50. | Banks C, Bateman A, Payne R, Johnson P, Sheron N. Chemokine expression in IBD. Mucosal chemokine expression is unselectively increased in both ulcerative colitis and Crohn’s disease. J Pathol. 2003;199:28-35. [RCA] [PubMed] [DOI] [Full Text] [Cited by in Crossref: 265] [Cited by in RCA: 278] [Article Influence: 12.6] [Reference Citation Analysis (0)] |
| 51. | Cunningham D, Humblet Y, Siena S, Khayat D, Bleiberg H, Santoro A, Bets D, Mueser M, Harstrick A, Verslype C. Cetuximab monotherapy and cetuximab plus irinotecan in irinotecan-refractory metastatic colorectal cancer. N Engl J Med. 2004;351:337-345. [RCA] [PubMed] [DOI] [Full Text] [Cited by in Crossref: 3767] [Cited by in RCA: 3705] [Article Influence: 176.4] [Reference Citation Analysis (1)] |
| 52. | Sunaga N, Shames DS, Girard L, Peyton M, Larsen JE, Imai H, Soh J, Sato M, Yanagitani N, Kaira K. Knockdown of oncogenic KRAS in non-small cell lung cancers suppresses tumor growth and sensitizes tumor cells to targeted therapy. Mol Cancer Ther. 2011;10:336-346. [RCA] [PubMed] [DOI] [Full Text] [Full Text (PDF)] [Cited by in Crossref: 144] [Cited by in RCA: 145] [Article Influence: 10.4] [Reference Citation Analysis (0)] |
| 53. | Hingorani SR, Petricoin EF, Maitra A, Rajapakse V, King C, Jacobetz MA, Ross S, Conrads TP, Veenstra TD, Hitt BA. Preinvasive and invasive ductal pancreatic cancer and its early detection in the mouse. Cancer Cell. 2003;4:437-450. [RCA] [PubMed] [DOI] [Full Text] [Cited by in Crossref: 1827] [Cited by in RCA: 1895] [Article Influence: 86.1] [Reference Citation Analysis (0)] |
| 54. | Milne AN, Carneiro F, O’Morain C, Offerhaus GJ. Nature meets nurture: molecular genetics of gastric cancer. Hum Genet. 2009;126:615-628. [RCA] [PubMed] [DOI] [Full Text] [Full Text (PDF)] [Cited by in Crossref: 160] [Cited by in RCA: 174] [Article Influence: 10.9] [Reference Citation Analysis (1)] |
| 55. | Schubbert S, Shannon K, Bollag G. Hyperactive Ras in developmental disorders and cancer. Nat Rev Cancer. 2007;7:295-308. [RCA] [PubMed] [DOI] [Full Text] [Cited by in Crossref: 1186] [Cited by in RCA: 1175] [Article Influence: 65.3] [Reference Citation Analysis (0)] |
| 56. | Duyao MP, Kessler DJ, Spicer DB, Bartholomew C, Cleveland JL, Siekevitz M, Sonenshein GE. Transactivation of the c-myc promoter by human T cell leukemia virus type 1 tax is mediated by NF kappa B. J Biol Chem. 1992;267:16288-16291. [PubMed] |
| 57. | Modest DP, Camaj P, Heinemann V, Schwarz B, Jung A, Laubender RP, Gamba S, Haertl C, Stintzing S, Primo S. KRAS allel-specific activity of sunitinib in an isogenic disease model of colorectal cancer. J Cancer Res Clin Oncol. 2013;139:953-961. [PubMed] |


