Published online Sep 15, 1996. doi: 10.3748/wjg.v2.i3.167
Revised: May 12, 1996
Accepted: June 21, 1996
Published online: September 15, 1996
AIM: To pre-operatively assess tumor thromboses associated with hepatocellular carcinoma in the portal vein.
METHODS: Twenty-five patients diagnosed with a thrombus due to hepatocellular carcinoma were included in the study. MR imaging was performed with a 1.0T superconducting magnetic imaging system. Both T1 and T2 weighed images as well as FLASH sequences were obtained in the transverse plane, and additional FLASH images were obtained in the coronal plane.
RESULTS: Thromboses located in the portal vein had signal intensities similar to those of the main tumor. An intrinsic portal vein thrombus was found in 16 patients, and six thromboses were occlusive. Thromboses were found in the diffuse narrow portal branches of 3 patients. The portal venous thromboses displayed an area of signal intensity that replaced the normal flow void of the portal vein. The affected portal veins displayed a stumpy appearance, had irregular areas of stenosis, and showed formation of a vascular net.
CONCLUSION: MRI was more sensitive, specific, and noninvasive for detecting a portal tumor thrombus, and can be used jointly with spin echo (SE) and gradient echo (GRE) imaging techniques.
- Citation: Zhu XX, Chen JK, Lu GM. Magnetic resonance imaging of portal vein invasion in hepatocellular carcinoma: Results from 25 cases. World J Gastroenterol 1996; 2(3): 167-170
- URL: https://www.wjgnet.com/1007-9327/full/v2/i3/167.htm
- DOI: https://dx.doi.org/10.3748/wjg.v2.i3.167
Primary hepatocellular carcinoma (HCC) is pathologically characterized by its propensity to invade the portal venous system. A pre-operative assessment should be preformed when a tumor thrombus is present in the main portal vein. If the results confirm that the tumor has invaded the portal branches of one lobe, resection may be indicated. MRI is the least invasive method by which the scanning plane can be easily changed to allow the use of angiography for examining the vascular structure. Here, we summarized the results of pre-operative MR assessments of portal venous thromboses that had been confirmed by sonography, enhanced CT or arterial portography in 25 patients with HCC.
Twenty-five male patients (age range 33-64 years, mean age = 54 years) with HCC were enrolled in this study. The patients had tumors that ranged from 3 cm to 10 cm in diameter. Fifteen of the patients had been diagnosed as HCC by a histologic examination of tissue biopsy, and ten were diagnosed based on having a serum alpha fetoprotein (AFP) level that was persistently > 500 μg/L.
A Magneton Impact 1.0T superconducting magnetic resonance system (Siemens; Munich, Germany) was used to obtain T1 and T2 weighed images with a TR of 500 ms and an echo time (TE) of 15 ms (TR/TE = 500.660/15). Additionally, long TR/short TE and long TR/TE (1800-2150/22-120) images, as well as spin echo (SE) images in the transverse plane were obtained by using a multisection imaging technique [10 mm section thickness; 200 × 256 matrix; 380 mm × 400 mm field of view (FOV)]. Gradient echo (GRE) sequences were obtained for all patients using the sequential section technique with the following parameters: TR of 100 ms, TE of 6 ms, flip angle of 30 degrees, an 8 mm section thickness, a 128 × 256 matrix, and a 400 mm × 400 mm field of view. Additional FLASH images were obtained in the coronal plane so as to observe possible tumor thromboses located in the main portal vein or its branches, as well as the inferior vena cava (IVC). All patients were asked to momentarily suspend their respiration during GRE measurements.
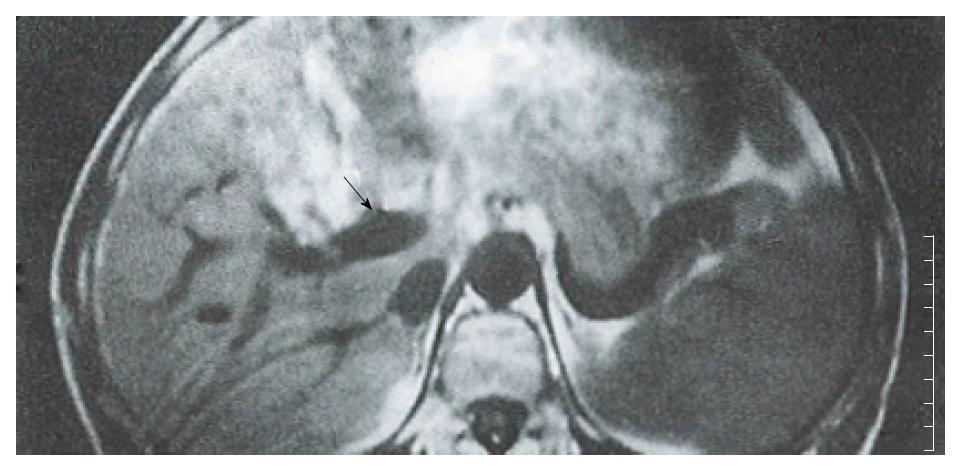
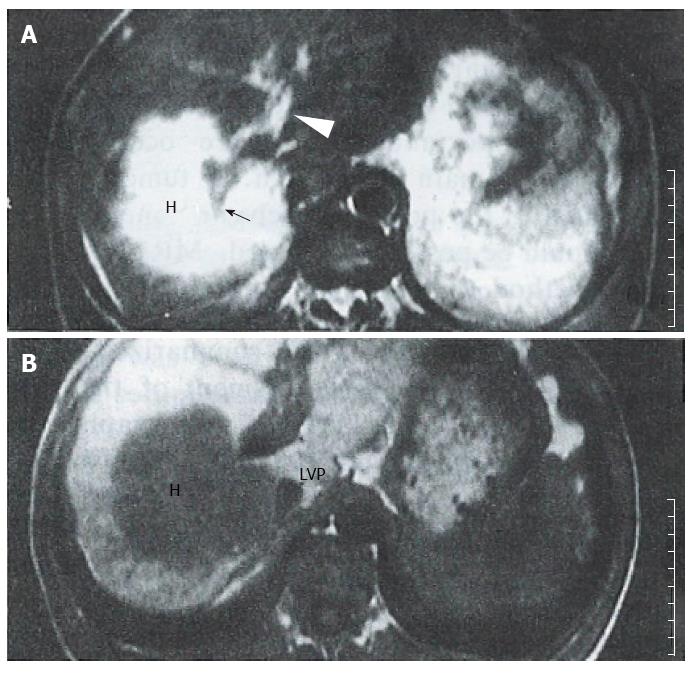
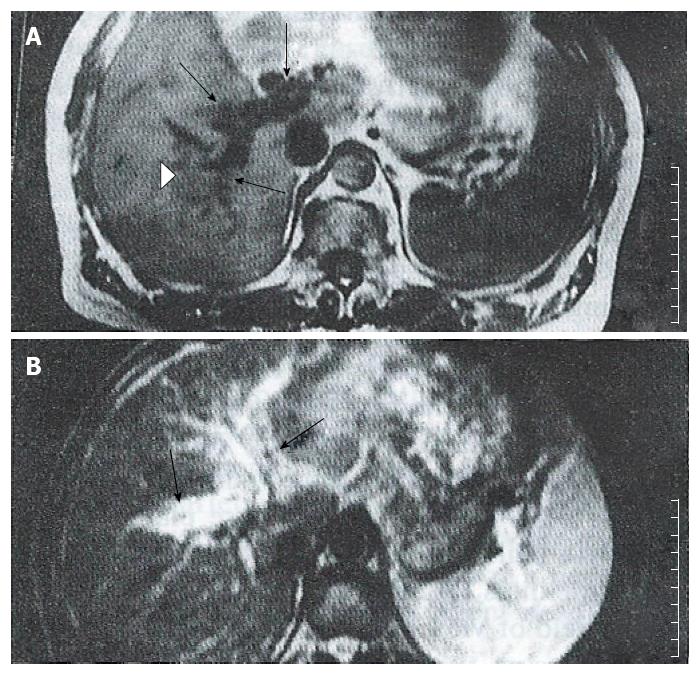
A thrombosis was diagnosed in 25 patients enrolled in one or more studies which used contrast material enhanced CT alone, n = 5; color sonography alone, n = 9; contrast material enhanced CT plus color sonography, n = 6; angiography alone, n = 5, respectively. Tumor thromboses displayed signal intensities similar to those of the main tumor masses. An intrinsic portal venous thrombus (PVT) was found in 16 patients, and appeared as an area of iso-signal intensity that replaced the normal flow void in the portal vein on SE images (Figure 1). On GRE images, the intrinsic thromboses appeared as areas of decreased signal intensity in bright blood vessels. In six cases with complete postal vein occlusion, the thrombus was located either laterally or in the surrounding portal branches. SE images showed a stumpy portal vein with dilated proximal branches; the main section of the portal vein and its peripheral branches could not be identified. On long TR images, the signal intensity was slightly higher than that of the hepatic parenchyma, and similar to that of the main tumor; additionally, occluded portal branches could be seen in the tumor (Figure 2). In the GRE images, the bright portal vein appeared to end abruptly due to poor contrast between the thrombus and adjacent stationary tissue. In 3 cases with diffuse narrow portal branches, T1 weighted images showed the portal branches had irregular stenoses with a flowing void area. T2 images showed some slight hyperintensity along the vascular wall caused by invasion of the tumor (Figure 3). Collateral vessels had developed in 3 cases. Numerous periportal collateral voids were seen on T1 weighed images. GRE images displayed features similar to those shown on SE images, but with stronger signal intensities. GRE images conclusively demonstrated the presence of collateral vessels and showed more extensive collateralization than the standard SE images. Ten patients showed evidence of extrinsic compression of the main or proximal right or left portal vein or IVC by the tumor. The SE and GRE images showed similar findings; however, when compared with the SE images, the GRE images less clearly showed that the tumor was responsible for venous compression. This was due to poor contrast between the tumor and surrounding normal tissue on the GRE images.
Direct portography is the most accurate pre-operative method for assessing portal venous invasion by HCC[1]. While arterial portography is the standard pre-operative method used in many hospitals, these examinations increase the risk of bleeding in patients with impaired clotting function. Noninvasive imaging of the portal venous system has been successfully accomplished with a variety of imaging techniques, including US, CT, and MRI. Color sonography has proved to be highly accurate in determining the presence, direction, and velocity of portal blood flow, but it is operatively dependent[2]. Although contrast-enhanced CT with dynamic scanning is highly sensitive for identifying a thrombus in the main portal vein or its large branches, the suboptimal opacity of portal vessels and allergic reactions limit the use of this technique.
The spin-echo (SE) technique provided anatomic information similar to that provided by CT, but did not require the IV injection of a liver contrast agent. Our standard assessment of the portal venous system (PVS) by use of SE imaging produced a typical signal void, “black blood” phenomenon, and the hepatic venous signal intensity was similar to that of the portal vein. While the portal and hepatic veins could be distinguished based on their direction, they were difficult to distinguish on the peripheral parenchyma without adding an additional plane. FLASH techniques[3] generally offer two advantages that improve depiction of the hepatic vasculature: (1) high signal intensity within blood vessels due to flow enhancement; and (2) a reduction in motion artifacts, because the patients must hold their breath. The portal vein and its branches appeared to be clear when examined by FLASH with presaturation in additional coronal or sagittal planes. The high intensity signal produced by flowing blood clearly distinguished the intra-abdominal vasculature from the surrounding tissue. Additionally, the image acquisition time was significantly reduced when using GRE imaging rather than conventional SE imaging.
Thrombus of the portal vein is usually clinically associated with hepatocellular carcinoma, and pathologically associated with its intra-hepatic metastasis. A tumor thrombus may extend into the portal trunk, even when a hepatocellular carcinoma is still small[4]. There is a poor correlation between tumor size and the presence of a tumor thrombus in the portal vein. The MR findings of PVT were classified based on their location in the portal vein.
An intra-luminal thrombus could be present at any location in the portal vein. On spin-echo MR images, a PVT usually appeared as an area with an abnormal signal within the lumen of the portal vein. Intrinsic PVTs appeared as an isointense signal that replaced the normal portal flow void on T1 weighed images (Figure 1). Additionally, intrinsic PVTs typically showed high signal intensities on T2 weighed images, and which were similar to that of the main tumor. Some spurious signals were difficult to distinguish from a thrombus on SE images; while, GRE images showed the portal vein as an area with a high signal and a reduced number of respiratory artifacts. A PVT usually appeared as an area having a diminished intravascular signal with an intensity similar to that shown by adjacent stationary soft tissue on GRE imaging. While GRE more clearly showed the PVT, it provided less anatomic resolution and live-lesion contrast.
Occlusion usually occurred at the base of the narrow portal vein. The stenosed portal vein was occluded by compression caused by the extrinsic tumor. This was also true for the tumor enclosed portal vein. In SE images, the portal vein or its branches were completely replaced by tumor tissue. T1 weighed images showed the branches as stumps, the flow void of the distal segment of the portal vein as being obliterated, and the proximal branches being dilated. A stumpy appearing portal vein could be seen in the tumor, which grew around the invaded branches (Figure 2). Secondary ischemic changes caused by the PVT in the HCC could be readily distinguished from the tumor. The use of MRI was advantageous in that it showed the patchy perfusion of the occluded vein. Dynamic MR imaging showed a fan-shaped area, and also high signal intensity areas with early and prolonged enhancement in segments that were affected by the portal vein thrombus[5].GRE images only showed a high signal portal stump, because the intensity of the thrombus was similar to that of the adjacent stationary tissues. Collateral veins and varices were also visible.
The portal vein was diffusely stenosed in one or more of its branches. Extensive stenosis is usually associated with cirrhosis. Sections of venous wall that had been penetrated by a growing tumor had an irregular appearance and displayed several small nodules. While the signal void of the portal vein was present, the small vessels were poorly delineated on the T1 weighed images. T2 weighted images showed hyperintense regions along portal branches which had been invaded by the tumor (Figure 3). The bright portal vein was poorly delineated on GRE images.
Collateral vessels developed and effectively replaced the obliterated portal vein. These vessels formed a major hepatoportal venous conduit when the portal vein was severely stenosed or occluded. The collateral vessels usually appeared in the same area as the affected vessels, and a severely stenosed or occluded portal vein showed evidence of collateralization. Small dilated and expanded collateral veins near the edge of the portal vein showed numerous areas of periportal hypointensity on SE images. GRE images showed findings similar to those on SE images, but with hyperintensity. Collateral vessels and varices were seen clearly, and appeared to be more extensive on MR images.
SE images were slightly more specific. Motion or flow-related artifacts can sometimes produce a spurious signal in the portal vein that mimics the signal produced by a thrombus. This is due to the markedly variable signal intensity of flowing blood. Therefore, SE and GRE should be used in combination when attempting to diagnosis a thrombus. GRE images are more sensitive than SE images, because a thrombus is usually well differentiated from flowing blood. Also, GRE images can be obtained more rapidly due to the shorter examination time. The accuracy of a thrombosis diagnosis can be significantly improved by using a combination of SE and GRE imaging techniques[6].
In our study, transverse plane images were obtained with both SE and GRE sequences for all patients, and additional corneal plane images were obtained with GRE sequences. The coronal plane provided wide coverage and was particularly useful when imaging tortuous vessels. Coronal GRE images acquired immediately after injection of Gd DTPA were similar to those acquired by X-ray angiography[7]. MR angiography was used as a non-invasive method for displaying vasculature. The MIP algorithm provided extremely high levels of contrast between blood vessels and the surrounding tissues, and was particularly useful for displaying tortuous vessels. Johnson et al[8] showed that MR angiography was more sensitive than conventional angiography in detecting varices. However, the joint use of SE and GRE images still had some disadvantages. The major limitations are suboptimal spatial resolution and the production of artifacts. Also, the presence of a thrombus in small vessels can be extremely difficult to delineate by MR.
Original title:
S- Editor: Yang RC L- Editor: Filipodia E- Editor: Li RF
| 1. | Igawa S, Sakai K, Kinoshita H, Hirohashi K, Inoue T. Comparison of sonography, computed tomography, angiography, and percutaneous transhepatic portography in detection of portal tumor thrombus in hepatoma. World J Surg. 1986;10:876-883. [RCA] [PubMed] [DOI] [Full Text] [Cited by in Crossref: 5] [Cited by in RCA: 5] [Article Influence: 0.1] [Reference Citation Analysis (0)] |
| 2. | Ralls PW. Color Doppler sonography of the hepatic artery and portal venous system. AJR Am J Roentgenol. 1990;155:517-525. [RCA] [PubMed] [DOI] [Full Text] [Cited by in Crossref: 89] [Cited by in RCA: 89] [Article Influence: 2.5] [Reference Citation Analysis (0)] |
| 3. | Haase A, Frahm J, Mattaei D, Hanicke W, Merboldt KD. FLASH imaging. Rapid NMR imaging using low flip-angle pulse. J Magn Reson. 1986;67:258-266. [RCA] [DOI] [Full Text] [Cited by in Crossref: 231] [Cited by in RCA: 161] [Article Influence: 12.4] [Reference Citation Analysis (0)] |
| 4. | Imaeda T, Yamawaki Y, Hirota K, Suzuki M, Seki M, Doi H. Tumor thrombus in the branches of the distal portal vein: CT demonstration.. J Comput Assist Tomogr. 1989;13:262-268. [RCA] [PubMed] [DOI] [Full Text] [Cited by in Crossref: 13] [Cited by in RCA: 15] [Article Influence: 0.4] [Reference Citation Analysis (0)] |
| 5. | Mitani T, Nakamura H, Murakami T, Nishikawa M, Maeshima S, Nakanishi K, Marukawa T, Harada K, Hori S, Kozuka T. Dynamic MR studies of hepatocellular carcinoma with portal vein tumor thrombosis. Radiat Med. 1992;10:232-234. [PubMed] |
| 6. | Arrivé L, Menu Y, Dessarts I, Dubray B, Vullierme MP, Vilgrain V, Najmark D, Nahum H. Diagnosis of abdominal venous thrombosis by means of spin-echo and gradient-echo MR imaging: analysis with receiver operating characteristic curves. Radiology. 1991;181:661-668. [RCA] [PubMed] [DOI] [Full Text] [Cited by in Crossref: 31] [Cited by in RCA: 19] [Article Influence: 0.6] [Reference Citation Analysis (0)] |
| 7. | Rodgers PM, Ward J, Baudouin CJ, Ridgway JP, Robinson PJ. Dynamic contrast-enhanced MR imaging of the portal venous system: comparison with x-ray angiography. Radiology. 1994;191:741-745. [RCA] [PubMed] [DOI] [Full Text] [Cited by in Crossref: 44] [Cited by in RCA: 36] [Article Influence: 1.2] [Reference Citation Analysis (0)] |
| 8. | Johnson CD, Ehman RL, Rakela J, Ilstrup DM. MR angiography in portal hypertension: detection of varices and imaging techniques. J Comput Assist Tomogr. 1991;15:578-584. [RCA] [PubMed] [DOI] [Full Text] [Cited by in Crossref: 25] [Cited by in RCA: 27] [Article Influence: 0.8] [Reference Citation Analysis (0)] |


