Published online Oct 7, 2013. doi: 10.3748/wjg.v19.i37.6284
Revised: April 24, 2013
Accepted: May 16, 2013
Published online: October 7, 2013
Processing time: 274 Days and 6.3 Hours
AIM: To evaluate the accuracy of endoscopic ultrasound (EUS) elastography for differentiating between pancreatic ductal adenocarcinoma (PDAC) and pancreatic inflammatory masses (PIM).
METHODS: Electronic databases (updated to December 2012) and manual bibliographical searches were carried out. A meta-analysis of all diagnostic clinical trials evaluating the accuracy of EUS elastography in differentiating PDAC from PIM was conducted. Heterogeneity was assessed among the studies. The meta-analysis was performed to evaluate the accuracy of EUS elastography in differentiating PDAC from PIM in homogeneous studies.
RESULTS: Ten studies involving 781 patients were included in the analysis. Significant heterogeneity in sensitivity was observed among the studies (Cochran Q test = 24.16, df = 9, P = 0.0041, I2 = 62.8%), while heterogeneity in specificity was not observed (Cochran Q test = 5.93, df = 9, P = 0.7473, I2 = 0.0%). The area under the curve under the Sports Rights Owners Coalition was 0.8227. Evaluation of heterogeneity suggested that the different diagnostic standards used in the included studies were the source of heterogeneity. In studies using the color pattern as the diagnostic standard, the pooled sensitivity, specificity, positive likelihood ratio (LR), negative LR and diagnostic OR were 0.99 (0.97-1.00), 0.76 (0.67-0.83), 3.36 (2.39-4.72), 0.03 (0.01-0.07) and 129.96 (47.02-359.16), respectively. In studies using the hue histogram as the diagnostic standard, the pooled sensitivity, specificity, positive LR, negative LR and diagnostic OR were 0.92 (0.89-0.95), 0.68 (0.57-0.78), 2.84 (2.05-3.93), 0.12 (0.08-0.19) and 24.69 (12.81-47.59), respectively.
CONCLUSION: EUS elastography is a valuable method for the differential diagnosis between PDAC and PIM. And a preferable diagnostic standard should be explored and improvements in specificity are required.
Core tip: Pancreatic inflammatory masses (PIM) are easily confused with pancreatic ductal adenocarcinoma (PDAC). Endoscopic ultrasound (EUS) elastography is a promising noninvasive method for differentiating between PDAC and PIM and may prove to be a valuable supplemental method to EUS-guided fine-needle aspiration.
- Citation: Li X, Xu W, Shi J, Lin Y, Zeng X. Endoscopic ultrasound elastography for differentiating between pancreatic adenocarcinoma and inflammatory masses: A meta-analysis. World J Gastroenterol 2013; 19(37): 6284-6291
- URL: https://www.wjgnet.com/1007-9327/full/v19/i37/6284.htm
- DOI: https://dx.doi.org/10.3748/wjg.v19.i37.6284
Pancreatic cancer is a highly lethal disease, and approximately 90% of pancreatic tumors are pancreatic ductal adenocarcinoma (PDAC) which has an extremely poor prognosis[1,2]. The 5-year survival rate of PDAC is as low as 0.2%[3]. The only potentially curable treatment which is surgical resection, relies on early diagnosis[4]. Pancreatic inflammatory masses (PIM) are confused with PDAC[5]. The differential diagnosis between PDAC and PIM is currently still difficult due to non-specific symptoms, signs or imaging presentations[6].
Endoscopic ultrasound (EUS) elastography is a recently developed technique for the differential diagnosis of benign and malignant pancreatic masses and measures the mechanical properties of tissues[7-14]. The tissue elasticity modulus is represented by a transparent color superimposed on the conventional gray-scale B-mode scans. The nature of the tissue is analyzed either by a qualitative method where blue-predominant represents malignancy or a quantitative method where a value of more than 175 represents malignancy.
Pancreatic masses include PDAC, PIM, neuroendocrine tumors, metastatic tumors, lymphoma, sarcoma, insulinoma and lipoma. Several meta-analyses have evaluated the accuracy of EUS elastography in the diagnosis of pancreatic masses. The overall accuracy of EUS elastography in differentiating between PDAC and PIM has not been assessed. The aim of this study was to perform a meta-analysis of existing studies to assess the accuracy of EUS elastography in differentiating between PDAC and PIM.
Studies were selected according to the inclusion and exclusion criteria which were delineated prior to the literature search. The inclusion criteria were: (1) diagnostic clinical trials assessing the accuracy of EUS elastography for differentiating between PDAC and PIM; (2) cytology of EUS-guided fine-needle aspiration (FNA) samples, histopathology of surgical specimens or a follow-up period of at least 6 months as a reference standard; and (3) sufficient data to construct a 2 × 2 table for true-positive, false-positive, false-negative and true-negative findings.
Studies were excluded if they met the following criteria: (1) studies without complete data available for constructing a 2 × 2 table for true-positive, false-positive, false-negative and true-negative findings; (2) studies updated or duplicated; (3) studies which did not report their own data such as editorials, reviews, corresponding letters; and (4) case reports.
Using the Medline, Embase, Web of Science, and Cochrane Central Trials databases up to Dec. 2012, a systematic literature search was conducted. The search strategy was (“elastogram” or “elastography” or “elastosonoendoscopy” or “sonoelastography”) and (“pancreatic” or “pancreas” or “adenocarcinoma” or “inflammatory mass”). To expand the search, we also performed a manual search of abstracts presented at the United European Gastroenterology Week (UEGW) congresses and the American Digestive Disease Week (DDW) from 2000 to 2012. The bibliographies of each peer-reviewed paper were screened for other potentially relevant studies. If missing data were needed, we contacted the appropriate authors by mail.
Data on the differentiation between PDAC and PIM were extracted. The Cochrane Q test was used to assess heterogeneity with a P value < 0.10[15]. I2 was used to describe the percentage variability attributable to heterogeneity rather than sampling errors. I2 > 25% indicated the presence of heterogeneity. The Spearman ρ between the logit of sensitivity and logit of 1-specificity was calculated to assess the presence of a threshold effect. A strong correlation (Spearman ρ < -0.4) suggested the presence of a threshold effect[16]. The source of heterogeneity, with the exception of the threshold effect, was explored by meta-regression analysis[17,18]. The subgroups were predefined, and included diagnostic standard (color pattern vs hue histogram), blind (yes vs unclear), sample size (≥ 50 vs < 50), type of publication (full text vs abstract), and design of study (single center vs multicenter). A P value < 0.05 indicated significance. Pooling was only conducted within the homogeneous groups using the fixed-effect model (Mantel-Haenszel method[19]). Pooling the results with corresponding 95%CI included sensitivity, specificity, positive likelihood ratio (LR), negative LR and diagnostic odds ratio (DOR).
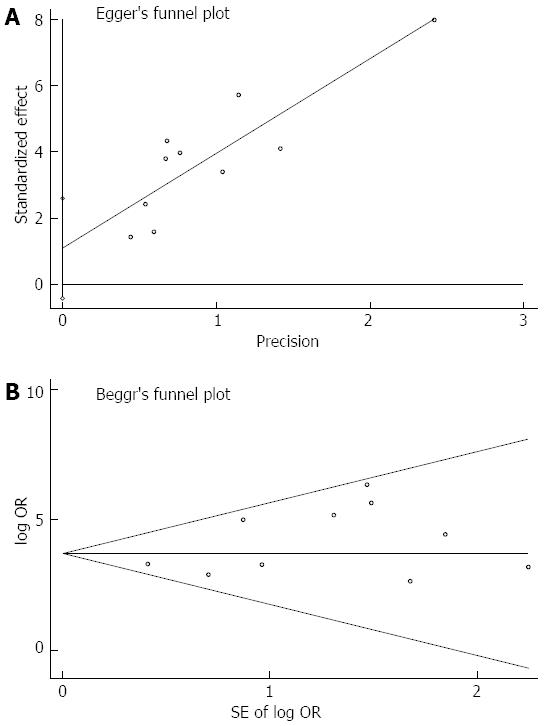
In order to analyze the presence of publication bias, funnel plots were constructed using the Harbord[20] and Egger indicator and Begg[21] and Mazumdar indicator. Asymmetric funnel plots or a P value < 0.1 suggested the presence of publication bias. The quality of the selected studies was assessed using the Quality Assessment of Diagnostic Accuracy Studies (QUADAS) questionnaire[22]. Items were rated as yes, no, or unclear.
The pooled weighted sensitivity, specificity, positive LR, negative LR, DOR, Sports Rights Owners Coalition (SROC) curve and Spearman analysis were performed using Meta-Disc version 1.4 (Unit of Clinical Biostatistics, Ramony Cajal Hospital, Madrid, Spain)[23]. Meta-regression and publication bias analyses were performed using Stata version 10.0 (Stata Corporation, College Station, TX, United States).
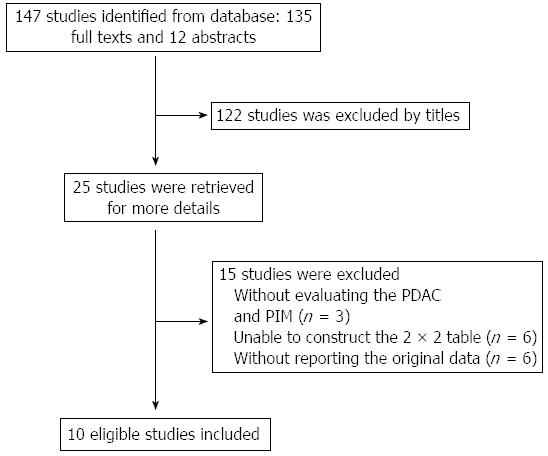
The initial literature search identified a total of 147 studies (Figure 1). Of these 147 studies, 25 potentially relevant studies were retrieved for further evaluation. Ten studies involving 781 patients were finally included in this meta-analysis. The baseline characteristics of the selected studies are listed in Table 1. Nine studies were published as full texts, and 1 as an abstract. Seven studies used the color pattern as the diagnostic standard, while the other three used the hue histogram value.
| Ref. | Type of publication | Design of study | Diagnostic standard | Cut-off | No. |
| Săftoiu et al[7] | Full text | Single center | Hue histogram | > 175 | 54 |
| Iglesias-Garcia et al[8] | Full text | Single center | Color pattern | Blue-predominant | 76 |
| Janssen et al[9] | Full text | Single center | Color pattern | Blue-predominant | 25 |
| Deprez et al[10] | Abstract | Single center | Color pattern | Blue-predominant | 13 |
| Săftoiu et al[11] | Full text | Single center | Hue histogram | > 175 | 43 |
| Iglesias-Garcia et al[12] | Full text | Single center | Color pattern | Blue-predominant | 119 |
| Giovannini et al[13] | Full text | Multicenter | Color pattern | Blue-predominant | 96 |
| Giovannini et al[14] | Full text | Single center | Color pattern | Blue-predominant | 18 |
| Itokawa et al[24] | Full text | Single center | Color pattern | Blue-predominant | 79 |
| Săftoiu et al[34] | Full text | Multicenter | Color pattern | > 175 | 258 |
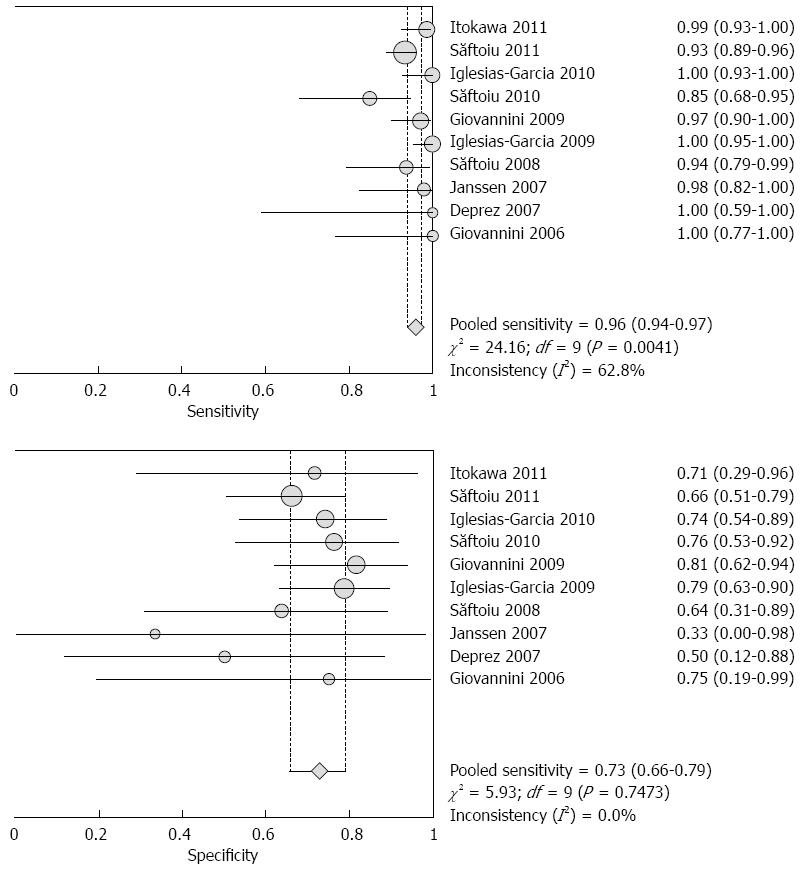
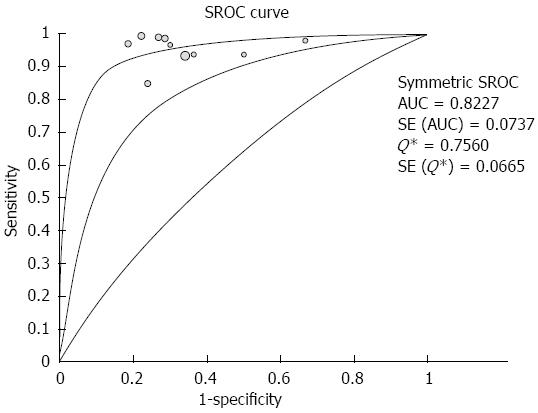
The pooled sensitivity and specificity (random-effect model) of EUS elastography for differentiating between PDAC and PIM were 96% (95%CI: 94-97) and 73% (95%CI: 66-79), respectively. Significant heterogeneity in sensitivity was observed among the studies (Cochran Q test = 24.16, df = 9, P = 0.0041, I2 = 62.8%), while heterogeneity in specificity was not observed (Cochran Q test = 5.93, df = 9, P = 0.7473, I2 = 0.0%) (Figure 2). The AUC under the SROC was 0.8227 (Figure 3).
By excluding the study reported as an abstract, the pooled sensitivity and specificity (random-effect model) were 96% (95%CI: 94-97) and 73% (95%CI: 66-80), respectively. There was significant heterogeneity in sensitivity among the studies (Cochran Q test =23.56, df = 8, P = 0.0027, I2 = 66.1%), while heterogeneity in specificity was not observed (Cochran Q test = 5.50, df = 8, P = 0.8090, I2 = 0.0%). The AUC under the SROC was 0.8188.
The source of heterogeneity was explored. A Spearman ρ of -0.29 (P = 0.41) between the logit of sensitivity and the logit of 1-specificity did not suggest the presence of a threshold effect. The meta-regression analysis showed that the different diagnostic standards used in the selected studies were the source of heterogeneity (P = 0.00). In addition, the characteristics of blinding, sample size, type of publication and design of study were not related to heterogeneity (Table 2).
| Study characteristics | Z | P value | 95%CI |
| Diagnostic standard (color pattern vs hue histogram) | 2.90 | 0.00 | 0.68-3.50 |
| Blind (yes vs unclear) | 1.36 | 0.17 | -0.87-4.82 |
| Sample size (≥ 50 vs < 50) | 0.13 | 0.90 | -1.90-2.17 |
| Type of publication (full text vs abstract) | 1.28 | 0.20 | -1.33-6.37 |
| Design of study (single center vs multicenter) | 0.04 | 0.97 | -1.35-1.40 |
The evaluation of heterogeneity suggested that the different diagnostic standards used in the included studies were the source of heterogeneity. As a result, the meta-analysis was performed on the studies using the same diagnostic standards. The pooled results showed good homogeneity. Pooling was conducted using the fixed-effect model (Mantel-Haenszel method[22]). In studies using the color pattern as the diagnostic standard, the pooled sensitivity, specificity, positive LR, negative LR and DOR were 0.99 (0.97-1.00), 0.76 (0.67-0.83), 3.36 (2.39-4.72), 0.03 (0.01-0.07) and 129.96 (47.02-359.16), respectively. In studies using the hue histogram as the diagnostic standard, the pooled sensitivity, specificity, positive LR, negative LR and DOR were 0.92 (0.89-0.95), 0.68 (0.57-0.78), 2.84 (2.05-3.93), 0.12 (0.08-0.19) and 24.69 (12.81-47.59), respectively (Table 3).
| Pooled estimate | Color pattern (n = 426)1 | Hue histogram (n = 355)2 | ||
| Pooled result (95%CI) | I2 | Pooled result (95%CI) | I2 | |
| Sensitivity | 0.99 (0.97-1.00) | 0.00% | 0.92 (0.89-0.95) | 20.10% |
| Specificity | 0.76 (0.67-0.83) | 0.00% | 0.68 (0.57-0.78) | 0.00% |
| Positive LR | 3.36 (2.39-4.72) | 17.90% | 2.84 (2.05-3.93) | 0.00% |
| Negative LR | 0.03 (0.01-0.07) | 0.00% | 0.12 (0.08-0.19) | 0.00% |
| Diagnostic OR | 129.96 (47.02-359.16) | 0.00% | 24.69 (12.81-47.59) | 0.00% |
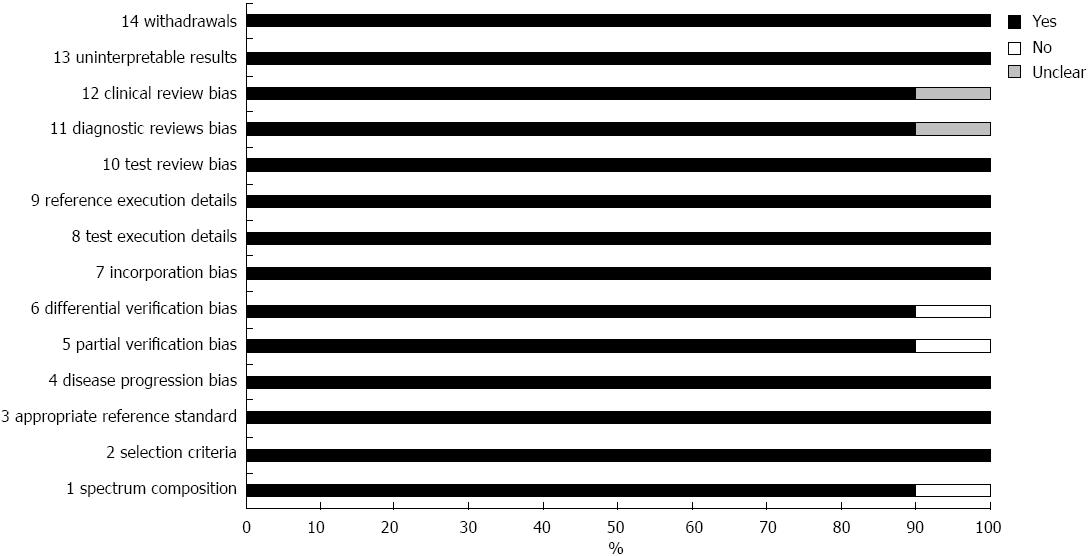
The quality of the selected studies according to the QUADAS questionnaire is shown in Figure 4. The overall quality of the studies was good. Eight studies were rated as “yes” in all items. In the study by Janssen et al[9] all selected patients were referred for EUS-guided FNA or surgery and one of the selected patients was diagnosed with lipoma by CT densitometry without histological proof. As a result, QUADAS question 1, 5 and 6 were rated as “no”. In addition, Jassen et al[9] and Itokawa et al[24] did not mention whether blinding was used in their study. As a result, QUADAS question 11 was rated as “unclear”.
The Harbord-Egger indicator for publication bias provided a value of 1.65 (95%CI: -0.43-2.59, P = 0.14) and the Begg-Mazumdar indicator gave a Kendall’s tau b value of 9 (P = 0.47) for the selected studies, which suggested no publication bias (Figure 5).
Pancreatic cancer is the fourth leading cause of cancer-related death in the USA, and the second among gastrointestinal tumors[25]. Early diagnosis may allow patients to receive the only potentially curable treatment which is surgical resection. PDAC is found in more than 90% of patients with pancreatic cancer and most of the lesions confused with PDAC are benign PIM[5]. PDAC is frequently associated with secondary inflammatory changes caused by obstruction of the pancreatic duct. In addition, chronic pancreatitis can markedly increase the risk of PDAC[26]. As a result, the differential diagnosis between PDAC and PIM is essential for clinical decision-making.
Despite considerable advances in imaging techniques, the diagnosis of PDAC, particularly in the setting of chronic pancreatitis, remains a challenge. There are no characteristic findings to differentiate pancreatic masses on transabdominal ultrasound (TAS) and its accuracy is very low[27]. Computed tomography (CT) and magnetic resonance imaging (MRI) may be used for staging and detecting metastasis, however, these techniques have limited ability in differentiating between PDAC and PIM[28,29]. Endoscopic retrograde cholangiopancreatography (ERCP) has an increased risk of complications, the most important being pancreatitis[30].
EUS, which provides high-resolution images of the pancreas, has become an indispensable tool in the management of pancreatic diseases. However, an important limitation of EUS examination is its low capacity to determine the exact nature of pancreatic masses[31]. EUS-FNA allows pathological diagnosis. It is currently considered an accurate and safe method for the diagnosis of pancreatic disease. However, EUS-FNA is an invasive procedure and the sensitivity of EUS-FNA is less than 75% in the presence of coexistent chronic pancreatitis or “pseudotumoral” pancreatitis[32,33].
EUS elastography is a newly developed technique which assesses the mechanical properties of tissues during conventional EUS examination. In this meta-analysis, no significant publication bias was detected using the Harbord-Egger and Begg-Mazumdar indicators. The meta-regression analysis demonstrated that the different diagnostic standards used in the included studies may be the source of heterogeneity. This meta-analysis indicated that EUS elastography could achieve a very high sensitivity and a moderate specificity for differentiating between PDAC and PIM. As EUS elastography showed good sensitivity it may be an appropriate method for monitoring patients with PIM in whom malignancy has been excluded. In addition, it could also be used to follow patients with PDAC after surgery.
The pooled specificity of EUS elastography may not be satisfactory for differentiating between PDAC and PIM compared with the 100% specificity of EUS-FNA. This may be due to the following reasons: first, diagnostic studies preferred maximal sensitivity in order to reduce the false negative rate when setting up the cutoff value. This reduced the specificity of individual studies. Second, this study focused on the differentiation between PDAC and PIM. The data from normal controls and chronic pancreatitis patients without focal masses, which could easily be excluded from malignancy by EUS elastography, were excluded from this study. This would markedly reduce the number of true negative cases, and thereby decrease specificity.
As an imaging method with moderate specificity, EUS elastography could not replace EUS-FNA which provides a pathological diagnosis. However, it may be a valuable supplemental method to EUS-FNA. EUS elastography and FNA could be performed sequentially during the same EUS procedure. It could be used to guide FNA to reduce the number of false negative cases, especially in patients with coexisting pancreatitis. Moreover, EUS elastography may provide additional information for differentiating between PDAC and PIM when a negative EUS-FNA result is obtained or the patients are unsuitable for FNA.
The diagnostic standard used for the analysis of mechanical properties was correlated with the accuracy of EUS elastography in the differentiation of pancreatic masses. The qualitative color pattern and quantitative hue histogram value are two currently used diagnostic standards. In general, the quantitative diagnostic standard would be considered better because it is an objective method. Base on unified samples (PDAC and PIM), a subgroup analysis was performed to compare these two standards. The results showed that studies using the color pattern as the diagnostic standard showed preferable pooled estimates than those using the hue histogram. This may be due to the fact that both the overall stiffness and the distribution of stiffness were associated with the nature of the tissue. The color pattern diagnostic standard takes the predominant color and the distribution of the color into consideration simultaneously, while the hue histogram value only gives overall stiffness.
There were some limitations in this meta-analysis. One of the selected studies was published as an abstract, and some details were not available. A small number of studies were included in this study which may have reduced the power of the analysis.
In conclusion, EUS elastography is a valuable method for the differential diagnosis between PDAC and PIM. And a preferable diagnostic standard should be explored and improvements in specificity are required.
Endoscopic ultrasound (EUS) elastography is a recently developed technique for the differential diagnosis of benign and malignant pancreatic masses and measures the mechanical properties of tissues. The overall accuracy of EUS elastography in differentiating between pancreatic ductal adenocarcinoma (PDAC) and pancreatic inflammatory masses (PIM) has not been assessed.
Several meta-analyses on the accuracy of EUS elastography in the diagnosis of pancreatic masses have been carried out. The overall accuracy of EUS elastography in differentiating between PDAC and PIM has not been assessed.
Previous studies have mainly focused on the differential diagnosis of benign and malignant pancreatic masses. This analysis suggested that EUS elastography could achieve a very high sensitivity and a moderate specificity for differentiating PDAC from PIM. Such findings were not presented clearly in previous studies.
This analysis suggested that EUS elastography could achieve a very high sensitivity and a moderate specificity for differentiating PDAC from PIM. Due to good sensitivity, EUS elastography may be an appropriate method for monitoring patients with PIM in whom malignancy has been excluded. In addition, it could be used to follow patients with PDAC after surgery.
This is a well-performed meta-analysis of currently available studies on the accuracy of EUS elastography in the differential diagnosis between PDAC and PIM. The authors found that EUS elastography is a promising noninvasive method for differential diagnosis of PDAC and PIM and may prove to be a valuable supplemental method to EUS-guided fine-needle aspiration. This is a good meta-analysis and the authors have included many relevant issues missed by other research groups.
P- Reviewers Kawa S, Pezzilli R, Smith RC S- Editor Wen LL L- Editor A E- Editor Zhang DN
| 1. | Gudjonsson B. Survival statistics gone awry: pancreatic cancer, a case in point. J Clin Gastroenterol. 2002;35:180-184. [RCA] [PubMed] [DOI] [Full Text] [Cited by in Crossref: 34] [Cited by in RCA: 39] [Article Influence: 1.7] [Reference Citation Analysis (0)] |
| 3. | Carpelan-Holmström M, Nordling S, Pukkala E, Sankila R, Lüttges J, Klöppel G, Haglund C. Does anyone survive pancreatic ductal adenocarcinoma? A nationwide study re-evaluating the data of the Finnish Cancer Registry. Gut. 2005;54:385-387. [RCA] [PubMed] [DOI] [Full Text] [Cited by in Crossref: 236] [Cited by in RCA: 233] [Article Influence: 11.7] [Reference Citation Analysis (0)] |
| 4. | Trede M, Schwall G, Saeger HD. Survival after pancreatoduodenectomy. 118 consecutive resections without an operative mortality. Ann Surg. 1990;211:447-458. [RCA] [PubMed] [DOI] [Full Text] [Cited by in Crossref: 783] [Cited by in RCA: 765] [Article Influence: 21.9] [Reference Citation Analysis (0)] |
| 5. | van Gulik TM, Reeders JW, Bosma A, Moojen TM, Smits NJ, Allema JH, Rauws EA, Offerhaus GJ, Obertop H, Gouma DJ. Incidence and clinical findings of benign, inflammatory disease in patients resected for presumed pancreatic head cancer. Gastrointest Endosc. 1997;46:417-423. [RCA] [PubMed] [DOI] [Full Text] [Cited by in Crossref: 108] [Cited by in RCA: 105] [Article Influence: 3.8] [Reference Citation Analysis (0)] |
| 6. | Niederau C, Grendell JH. Diagnosis of pancreatic carcinoma. Imaging techniques and tumor markers. Pancreas. 1992;7:66-86. [RCA] [PubMed] [DOI] [Full Text] [Cited by in Crossref: 113] [Cited by in RCA: 100] [Article Influence: 3.0] [Reference Citation Analysis (0)] |
| 7. | Săftoiu A, Iordache SA, Gheonea DI, Popescu C, Maloş A, Gorunescu F, Ciurea T, Iordache A, Popescu GL, Manea CT. Combined contrast-enhanced power Doppler and real-time sonoelastography performed during EUS, used in the differential diagnosis of focal pancreatic masses (with videos). Gastrointest Endosc. 2010;72:739-747. [RCA] [PubMed] [DOI] [Full Text] [Cited by in Crossref: 71] [Cited by in RCA: 75] [Article Influence: 5.0] [Reference Citation Analysis (0)] |
| 8. | Iglesias-Garcia J, Larino-Noia J, Abdulkader I, Forteza J, Dominguez-Munoz JE. Quantitative endoscopic ultrasound elastography: an accurate method for the differentiation of solid pancreatic masses. Gastroenterology. 2010;139:1172-1180. [RCA] [PubMed] [DOI] [Full Text] [Cited by in Crossref: 202] [Cited by in RCA: 195] [Article Influence: 13.0] [Reference Citation Analysis (1)] |
| 9. | Janssen J, Schlörer E, Greiner L. EUS elastography of the pancreas: feasibility and pattern description of the normal pancreas, chronic pancreatitis, and focal pancreatic lesions. Gastrointest Endosc. 2007;65:971-978. [RCA] [PubMed] [DOI] [Full Text] [Cited by in Crossref: 198] [Cited by in RCA: 178] [Article Influence: 9.9] [Reference Citation Analysis (0)] |
| 10. | Deprez PH, Yeung CPR, Weynand B, Gillain C, Gigot JF, Hubert C, Horsmans Y, Borbath I. Contrast EUS Versus EUS Sono-Elastography in the Differentiation of Atypical Pancreatic Masses. Gastrointest Endosc. 2007;65:AB103. [DOI] [Full Text] |
| 11. | Săftoiu A, Vilmann P, Gorunescu F, Gheonea DI, Gorunescu M, Ciurea T, Popescu GL, Iordache A, Hassan H, Iordache S. Neural network analysis of dynamic sequences of EUS elastography used for the differential diagnosis of chronic pancreatitis and pancreatic cancer. Gastrointest Endosc. 2008;68:1086-1094. [RCA] [PubMed] [DOI] [Full Text] [Cited by in Crossref: 169] [Cited by in RCA: 173] [Article Influence: 10.2] [Reference Citation Analysis (0)] |
| 12. | Iglesias-Garcia J, Larino-Noia J, Abdulkader I, Forteza J, Dominguez-Munoz JE. EUS elastography for the characterization of solid pancreatic masses. Gastrointest Endosc. 2009;70:1101-1108. [RCA] [PubMed] [DOI] [Full Text] [Cited by in Crossref: 126] [Cited by in RCA: 123] [Article Influence: 7.7] [Reference Citation Analysis (0)] |
| 13. | Giovannini M, Thomas B, Erwan B, Christian P, Fabrice C, Benjamin E, Geneviève M, Paolo A, Pierre D, Robert Y. Endoscopic ultrasound elastography for evaluation of lymph nodes and pancreatic masses: a multicenter study. World J Gastroenterol. 2009;15:1587-1593. [RCA] [PubMed] [DOI] [Full Text] [Full Text (PDF)] [Cited by in CrossRef: 204] [Cited by in RCA: 199] [Article Influence: 12.4] [Reference Citation Analysis (0)] |
| 14. | Giovannini M, Hookey LC, Bories E, Pesenti C, Monges G, Delpero JR. Endoscopic ultrasound elastography: the first step towards virtual biopsy? Preliminary results in 49 patients. Endoscopy. 2006;38:344-348. [RCA] [PubMed] [DOI] [Full Text] [Cited by in Crossref: 215] [Cited by in RCA: 212] [Article Influence: 11.2] [Reference Citation Analysis (0)] |
| 15. | Higgins JP, Thompson SG. Quantifying heterogeneity in a meta-analysis. Stat Med. 2002;21:1539-1558. [RCA] [PubMed] [DOI] [Full Text] [Cited by in Crossref: 21630] [Cited by in RCA: 25800] [Article Influence: 1121.7] [Reference Citation Analysis (0)] |
| 16. | Devillé WL, Buntinx F, Bouter LM, Montori VM, de Vet HC, van der Windt DA, Bezemer PD. Conducting systematic reviews of diagnostic studies: didactic guidelines. BMC Med Res Methodol. 2002;2:9. [RCA] [PubMed] [DOI] [Full Text] [Full Text (PDF)] [Cited by in Crossref: 701] [Cited by in RCA: 757] [Article Influence: 32.9] [Reference Citation Analysis (1)] |
| 17. | Lijmer JG, Bossuyt PM, Heisterkamp SH. Exploring sources of heterogeneity in systematic reviews of diagnostic tests. Stat Med. 2002;21:1525-1537. [RCA] [PubMed] [DOI] [Full Text] [Cited by in Crossref: 310] [Cited by in RCA: 340] [Article Influence: 14.8] [Reference Citation Analysis (0)] |
| 18. | Glas AS, Lijmer JG, Prins MH, Bonsel GJ, Bossuyt PM. The diagnostic odds ratio: a single indicator of test performance. J Clin Epidemiol. 2003;56:1129-1135. [RCA] [PubMed] [DOI] [Full Text] [Cited by in Crossref: 1459] [Cited by in RCA: 1683] [Article Influence: 80.1] [Reference Citation Analysis (0)] |
| 19. | Mantel N, Haenszel W. Statistical aspects of the analysis of data from retrospective studies of disease. J Natl Cancer Inst. 1959;22:719-748. [PubMed] |
| 20. | Harbord RM, Egger M, Sterne JA. A modified test for small-study effects in meta-analyses of controlled trials with binary endpoints. Stat Med. 2006;25:3443-3457. [RCA] [PubMed] [DOI] [Full Text] [Cited by in Crossref: 1463] [Cited by in RCA: 1705] [Article Influence: 89.7] [Reference Citation Analysis (0)] |
| 21. | Begg CB, Mazumdar M. Operating characteristics of a rank correlation test for publication bias. Biometrics. 1994;50:1088-1101. [RCA] [PubMed] [DOI] [Full Text] [Cited by in Crossref: 43] [Cited by in RCA: 43] [Article Influence: 1.4] [Reference Citation Analysis (0)] |
| 22. | Whiting P, Rutjes AW, Reitsma JB, Bossuyt PM, Kleijnen J. The development of QUADAS: a tool for the quality assessment of studies of diagnostic accuracy included in systematic reviews. BMC Med Res Methodol. 2003;3:25. [RCA] [PubMed] [DOI] [Full Text] [Full Text (PDF)] [Cited by in Crossref: 2570] [Cited by in RCA: 2734] [Article Influence: 124.3] [Reference Citation Analysis (0)] |
| 23. | Zamora J, Abraira V, Muriel A, Khan K, Coomarasamy A. Meta-DiSc: a software for meta-analysis of test accuracy data. BMC Med Res Methodol. 2006;6:31. [RCA] [PubMed] [DOI] [Full Text] [Full Text (PDF)] [Cited by in Crossref: 1446] [Cited by in RCA: 1573] [Article Influence: 82.8] [Reference Citation Analysis (0)] |
| 24. | Itokawa F, Itoi T, Sofuni A, Kurihara T, Tsuchiya T, Ishii K, Tsuji S, Ikeuchi N, Umeda J, Tanaka R. EUS elastography combined with the strain ratio of tissue elasticity for diagnosis of solid pancreatic masses. J Gastroenterol. 2011;46:843-853. [RCA] [PubMed] [DOI] [Full Text] [Cited by in Crossref: 122] [Cited by in RCA: 113] [Article Influence: 8.1] [Reference Citation Analysis (0)] |
| 25. | Jemal A, Siegel R, Xu J, Ward E. Cancer statistics, 2010. CA Cancer J Clin. 2010;60:277-300. [RCA] [PubMed] [DOI] [Full Text] [Cited by in Crossref: 10002] [Cited by in RCA: 10453] [Article Influence: 696.9] [Reference Citation Analysis (0)] |
| 26. | Malka D, Hammel P, Maire F, Rufat P, Madeira I, Pessione F, Lévy P, Ruszniewski P. Risk of pancreatic adenocarcinoma in chronic pancreatitis. Gut. 2002;51:849-852. [RCA] [PubMed] [DOI] [Full Text] [Cited by in Crossref: 323] [Cited by in RCA: 308] [Article Influence: 13.4] [Reference Citation Analysis (0)] |
| 27. | Hessel SJ, Siegelman SS, McNeil BJ, Sanders R, Adams DF, Alderson PO, Finberg HJ, Abrams HL. A prospective evaluation of computed tomography and ultrasound of the pancreas. Radiology. 1982;143:129-133. [PubMed] |
| 28. | Rösch T, Braig C, Gain T, Feuerbach S, Siewert JR, Schusdziarra V, Classen M. Staging of pancreatic and ampullary carcinoma by endoscopic ultrasonography. Comparison with conventional sonography, computed tomography, and angiography. Gastroenterology. 1992;102:188-199. [PubMed] |
| 30. | Loperfido S, Angelini G, Benedetti G, Chilovi F, Costan F, De Berardinis F, De Bernardin M, Ederle A, Fina P, Fratton A. Major early complications from diagnostic and therapeutic ERCP: a prospective multicenter study. Gastrointest Endosc. 1998;48:1-10. [RCA] [PubMed] [DOI] [Full Text] [Cited by in Crossref: 801] [Cited by in RCA: 779] [Article Influence: 28.9] [Reference Citation Analysis (1)] |
| 31. | Brand B, Pfaff T, Binmoeller KF, Sriram PV, Fritscher-Ravens A, Knöfel WT, Jäckle S, Soehendra N. Endoscopic ultrasound for differential diagnosis of focal pancreatic lesions, confirmed by surgery. Scand J Gastroenterol. 2000;35:1221-1228. [RCA] [PubMed] [DOI] [Full Text] [Cited by in Crossref: 75] [Cited by in RCA: 80] [Article Influence: 3.2] [Reference Citation Analysis (0)] |
| 32. | Varadarajulu S, Tamhane A, Eloubeidi MA. Yield of EUS-guided FNA of pancreatic masses in the presence or the absence of chronic pancreatitis. Gastrointest Endosc. 2005;62:728-36; quiz 751, 753. [PubMed] |


