Copyright
©2012 Baishideng Publishing Group Co.
World J Gastroenterol. Oct 28, 2012; 18(40): 5821-5825
Published online Oct 28, 2012. doi: 10.3748/wjg.v18.i40.5821
Published online Oct 28, 2012. doi: 10.3748/wjg.v18.i40.5821
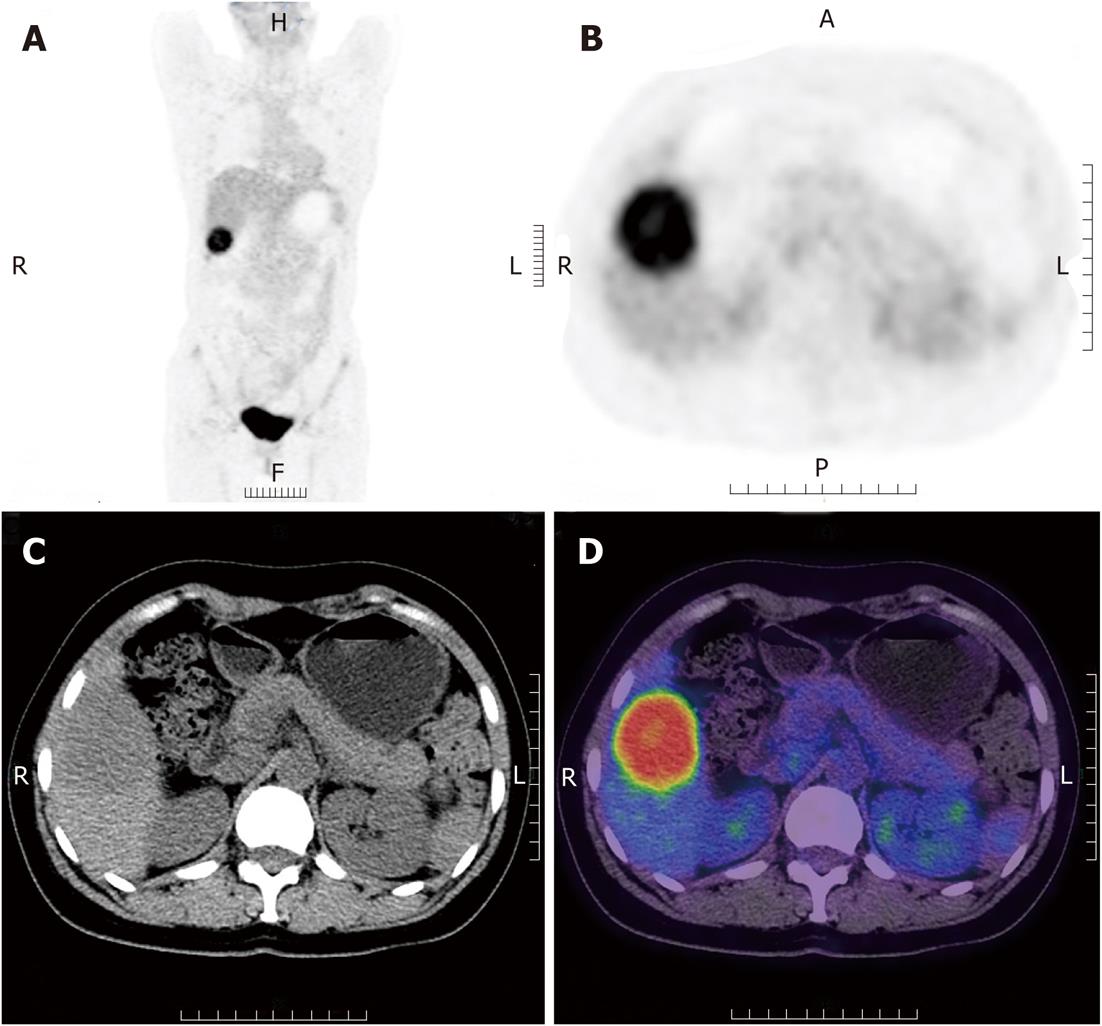
Figure 2 (Fluorine 18) fluoro-2-deoxy-D-glucose positron emission tomography and computed tomography images of the liver inflammatory myofibroblastic tumor.
A: Coronal positron emission tomography (PET) demonstrating an intense (fluorine 18) fluoro-2-deoxy-D-glucose (18F-FDG) uptake with SUV standardized uptake value in the anterior segment of right lobe of the liver; B: Axial PET demonstrating an inhomogeneous intense 18F-FDG uptake; C: Axial computed tomography (CT) demonstrating a round mass with low density; D: Axial PET/CT demonstrating an inhomogeneous intense 18F-FDG uptake in the anterior segment of right lobe. R: Right; L: Left; A: Anterior, P: Posterior; H: Head; F: Foot.
- Citation: Liu XF, He BM, Ou-Yang XH, Wang ZZ, Su JG. Different imaging findings of inflammatory myofibroblastic tumor of the liver. World J Gastroenterol 2012; 18(40): 5821-5825
- URL: https://www.wjgnet.com/1007-9327/full/v18/i40/5821.htm
- DOI: https://dx.doi.org/10.3748/wjg.v18.i40.5821


