Topic Highlight Open Access
Copyright ©2011 Baishideng Publishing Group Co., Limited. All rights reserved.
World J Gastroenterol. Jan 7, 2011; 17(1): 28-41
Published online Jan 7, 2011. doi: 10.3748/wjg.v17.i1.28
Contrast-enhanced and targeted ultrasound
Michiel Postema, Emmy Noether Research Group, Institute of Medical Engineering, Department of Electrical Engineering and Information Sciences, Ruhr-Universität Bochum, 44780 Bochum, Germany
Michiel Postema, Department of Physics and Technology, University of Bergen, 5007 Bergen, Norway
Michiel Postema, Department of Engineering, The University of Hull, Kingston upon Hull HU6 7RX, United Kingdom
Michiel Postema, Centre de Biophysique Moléculaire, UPR 4301 CNRS affiliated to the University of Orléans, 45071 Orléans, France
Odd Helge Gilja, National Center for Ultrasound in Gastroenterology, Department of Medicine, Haukeland University Hospital, 5021 Bergen, Norway
Odd Helge Gilja, Institute of Medicine, University of Bergen, 5007 Bergen, Norway
Author contributions: Postema M and Gilja OH wrote the paper.
Correspondence to: Dr. Michiel Postema, Professor, Department of Physics and Technology, University of Bergen, Allégaten 55, 5007 Bergen, Norway. michiel.postema@rub.de
Telephone: +47-555-82880 Fax: +47-555-89440
Received: July 2, 2010
Revised: September 3, 2010
Accepted: September 10, 2010
Published online: January 7, 2011

Abstract

Ultrasonic imaging is becoming the most popular medical imaging modality, owing to the low price per examination and its safety. However, blood is a poor scatterer of ultrasound waves at clinical diagnostic transmit frequencies. For perfusion imaging, markers have been designed to enhance the contrast in B-mode imaging. These so-called ultrasound contrast agents consist of microscopically small gas bubbles encapsulated in biodegradable shells. In this review, the physical principles of ultrasound contrast agent microbubble behavior and their adjustment for drug delivery including sonoporation are described. Furthermore, an outline of clinical imaging applications of contrast-enhanced ultrasound is given. It is a challenging task to quantify and predict which bubble phenomenon occurs under which acoustic condition, and how these phenomena may be utilized in ultrasonic imaging. Aided by high-speed photography, our improved understanding of encapsulated microbubble behavior will lead to more sophisticated detection and delivery techniques. More sophisticated methods use quantitative approaches to measure the amount and the time course of bolus or reperfusion curves, and have shown great promise in revealing effective tumor responses to anti-angiogenic drugs in humans before tumor shrinkage occurs. These are beginning to be accepted into clinical practice. In the long term, targeted microbubbles for molecular imaging and eventually for directed anti-tumor therapy are expected to be tested.

Key Words: Ultrasound; Drug delivery systems; Drug targeting; Sonoporation; Contrast media; Liver; Pancreas; Gastrointestinal tract


INTRODUCTION

Advanced medical imaging has a strong impact on research and clinical decision-making in real-time assessment of angiogenesis in digestive cancers. Ultrasonic imaging is becoming the most popular medical imaging modality, owing to the low price per examination[1] and its safety[2]. A B-mode ultrasound scan shows contrasted regions from transitions in acoustic impedance, i.e. transitions in tissue type, in the form of brighter pixels. However, blood is a poor scatterer of ultrasound waves at clinical diagnostic transmit frequencies, which lie between 1 and 40 MHz. For perfusion imaging, markers have been designed to enhance the contrast in B-mode imaging. These so-called ultrasound contrast agents consist of microscopically small gas bubbles encapsulated in biodegradable shells.

Contrast-enhanced ultrasound (CEUS) represents a significant advancement in the evaluation of angiogenesis in digestive cancers. In particular, in the study of focal liver lesions, CEUS has been widely used for detection and characterization of malignancy. The unique feature of CEUS of non-invasive assessment in real-time liver perfusion throughout the vascular phases has led to a great improvement in diagnostic accuracy of ultrasound, but also in guidance and evaluation of responses to therapy. Currently, CEUS is part of the state-of-the-art diagnostic work-up of focal liver lesions, resulting in safe and cost-effective patient management.

In this review, the physical principles of ultrasound contrast agent microbubble behavior and adjustments for drug delivery, including sonoporation, are described. Furthermore, an outline of clinical imaging applications of CEUS is given.

Ultrasound

The sound that humans can perceive lies within the frequency range 20 Hz-20 kHz. Ultrasound is by definition all sound higher than 20 kHz. The ultrasound frequencies utilized in medical imaging are mainly in the range 1-40 MHz. Such high frequencies cannot be transmitted through air but can be transmitted satisfactorily through solid or fluid materials. An ultrasonic transducer serves a dual function as both transmitter and receiver of ultrasound. A signal generated by an ultrasonic transducer typically consists of a pulse of a few μs with a certain center frequency. Part of this signal propagates through target tissue, part is reflected by macroscopic tissue structures, part is absorbed by tissue, and part is scattered by structures in the tissue smaller than the acoustic wavelength. Only a small portion of the transmitted acoustic energy is received by the transducer, but this portion is used to build an ultrasonic image. The received signal is the superposition of specular reflections at tissue boundaries and echoes from tissue backscattering[3]. Current real-time 2-dimensional imaging capabilities are in excess of 30 frames per second[4]. Contemporary imaging techniques have been summarized by Wells[5].

The quality of a B-mode scan is expressed by the contrast-to-noise ratio, which is defined as the absolute difference of the signal-to-noise ratio in the target tissue and the signal-to-noise ratio in the surrounding tissue[4].

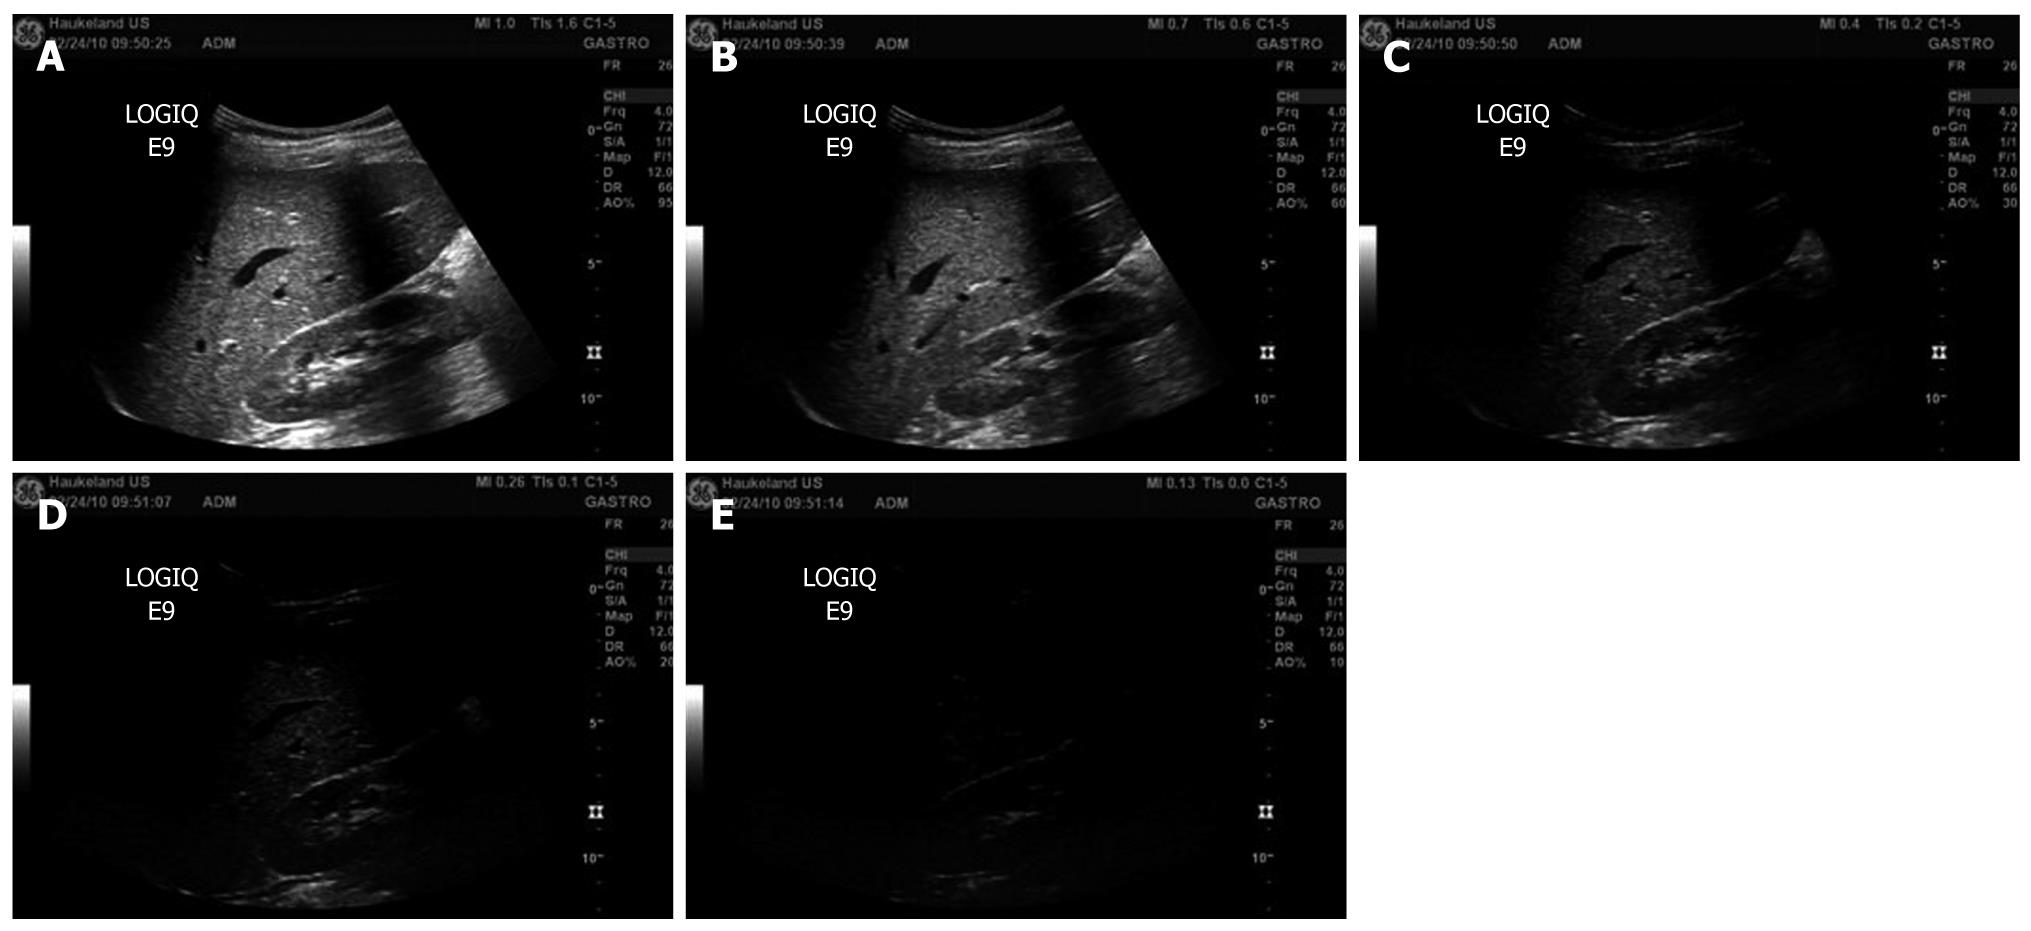
On clinical ultrasound devices, the intensity of the ultrasonic field is generally adjusted with a switch for the mechanical index (MI) instead of the acoustic amplitude. The MI depends on the maximum value of peak negative pressure and the centre frequency of the ultrasound field[6]. For MI < 0.3, the acoustic amplitude is considered low. For 0.3 < MI < 0.7, there is a possibility of minor damage to neonatal lung or intestine[6]. These are considered moderate acoustic amplitudes. For MI > 0.7, there is a risk of cavitation if an ultrasound contrast agent containing gas microspheres is being used, and there is a theoretical risk of cavitation without the presence of ultrasound contrast agents[6]. The risk increases with MI values above this threshold[6]. These are considered high acoustic amplitudes[7]. In commercial scanners, the MI has been limited to 1.9 for medical imaging[8]. Figure 1 shows examples of B-mode scans recorded at different MI. At higher MI, the contrast-to-noise ratio increases.

Figure 1
Figure 1 B-mode images of the liver recorded at decreasing mechanical index values (A-E). A: Mechanical index (MI) = 1.0; B: MI = 0.7; C: MI = 0.4; D: MI = 0.26; E: MI = 0.13.
Microbubble physics

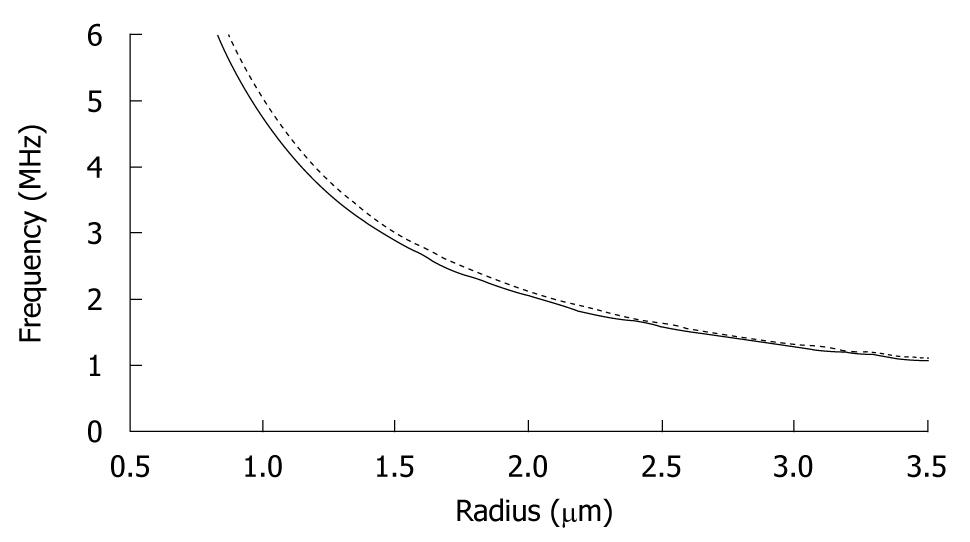
The density and compressibility parameters of blood cells hardly differ from those of plasma. Therefore, blood cells are poor scatterers in the clinical diagnostic frequency range[9]. Since imaging blood flow and measuring organ perfusion are desirable for diagnostic purposes, markers should be added to the blood to differentiate between blood and other tissue types. Such markers must have resonance frequencies in the medical ultrasonic range. Figure 2 shows the resonance frequencies of free and encapsulated gas microbubbles as a function of their equilibrium radius. The resonance frequencies of encapsulated microbubbles lie slightly higher than those of free gas bubbles[10,11], but clearly well within the clinical diagnostic range, too. Based on their acoustic properties, microbubbles are well suited as an ultrasound contrast agent.

Figure 2
Figure 2 Resonance frequencies of free (unencapsulated) (solid line) and lipid-encapsulated (dotted line) microbubbles as a function of equilibrium radius.

The pressure inside a bubble must be higher than the ambient pressure[12]. This difference is generally referred to as the surface pressure. The smaller the bubble, the higher is the surface pressure. Since fluids are forced to flow from a location with a higher pressure to a location with a lower pressure, a bubble cannot exist in true equilibrium. For example, a free air bubble with a 6 μm diameter dissolves within 100 ms[13]. To prevent quick dissolution, ultrasound contrast agent microbubbles contain low-solubility gas, such as SF6 or C3F8[14]. The encapsulating shells are made of biodegradable materials, such as phospholipids or albumin[15]. With mean diameters below 6 μm, these microbubbles are small enough to pass through the lung capillaries. Detailed overviews of the compositions of the ultrasound contrast agents used most in imaging research have been given by Postema et al[3], Sboros[16] and Tinkov et al[17]. In this section, we classify ultrasound contrast agents into only 4 categories, based on the presence of an encapsulating shell and its thickness, similar to Tinkov et al[17].

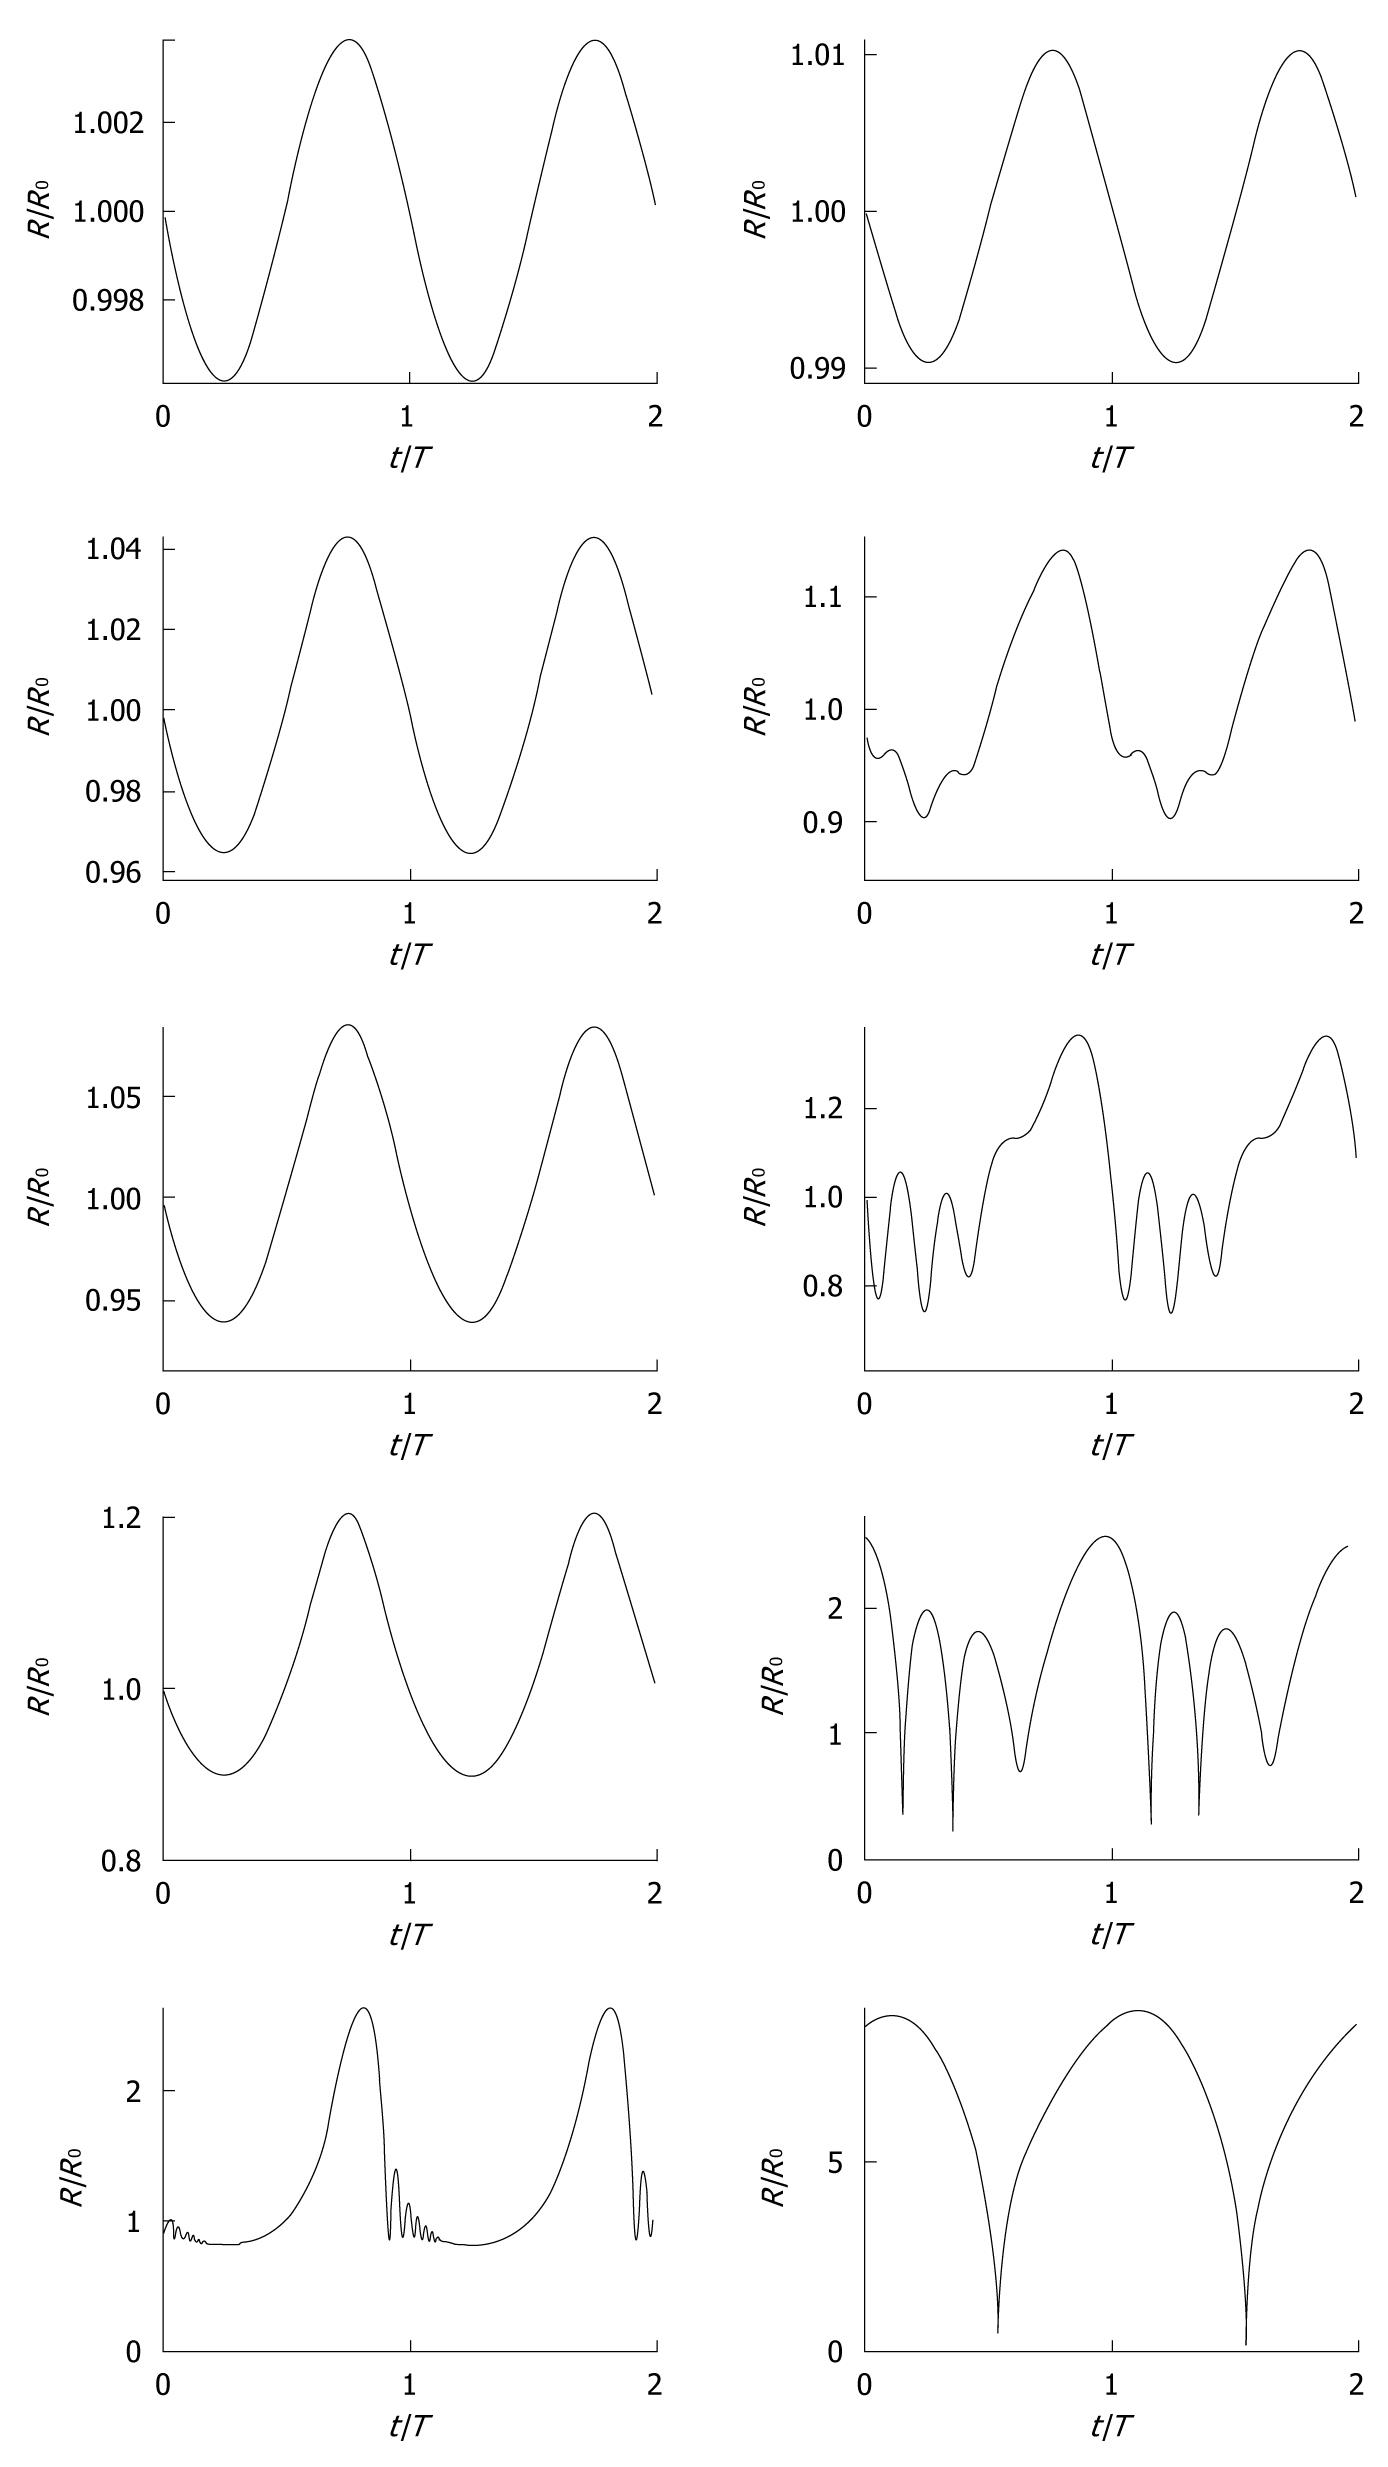
A bubble in a low-amplitude sound field can be considered a forced damped harmonic oscillator[18,19] and its oscillating behavior can, as a result, be modeled as a mass-spring-dashpot system[20]. The spherically symmetric oscillating behavior of ultrasound contrast agent microbubbles has been described with models based on the Rayleigh-Plesset equation[21], modified for the presence of an encapsulating shell[22-32]. Generally, the presence of blood has a relatively small effect on bubble dynamics[33]. To give an indication of the vast amount of existing models: Qin et al[34] defined 16 separate dynamic bubble model classes. The reason for the high number of existing models is the fact that most physical properties of encapsulated microbubbles cannot actually be measured, so that pseudo-material properties have to be chosen when predicting ultrasound contrast agent microbubble behavior. Examples of such pseudo-material properties are shell elasticity parameters and shell friction parameters. At low-amplitude driving pressures, an ultrasound contrast agent microbubble oscillates linearly, i.e. the bubble excursion if proportional to the instantaneous pressure. However, at high-amplitude driving pressures, it oscillates nonlinearly. Figure 3 demonstrates the oscillation behavior of 2 contrast microbubbles subjected to continuous sine pressure waves with low, moderate, and high amplitudes. Both bubbles oscillate linearly at MI = 0.01. With increasing driving amplitude, asymmetries in radial excursion and expansion time rise, especially for the bigger bubble, which is closer to the resonance size. At MI = 0.8, both bubbles expand to a factor of the initial size, followed by a rapid collapse of the smaller bubble. The bigger bubble demonstrates collapse at MI = 0.18 and higher.

Figure 3
Figure 3 Simulated radius-time curves (radius R normalized with equilibrium radius R0, time t normalized with period T0) of ultrasound contrast microbubbles with 0. 55 μm (left column) and 2.3 μm (right column) equilibrium radii, respectively, modeled with a conservative Rayleigh-Plesset equation[3], using a conservative shell stiffness parameter[148]. The modeled ultrasound field was a continuous sine wave with a frequency of 0.5 MHz and acoustic amplitudes corresponding to (top-bottom) mechanical index = 0.01, 0.10, 0.18, 0.35, and 0.80, similar to the experiments by Karshafian et al[92].

A dynamic bubble generates an acoustic signal that depends on the fluid displacement by the bubble as a function of time. Detection strategies have been developed to discriminate acoustic signal-generated by ultrasound contrast agent microbubbles from other acoustic signals such as specular reflections and tissue scattering. These strategies are the reason that CEUS is suitable for the detection of blood. The 10 most common detection strategies include coded excitation, harmonic power Doppler, phase inversion and power modulation[34,35]. All single-pulse and multi-pulse imaging detection strategies make use of the nonlinear behavior of microbubbles[34,35].

Other types of nonlinear behavior than asymmetric oscillations are discussed below.

If a bubble with a negligible shell collapses near a free or a solid boundary, the retardation of the liquid near the boundary may cause bubble asymmetry. This asymmetry causes differences in acceleration on the bubble surface. During further collapse, a funnel-shaped jet may protrude through the bubble, shooting liquid to the boundary[36]. Such jets have been observed in high-speed observations of ultrasound contrast agent microbubbles[37-40]. Empirical relations exist between the collapsing bubble radius, the jet length, and the pressure at the tip of jets[41-43]. It has been speculated whether microbubble jetting can be applied for ultrasound-guided drug delivery[38,39,42].

During the collapse phase, a bubble may fragment into a number of smaller bubbles[44]. Fragmentation has been observed with contrast agents with thin elastic shells. The number of fragments into which a contrast microbubble breaks up has been associated with asymmetric oscillations[40,45]. Fragmentation can be predicted from the moment when the kinetic energy of the bubble surpasses its surface energy[27]. Bubble fragmentation costs energy, but the subsequent coalescence of bubble fragments generates enough acoustic energy to be detected[27].

Thick-shelled microbubbles have demonstrated sonic cracking during a high-amplitude ultrasonic cycle[46,47]. The increased pressure difference between inside and outside of the microbubble during the expansion phase of the wave[48] causes the shell to be stretched until it surpasses a critical deformation[49], resulting in its mechanical cracking. The released bubble has an expansion amplitude much higher than an encapsulated bubble of identical size. Therefore, the acoustic signal from an ultrasound contrast agent after gas release differs from that of the same contrast agent before gas release, until the released gas has dissolved[50].

After a disruptive ultrasonic burst, the disappearance of microbubble fragments or released gas can be traced with low-amplitude ultrasound, as well as the wash-in rate of fresh contrast agent[51]. Hence, the efficiency of the disruptive burst can be measured.

Bubble translation in the direction of the sound field is caused by a primary radiation force resulting from a pressure gradient across the bubble surface[52]. The translation is maximal in the contraction phase of the oscillating microbubble. Making use of this phenomenon, ultrasound contrast agent microbubbles can be forced to move farther away from the transducer, towards vessel walls[53-61], increasing the success rate of targeting to a boundary.

In a standing sound wave field[62], bubbles can aggregate to clusters ultimately a quarter of the acoustic wavelength apart[61]. The formation of ultrasound contrast agent microbubble clusters and the ultrasonic pushing of these clusters towards a vessel wall have been recently observed using high-speed photography[61].

The occurrence of the above-mentioned phenomena is influenced by (1) the ultrasonic parameters: transmit frequency, acoustic amplitude, pulse length, pulse repetition rate and transmit phase; (2) the ultrasound contrast agent composition: the composition of the shell, the bubble sizes, the size distribution and the gas; and (3) the physical properties of the medium: viscosity, surface tension, saturation.

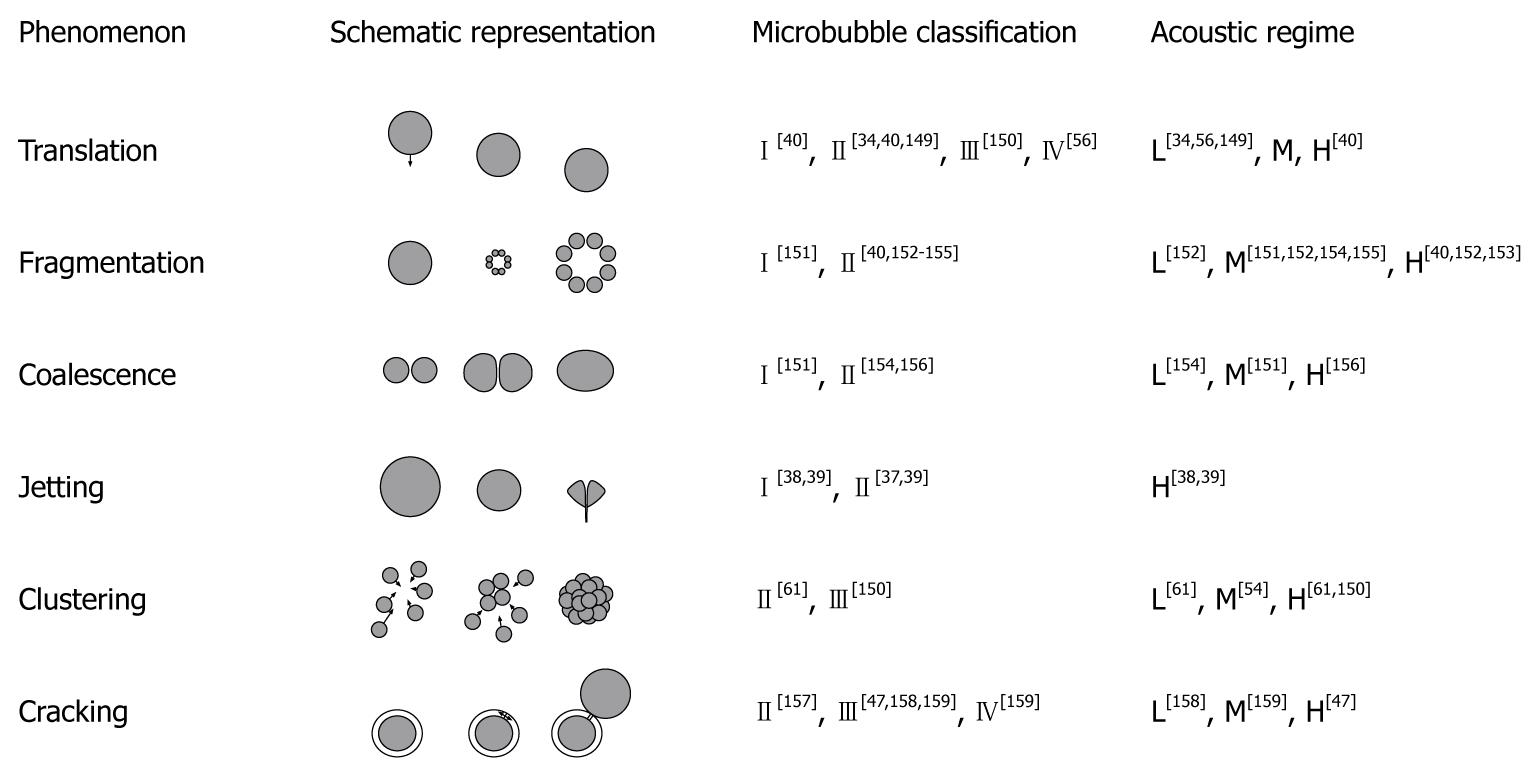
Figure 4 gives an overview of the nonlinear phenomena that have been observed with ultrasound contrast agents, the type of ultrasound contrast agent in which they have occurred, and the minimum acoustic regime required.

Figure 4
Figure 4 Nonlinear phenomena and the regimes for their occurrence. Microbubble shell classes: (I) free or released gas; (II) thin shells < 10 nm; (III) thick shells < 500 nm; (IV) very thick shells > 500 nm. Acoustic regimes: low (L) for mechanical index (MI) < 0.3; medium (M) for 0.3 < MI < 0.7; high (H) for MI > 0.7. The figure has been based on Postema[12].
Molecular imaging

Dayton et al[35] defined molecular imaging as the non-invasive application of an imaging modality to discern changes in physiology on a molecular level[12]. Although ultrasound contrast agents were intended for perfusion imaging, they have proven useful in molecular imaging as well, after modification of the microbubble shell. Dayton et al[35] discerned 2 targeting strategies: active targeting, in which a ligand specific for the molecular target, and passive targeting, in which the physiochemical properties of the agent are used to achieve retention at the target site[12]. Molecular imaging and targeting have been reviewed elsewhere in depth[35,63]. In summary, the main applications include the detection of angiogenesis, inflammation, plaques and thrombi[8,12,17].

Drug delivery

It has been proven by numerous groups, that the cellular uptake of drugs and genes is increased, when the region of interest is under sonication, and even more so when a contrast agent is present[12,64-91]. This increased uptake has been attributed to the formation of transient porosities in the cell membrane, which are big enough for the transport of drugs into the cell. The transient permeabilization and resealing of a cell membrane is called sonoporation[64]. The sonoporation-induced cellular uptake of markers with molecular weights between 10 kDa and 3 MDa has been reported in several studies[17,74,92]. Schlicher et al[93] showed that ultrasound-induced cavitation facilitated cellular uptake of macromolecules with diameters up to 56 nm. Even solid spheres with a 100 nm diameter have been successfully delivered with the aid of sonoporation[82]. This implies that drug size is not a limiting factor for intracellular delivery[92]. However, the pore opening times can be so short that, if the drug is to be effectively internalized, it should be released close to the cell membrane when poration occurs[94].

There are 2 hypotheses for explaining the sonoporation phenomenon, the first being microbubble oscillations near a cell membrane, the second being microbubble jetting through the cell membrane. Based on modeling, high-speed photography, and recent cellular uptake measurements, we concluded that microbubble jetting behavior can be excluded as the dominant sonoporation mechanism[7]. The influence of microbubble disruption, i.e. fragmentation or sonic cracking, on sonoporation will have to be further investigated[7]. Without the presence of an agent, it has been assumed that sonoporation is caused by bubbles, which have been generated in the transducer focus as a result of inertial cavitation[95,96].

Instead of just facilitating the transient opening up of cell membranes, a microbubble might also act as the vehicle itself to carry a drug or gene load to a perfused region of interest, in which case the load has to be released with the assistance of ultrasound. Apart from mixing ultrasound contrast agent with a therapeutic agent, several schemes have been proposed to combine microbubbles with a therapeutic load[97]. Tinkov et al[17] discriminated the following 7 microbubble structure classes for drug delivery: (1) attachment to the outer shell surface; (2) intercalation between monolayer phospholipids; (3) incorporation in a layer of oil; (4) formation of complexes with smaller particles (secondary carriers); (5) physical encapsulation in a polymer layer and coating with biocompatible material; (6) surface loading of protein-shelled microbubbles; and (7) entire volume loading of protein-shelled microbubbles. The drugs are to be released at the site of interest during insonication[98], presumably by disrupting the microbubble shell. It has been demonstrated in vitro, that higher doses of DNA were delivered during ultrasound insonication when the DNA was loaded on albumin-encapsulated microbubbles than when unloaded microbubbles were mixed with plasmid DNA[67]. Amounts of DNA loading on microbubbles have been between 0.002 (pg/μm2)[99] and 2.4 (pg/μm2)[17,67].

Instead of attaching a drug to the capsule, therapeutic compounds in the gas phase might be encapsulated with thick shells, to keep them from dissolving. At the region of interest, the shell should be cracked with ultrasound, releasing the gaseous content[46,47,100,101]. However, only a few therapeutic compounds exist in the gaseous phase, e.g. nitric oxide[48] and several gaseous anesthetics.

A therapeutic agent inside the microbubble shell may react with the shell and dampen the bubble oscillations. Therefore, it might be more suitable to have the therapeutic agent in the core of the microbubble, separated from the shell by a gaseous layer. Incorporating a liquid drop containing drugs or genes inside an ultrasound contrast agent microbubble, however, is technically challenging[102]. As opposed to bubbles, antibubbles consist of a liquid core encapsulated by gas[103]. Such a droplet inside a bubble may be generated with the jetting phenomenon: the collapse of a bubble near a free surface produces a liquid jet[104], which may break up into one or several droplets[105]. Another option would be to stabilize the liquid core by means of a biodegradable skeleton attached to the microbubble shell.

It has been noted, that, if microbubbles can create pores, it is also possible to create severe cell and tissue damage[106]. There is an inverse correlation between cell permeability and cell viability[92,107-109], i.e. not all cell membrane pores are temporary. This indicates that sonoporation is just a transitory membrane damage in the surviving cell[92]. Cell lysis results from irreversible mechanical cell membrane damage[110], which allows the intracellular content to leak out[64]. Only recently, ultrasound-induced apoptosis has been observed with cancer cells in vitro[110,111], and also in the presence of an ultrasound contrast agent[112]. Apart from situations where lysis is desired (sonolysis)[113], ultrasonic settings should be chosen such that cell lysis is minimal. Side effects observed are capillary rupture, hemorrhage, and dye extravasation[106]. These side effects, however, have been associated with relatively high microbubble concentrations, long ultrasonic pulse lengths, and high acoustic intensities[106].

CLINICAL IMAGING APPLICATIONS
Liver

Ultrasonography is the most commonly used imaging modality worldwide for diseases of the liver. However, it has limited sensitivity in the detection of small tumor nodules. In addition, ultrasonographic findings are often nonspecific, as images of benign and malignant liver lesions overlap considerably. The introduction of microbubble contrast agents and the development of contrast-specific techniques have opened new prospects in liver ultrasonography. The advent of second-generation agents that enable continuous real-time contrast-enhanced imaging has been instrumental in improving the acceptance and reproducibility of the examination. With the publication of guidelines for the use of contrast agents in liver ultrasonography by the European Federation of Societies for Ultrasound in Medicine and Biology (EFSUMB)[114,115], CEUS is now routinely used in clinical practice.

As opposed to contrast media used with computed tomography (CT) and magnetic resonance (MR) imaging, ultrasound contrast agents can visualize the capillary net of the examined tissue, because CEUS is considerably more sensitive to very small amounts of contrast agent, even to single bubbles. Furthermore, because sonography is a dynamic method that is performed in real time, additional information about tissue perfusion can be deduced from the influx and washout of the contrast media, thus facilitating the differential diagnosis of tumors. In addition, signals from the microbubbles enable the visualization of slow flow in microscopic vessels without Doppler-related artifacts. Various software packages have been developed to enable quantification of changes in contrast intensity and to provide additional objective information over the entire course of the contrast examination.

Microbubbles enable dynamic imaging of tumor angiogenesis. This approach is now routinely used for diagnosis, particularly for the detection and characterization of various liver tumors.

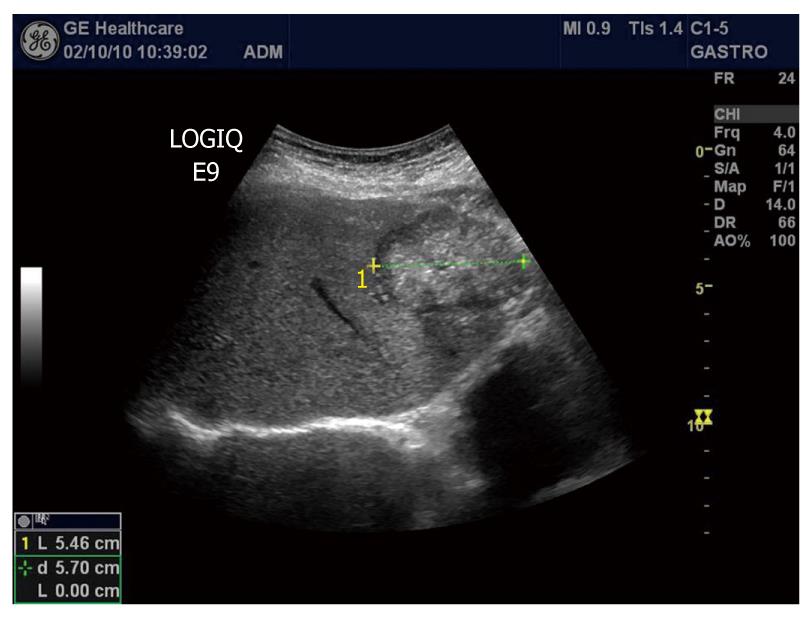
The most common malignancy of the liver is metastases. Hepatic metastasis is a sign of advanced tumor stage, and curative treatment is only possible in a very small number of patients. When the objective is cure, liver resection is the most effective therapy, but several ablation techniques have evolved. For directed tumor therapy, accurate imaging of the number and distribution of the metastases is required. On grey-scale ultrasound images, metastases may appear as hypo-, iso- or hyperechoic lesions, and some of them have a halo (Figure 5). Unenhanced ultrasonography achieves a sensitivity between 45% and 80% in detecting liver metastases[116,117]. Not surprisingly, this compares unfavorably with the results of studies with contrast-enhanced CT and MR. However, the application of an intravascular ultrasound contrast agent during transcutaneous ultrasonography of the liver improves detection of metastases significantly[118-120].

Figure 5
Figure 5 B-mode image of a metastasis from a colon cancer to the liver appearing hyperechoic with a dark halo.

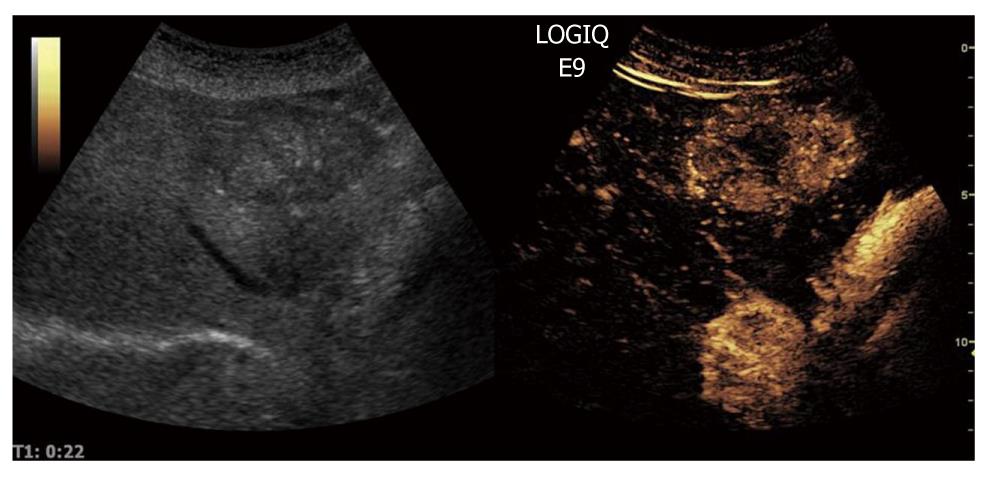
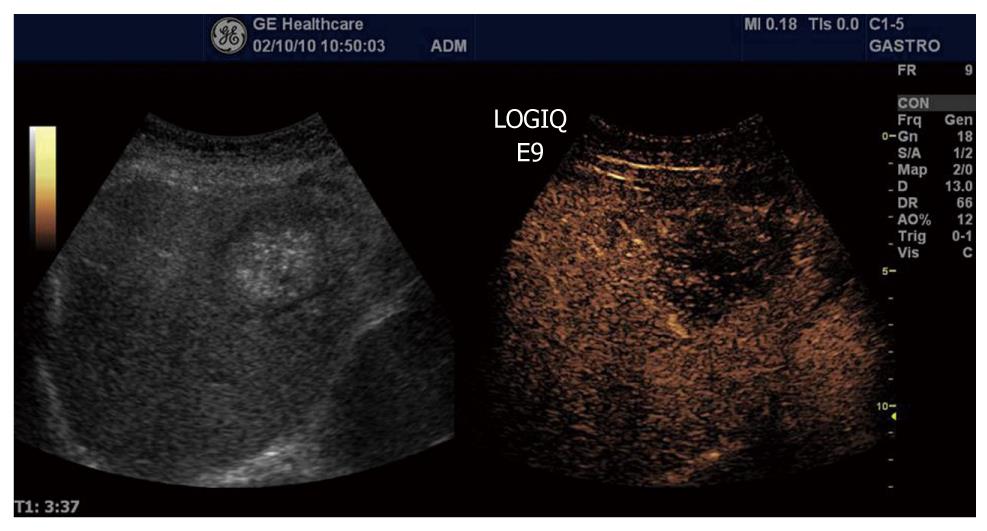
After injection, 3 phases of contrast enhancement can be differentiated: the arterial phase, in which the contrast agent reaches the liver first via the hepatic artery; the portal phase, where the contrast agent has passed circulation and spreads through the liver in the portal branches; and the late or parenchymal phase, in which the agent slowly distributes within the entire liver parenchyma. Metastases show characteristic features in all 3 phases after contrast agent injection. Differentiation of hypervascular from hypovascular metastases is achieved perfectly by real-time imaging during the arterial phase: hypervascular metastases, e.g. from malignant melanoma, thyroid carcinoma, or neuroendocrine carcinoma, appear as hyperenhancing, usually with a typical rim enhancement of varying size (Figure 6). In contrast, hypovascular metastases lesions, e.g. from colorectal carcinoma (great variability) or bronchogenic carcinoma, may appear as hypoenhancing lesions in the arterial phase. Large metastases may have inhomogeneous enhancement because of necrosis, as shown in Figure 6. At the beginning of the portal phase, the enhancement fades and the entire lesion becomes increasingly hypoechoic. In the late phase, both hypovascular and hypervascular metastases invariably appear as dark defects, whereas the enhancement persists in the normal liver parenchyma (Figure 7). During this phase, the lesions are usually particularly well defined, often with sharp punched-out borders. Both portal venous and late-phase imaging markedly increase the contrast between the enhancing normal liver and the nonenhancing metastases and thus improve detection, particularly of small lesions, i.e. < 1 cm in diameter. The improved detection obtained by the use of ultrasound contrast agents allows for the implementation of CEUS for the follow-up of patients undergoing surgery and chemotherapy, to assess the efficacy of antineoplastic treatment[121-124]. To determine the utility of CEUS as a prognostic tool for metastatic renal cell carcinoma patients receiving sunitinib, Lassau and co-workers studied 38 patients receiving 50 mg/d sunitinib[125]. They found that time to peak intensity and slope of the wash-in curve were significantly associated with disease-free survival; time to peak intensity was also significantly associated with overall survival[125]. Furthermore, they concluded that CEUS is a useful tool for predicting early efficacy of sunitinib in metastatic renal cell carcinoma patients[125].

Figure 6
Figure 6 Contrast-enhanced ultrasound B-mode image of a colon cancer metastasis (same as in Figure 5) in the arterial phase showing marked hyperenhancement in the right panel. Note also the dark centre of the tumor, indicating a necrotic portion of the metastasis.
Figure 7
Figure 7 Contrast-enhanced ultrasound B-mode image of a colon cancer metastasis (same as in Figure 5) in the sinusoidal (late) phase, showing marked hypoenhancement in the right panel.
Hepatocellular carcinoma

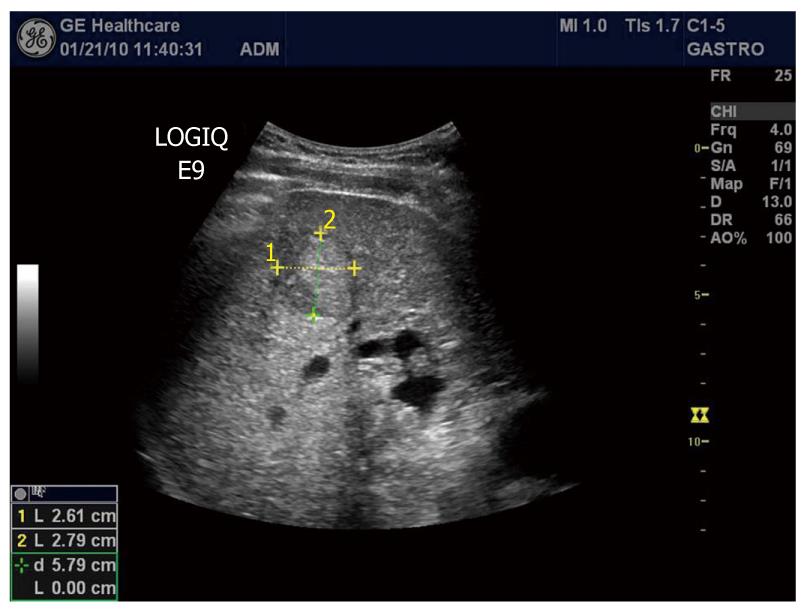
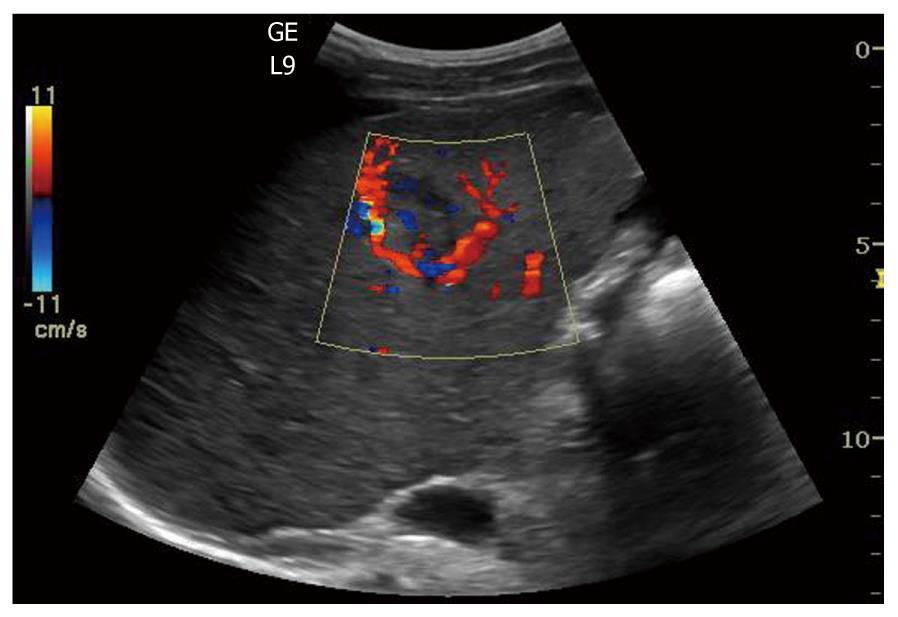
Hepatocellular carcinoma (HCC) is the second common malignant liver tumor and the most common primary liver cancer, usually occurring as a complication of chronic liver disease and most often arising in a cirrhotic liver. The accurate and early diagnosis of HCC is essential for treatment of the affected patients. Surgical resection, liver transplantation, percutaneous alcohol ablation and radiofrequency ablation are potentially curative therapies. On grey-scale sonography, HCCs may be hypoechoic (26%), hyperechoic (13%) or have mixed (61%) echogenicity depending on the size of the tumor, the fat content, the degree of differentiation and the scarring of necrosis[126]. HCCs with well-demarcated margins, perilesional halos or a hypoechoic pattern have a greater rate of detection by ultrasonography (Figure 8). Controversially, infiltrative or iso-hyperechoic HCCs without peripheral halos, as well as HCCs with internal septa or posterior echo enhancement, are harder to detect, with lower reported sensitivities. The use of Doppler in HCC can sometimes reveal a basket pattern around the tumor, depicting the anatomy of the arterial tumor supply (Figure 9).

Figure 8
Figure 8 B-mode image of hepatocellular carcinoma with well-demarcated margins and a perilesional halo.
Figure 9
Figure 9 Color Doppler in hepatocellular carcinoma reveals a basket pattern around the tumor, illustrating the anatomy of the arterial tumor supply.

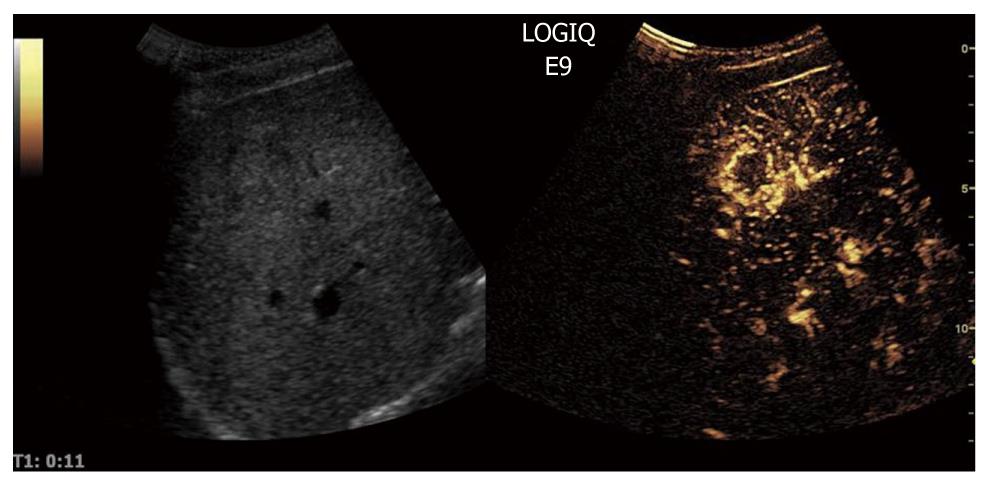
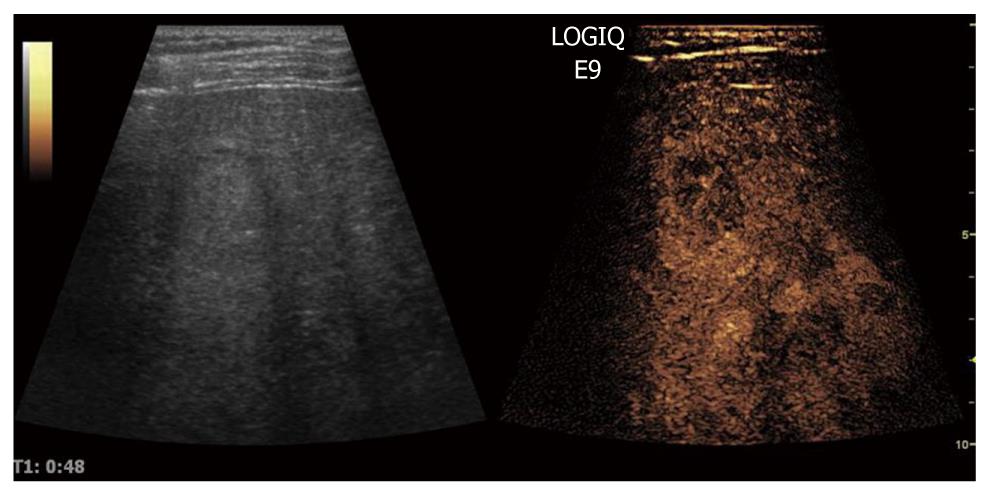
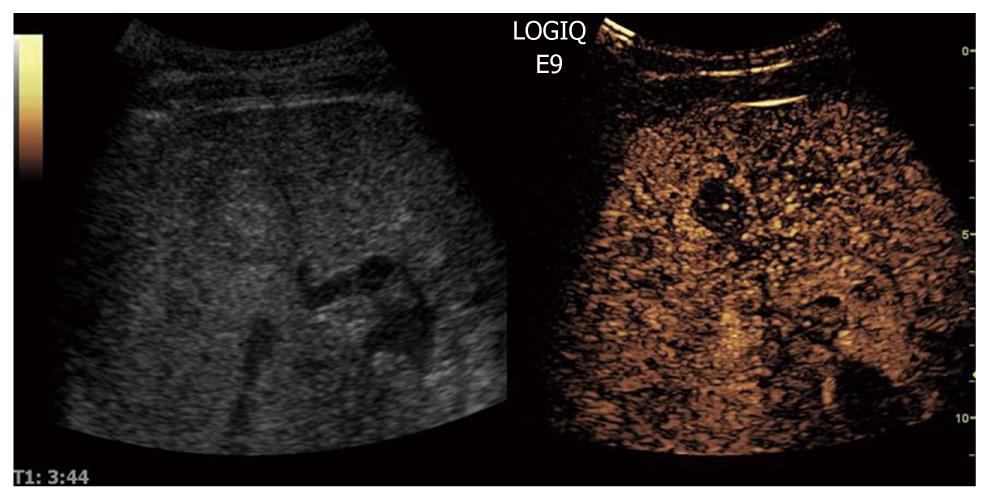
When CEUS is applied, HCCs are typically characterized by hypervascularity in the arterial phase. Using real-time evaluation with low MI, early and usually intense arterial enhancement is identified and in most cases a feeding artery is clearly visible. Tumor vessels, often appearing with a basket-like pattern, tend to enhance in a centripetal fashion extending from the periphery to the centre of the tumor (Figure 10). Arterial enhancement may be inhomogeneous, because the tumor contains septa, regions of different tissue differentiation and shunting among the neo-formed vessels, and sometimes necrosis[127]. Because of the high circulation velocity within HCC, there is relatively rapid nodular washout, often starting in the portal phase (Figure 11). Typically, HCC is hypovascular (hypoechoic) during the late phase of perfusion (Figure 12). At the same time, normal liver parenchyma increases the echogenicity and homogeneity because of portal venous enhancement.

Figure 10
Figure 10 Contrast-enhanced ultrasound allows for visualization of the arteriogram of hepatocellular carcinoma in the early arterial phase. The feeding vessel is visible on the tumor right side. Typically there is initial peripheral enhancement before the centripetal influx to the center of the tumor.
Figure 11
Figure 11 The portal phase of hepatocellular carcinoma. Because of high circulation velocity within hepatocellular carcinoma, there is relatively rapid washout, often starting in the portal phase.
Figure 12
Figure 12 The sinusoidal (late) phase of hepatocellular carcinoma is shown. Typically, hepatocellular carcinoma is hypovascular (hypoechoic) during the late phase of perfusion confirming the malignant nature of the tumor.

Surveillance of patients at risk of developing HCC is based on ultrasound examinations performed at either 6 or 12 mo intervals. Early detection of HCC in patients with cirrhosis is a clinical challenge, since the different entities that are involved in the multi-step process of hepatocarcinogenesis, such as low-grade and high-grade dysplastic nodule, share common ultrasonic features. However, CEUS allows for reliable detection of arterial angiogenesis associated with a malignant transformation. When whole lesion enhancement or mosaic enhancement in the arterial phase with an enhancement defect in the portal phase was regarded as a positive finding of HCC, a sensitivity of 92% and a specificity of 87% were found[128]. It has been shown that the ability of CEUS to diagnose HCC currently approaches that of optimized multi-detector CT or dynamic MR imaging protocols[129-136]. The use of CEUS to characterize nodular lesions in cirrhosis have been recommended by the clinical practice guidelines issued by the European Federation of Societies for Ultrasound in Medicine and Biology and the American Association for the Study of Liver Diseases[115].

Pancreas

The pancreas, lying deep to the stomach and duodenum, is among the most inaccessible organs in the body for visualization with ultrasonography. Hence, confirmation of pancreatic disease has remained a great challenge in clinical imaging. However, transabdominal ultrasonography has developed to be a useful tool in the differential diagnosis of pancreatic tumors because the technique is inexpensive, easy to perform, and widely available. Nevertheless, only after the introduction of second-generation contrast media[3], has transabdominal sonography yielded results comparable to those of other diagnostic modalities. CEUS can be used to improve detection of pancreatic lesions or to characterize pancreatic lesions already visible with ultrasonography. Furthermore, the staging of some pancreatic lesions can be improved by the use of contrast media. However, there is an important difference between a pancreatic CEUS study and the well-established liver CEUS study: the blood supply of the pancreas is entirely arterial and the enhancement of the gland begins almost together with the aortic enhancement. With CEUS the enhancement reaches its peak between 15 and 20 s after injection of the ultrasound contrast agent. Accordingly, pancreatic tissue enhancement is earlier and shorter than that of the liver because of the absence of a venous blood supply such as the portal vein in the liver. After a marked parenchymal enhancement in the early contrast-enhanced arterial phase, there is a progressive washout of contrast medium with gradual loss of echogenicity.

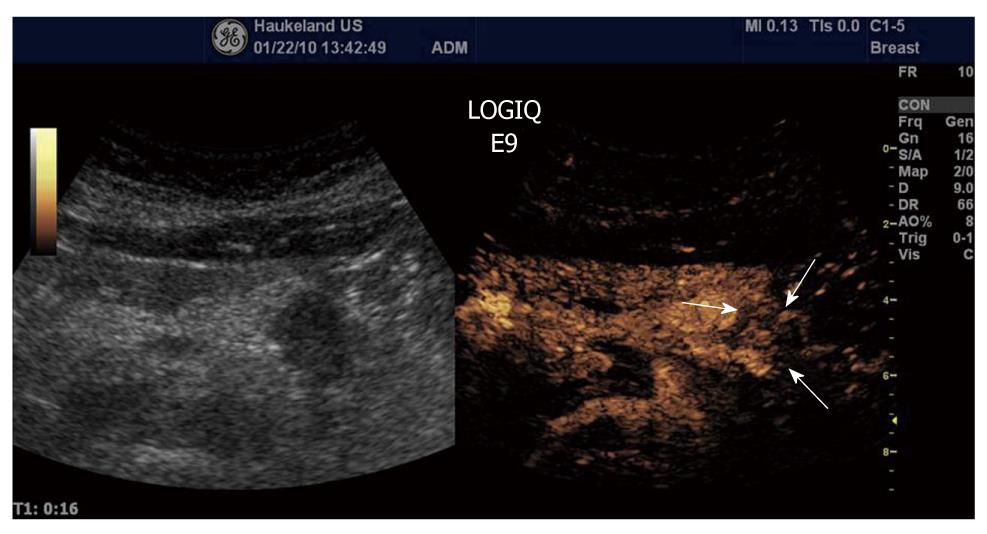
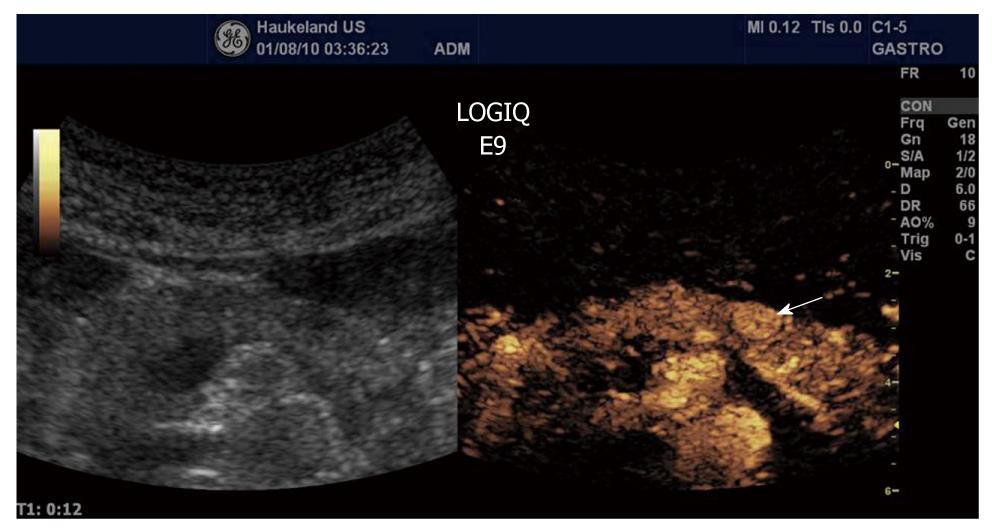
Ductal adenocarcinoma is the most frequent tumor of the pancreas, comprising between 80% and 90% of all tumors of the exocrine pancreas. Ultrasonographic findings typically are a hypoechoic lesion with ill-defined margins, often with spicules and tending to alter the gland contour[137-139]. Characteristically, ductal adenocarcinoma shows poor enhancement in all CEUS phases (Figure 13). On the contrary, neuroendocrine tumors (NETs) appear hypervascular in CEUS imaging. Imaging is important for the differentiation between NETs and ductal adenocarcinoma in selecting the correct therapeutic strategy and determining prognosis. With color- and power-Doppler ultrasonography a spotted pattern can sometimes be observed inside endocrine tumors[140]. However, Doppler signals are not always detected because of the small size of the lesion or of the tumor vascular network. Typically, NETs show a rapid intense enhancement in the early contrast-enhanced phases (Figure 14), with the exception of possible necrotic intralesional areas.

Figure 13
Figure 13 Ductal adenocarcinoma (between arrows) of the pancreas showing poor enhancement in the arterial phase. The same is true for the late venous phase.
Figure 14
Figure 14 Neuroendocrine tumour (arrow) shows a rapid intense enhancement in the early arterial phase of contrast-enhanced ultrasound examination.
Gastrointestinal tract

Colon cancer is one of the world’s most common malignancies. The main therapy is surgical resection. To diagnose colon cancer, endoscopy is the preferred method, but in many places around the world, X-ray is still used. Using ultrasonography, the normal gastrointestinal (GI) wall is visualized as a layered structure consisting of 5 to 9 layers, depending on transmitted frequency[141-143]. When digestive cancers develop, the wall layers become blurred, wall thickness is increased, and the ultrasound appearance of the GI wall resembles a kidney, i.e. pseudo-kidney sign or target lesion. However, CEUS does not yet have a place in the work-up of patients with suspected colonic cancer.

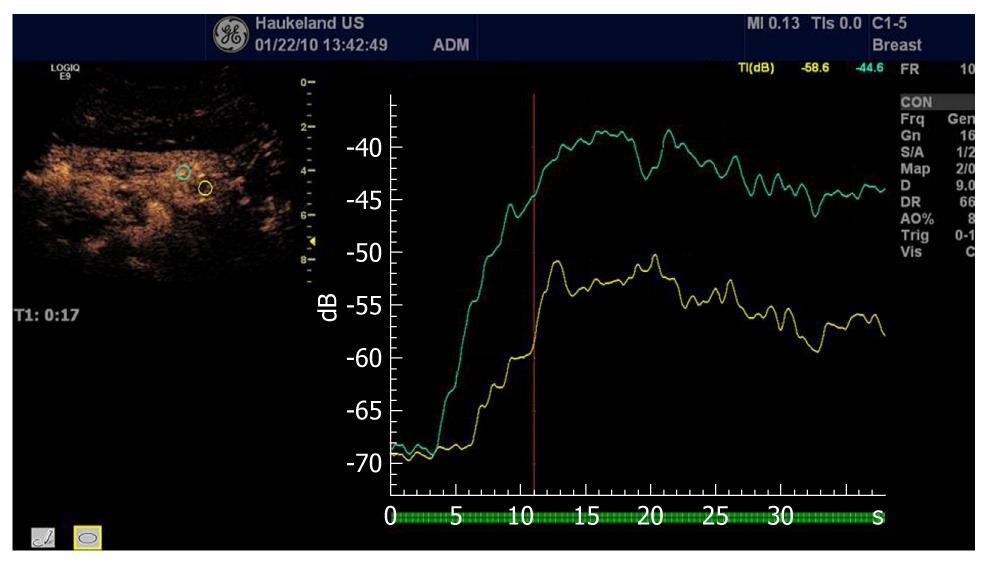
In oncology, early evaluation of targeted treatment response with functional imaging is of major importance. Dynamic CEUS is now recognized as a functional imaging technique able to evaluate new antiangiogenic drugs targeting cancers in the abdomen. This therapy evaluation is based on analysis of the curve of signal intensity over time after injection of ultrasound contrast agents (Figure 15).

Figure 15
Figure 15 Analysis of time intensity curves after injection of contrast agents depicting a pancreatic carcinoma (same as Figure 13). The green curve depicts the normal pancreatic perfusion whereas the red curve illustrates the hypoenhancing malignancy.

Novel quantification software allows for objective quantification of tumor perfusion parameters including maximum intensity of enhancement, mean transit time, time to peak, and wash-in slope coefficient. CEUS allows for early prediction of tumor response to treatment based on changes in vascularity, before morphological changes become apparent[144]. Lassau and co-workers evaluated CEUS with perfusion software as a predictor of early tumor response to imatinib (Glivec) in c-kit-positive gastrointestinal stromal tumors (GISTs)[145]. They studied 59 tumors with metastases or a recurrence from a GIST prospectively and found that initial contrast uptake at day 1 was predictive of the future response[145]. A strong correlation was found between the decline in tumor contrast uptake at days 7 and 14 and tumor response[145]. They concluded that CEUS is a non-invasive imaging technique that allows the early prediction of tumor response in c-kit-positive GISTs treated with Glivec[145].

Tumor growth is dependent on both endothelial and tumor cells. One question is whether changes in tumor vasculature are implicated in tumor tissue degeneration during antiangiogenic therapies. In a study using CEUS, it was shown that tumor cells abruptly became necrotic following antivascular therapy, whereas untreated tumors were protected from degeneration by a significant blood supply[146]. Because antiangiogenic therapies inhibit the growth of new tumor-associated blood vessels, as well as prune newly formed vasculature, they would be expected to reduce the supply of oxygen and thus increase tumor hypoxia. Franco and co-workers used DC101, an anti-vascular endothelial growth factor receptor 2 antibody to study tumor hypoxia[147]. Using ultrasonography, they observed consistent reductions in microvascular density, blood flow, and perfusion[147]. The increase in tumor hypoxia was evident within 5 d and remained so throughout the entire course of treatment[147]. These results suggest that sustained hypoxia and impairment of vascular function can be 2 consistent consequences of antiangiogenic drug treatment.

Concluding remarks

It is a challenging task to quantify and predict which bubble phenomenon occurs under which acoustic condition, and how these may be utilized in ultrasonic imaging. Aided by high-speed photography, our improved understanding of encapsulated microbubble behavior will lead to more sophisticated detection and delivery techniques.

More sophisticated methods use quantitative approaches to measure the amount and the time course of bolus or reperfusion curves and have shown great promise in revealing an effective tumor response to anti-angiogenic drugs in humans before tumor shrinkage occurs. These are beginning to be accepted into clinical practice. In the long term, targeted microbubbles for molecular imaging and eventually for directed anti-tumor therapy are expected to be developed.

In principle, in any perfused region that can be reached by ultrasound, ultrasound-directed drug delivery could be performed. However, since the ultrasonic fields used with diagnostic ultrasound scanners differ greatly per organ targeted, some regions will be far from ideal. The ultrasonic frequencies transmitted in endoscopy are much higher than the resonance frequencies of conventional ultrasound contrast agents. Therefore, for such applications, smaller carriers will have to be developed for ultrasound-directed drug delivery.

In conclusion, combining ultrasound contrast agents with therapeutic substances may lead to simple and economic methods of treatment with fewer side effects, using conventional ultrasound scanners. Ultrasound-directed drug delivery has great potential in the treatment of malignancies in the digestive system.

Footnotes

Peer reviewer: Dr. Mirella Fraquelli, Postgraduate School of Gastroenterology, IRCCS Ospedale Maggiore, Milano, 20122, Italy

S- Editor Sun H L- Editor Cant MR E- Editor Zheng XM

References
1.  Postema M. Bubbles and ultrasound. Appl Acoust. 2009;70:1305.  [PubMed]  [DOI]  [Cited in This Article: ]
2.  ter Haar G. Safety and bio-effects of ultrasound contrast agents. Med Biol Eng Comput. 2009;47:893-900.  [PubMed]  [DOI]  [Cited in This Article: ]
3.  Postema M, Schmitz G. Bubble dynamics involved in ultrasonic imaging. Expert Rev Mol Diagn. 2006;6:493-502.  [PubMed]  [DOI]  [Cited in This Article: ]
4.  Webb A Introduction to Biomedical Imaging. Hoboken: John Wiley and Sons 2003; .  [PubMed]  [DOI]  [Cited in This Article: ]
5.  Wells PNT. Ultrasonic imaging of the human body. Rep Prog Phys. 1999;62:671-722.  [PubMed]  [DOI]  [Cited in This Article: ]
6.  British Medical Ultrasound Society. Guidelines for the safe use of diagnostic ultrasound equipment. Ultrasound. 2010;18:52-59.  [PubMed]  [DOI]  [Cited in This Article: ]
7.  Postema M, Gilja OH. Ultrasound-directed drug delivery. Curr Pharm Biotechnol. 2007;8:355-361.  [PubMed]  [DOI]  [Cited in This Article: ]
8.  Voigt JU. Ultrasound molecular imaging. Methods. 2009;48:92-97.  [PubMed]  [DOI]  [Cited in This Article: ]
9.  Schmitz G. Ultrasound in medical diagnosis. Scattering: scattering and inverse scattering in pure and applied science. London: Academic Press 2002; 162-174.  [PubMed]  [DOI]  [Cited in This Article: ]
10.  Macdonald CA, Sboros V, Gomatam J, Pye SD, Moran CM, Norman McDicken W. A numerical investigation of the resonance of gas-filled microbubbles: resonance dependence on acoustic pressure amplitude. Ultrasonics. 2004;43:113-122.  [PubMed]  [DOI]  [Cited in This Article: ]
11.  Guan J, Matula TJ. Using light scattering to measure the response of individual ultrasound contrast microbubbles subjected to pulsed ultrasound in vitro. J Acoust Soc Am. 2004;116:2832-2842.  [PubMed]  [DOI]  [Cited in This Article: ]
12.  Postema M Fundamentals of medical ultrasonics. London: Spon Press 2011; .  [PubMed]  [DOI]  [Cited in This Article: ]
13.  Postema M, Bouakaz A, de Jong N. Noninvasive microbubble-based pressure measurements: a simulation study. Ultrasonics. 2004;42:759-762.  [PubMed]  [DOI]  [Cited in This Article: ]
14.  Schutt EG, Klein DH, Mattrey RM, Riess JG. Injectable microbubbles as contrast agents for diagnostic ultrasound imaging: the key role of perfluorochemicals. Angew Chem Int Ed Engl. 2003;42:3218-3235.  [PubMed]  [DOI]  [Cited in This Article: ]
15.  Wrenn SP, Mleczko M, Schmitz G. Phospholipid-stabilized microbubbles: Influence of shell chemistry on cavitation threshold and binding to giant uni-lamellar vesicles. Appl Acoust. 2009;70:1313-1322.  [PubMed]  [DOI]  [Cited in This Article: ]
16.  Sboros V. Response of contrast agents to ultrasound. Adv Drug Deliv Rev. 2008;60:1117-1136.  [PubMed]  [DOI]  [Cited in This Article: ]
17.  Tinkov S, Bekeredjian R, Winter G, Coester C. Microbubbles as ultrasound triggered drug carriers. J Pharm Sci. 2009;98:1935-1961.  [PubMed]  [DOI]  [Cited in This Article: ]
18.  Strasberg M. Gas bubbles as sources of sound in liquids. J Acoust Soc Am. 1956;28:20-26.  [PubMed]  [DOI]  [Cited in This Article: ]
19.  Plesset MS, Prosperetti A. Bubble dynamics and cavitation. Annu Rev Fluid Mech. 1977;9:145-185.  [PubMed]  [DOI]  [Cited in This Article: ]
20.  Attenborough K, Postema M.  A pocket-sized introduction to dynamics. Kingston upon Hull: The University of Hull 2008; .  [PubMed]  [DOI]  [Cited in This Article: ]
21.  Barlow E, Mulholland AJ, Gachagan A, Nordon A, MacPherson K. Analysis of the Rayleigh-Plesset equation with chirp excitation. IMA J Appl Math. 2009;74:20-34.  [PubMed]  [DOI]  [Cited in This Article: ]
22.  Church CC. The effects of an elastic solid surface layer on the radial pulsations of gas bubbles. J Acoust Soc Am. 1995;97:1510-1521.  [PubMed]  [DOI]  [Cited in This Article: ]
23.  Morgan KE, Allen JS, Dayton PA, Chomas JE, Klibaov AL, Ferrara KW. Experimental and theoretical evaluation of microbubble behavior: effect of transmitted phase and bubble size. IEEE Trans Ultrason Ferroelectr Freq Control. 2000;47:1494-1509.  [PubMed]  [DOI]  [Cited in This Article: ]
24.  Hoff L, Sontum PC, Hovem JM. Oscillations of polymeric microbubbles: effect of the encapsulating shell. J Acoust Soc Am. 2000;107:2272-2280.  [PubMed]  [DOI]  [Cited in This Article: ]
25.  Allen JS, May DJ, Ferrara KW. Dynamics of therapeutic ultrasound contrast agents. Ultrasound Med Biol. 2002;28:805-816.  [PubMed]  [DOI]  [Cited in This Article: ]
26.  Stride E, Saffari N. On the destruction of microbubble ultrasound contrast agents. Ultrasound Med Biol. 2003;29:563-573.  [PubMed]  [DOI]  [Cited in This Article: ]
27.  Postema M, Schmitz G. Ultrasonic bubbles in medicine: influence of the shell. Ultrason Sonochem. 2007;14:438-444.  [PubMed]  [DOI]  [Cited in This Article: ]
28.  Doinikov AA, Dayton PA. Spatio-temporal dynamics of an encapsulated gas bubble in an ultrasound field. J Acoust Soc Am. 2006;120:661-669.  [PubMed]  [DOI]  [Cited in This Article: ]
29.  Zheng H, Mukdadi O, Shandas R. Theoretical predictions of harmonic generation from submicron ultrasound contrast agents for nonlinear biomedical ultrasound imaging. Phys Med Biol. 2006;51:557-573.  [PubMed]  [DOI]  [Cited in This Article: ]
30.  Sarkar K, Shi WT, Chatterjee D, Forsberg F. Characterization of ultrasound contrast microbubbles using in vitro experiments and viscous and viscoelastic interface models for encapsulation. J Acoust Soc Am. 2005;118:539-550.  [PubMed]  [DOI]  [Cited in This Article: ]
31.  Stride E, Tang MX, Eckersley RJ. Physical phenomena affecting quantitative imaging of ultrasound contrast agents. Appl Acoust. 2009;70:1352-1362.  [PubMed]  [DOI]  [Cited in This Article: ]
32.  Mleczko M, Postema M, Schmitz G. Discussion of the application of finite Volterra series for the modeling of the oscillation behavior of ultrasound contrast agents. Appl Acoust. 2009;70:1363-1369.  [PubMed]  [DOI]  [Cited in This Article: ]
33.  Stride E, Saffari N. Theoretical and experimental investigation of the behaviour of ultrasound contrast agent particles in whole blood. Ultrasound Med Biol. 2004;30:1495-1509.  [PubMed]  [DOI]  [Cited in This Article: ]
34.  Qin S, Caskey CF, Ferrara KW. Ultrasound contrast microbubbles in imaging and therapy: physical principles and engineering. Phys Med Biol. 2009;54:R27-R57.  [PubMed]  [DOI]  [Cited in This Article: ]
35.  Dayton PA, Rychak JJ. Molecular ultrasound imaging using microbubble contrast agents. Front Biosci. 2007;12:5124-5142.  [PubMed]  [DOI]  [Cited in This Article: ]
36.  Philipp A, Lauterborn W. Cavitation erosion by single laser-produced bubbles. J Fluid Mech. 1998;361:75-116.  [PubMed]  [DOI]  [Cited in This Article: ]
37.  Postema M, Bouakaz A, de Jong N. March 2002. IEEE Trans Ultrason Ferroelectr Freq Control. 2002;49:c1-c2.  [PubMed]  [DOI]  [Cited in This Article: ]
38.  Postema M, van Wamel A, ten Cate FJ, de Jong N. High-speed photography during ultrasound illustrates potential therapeutic applications of microbubbles. Med Phys. 2005;32:3707-3711.  [PubMed]  [DOI]  [Cited in This Article: ]
39.  Prentice P, Cuschieri A, Dholakia K, Prausnitz M, Campbell P. Membrane disruption by optically controlled microbubble cavitation. Nat Phys. 2005;1:107-110.  [PubMed]  [DOI]  [Cited in This Article: ]
40.  Postema M, van Wamel A, Lancée CT, de Jong N. Ultrasound-induced encapsulated microbubble phenomena. Ultrasound Med Biol. 2004;30:827-840.  [PubMed]  [DOI]  [Cited in This Article: ]
41.  Kodama T, Takayama K. Dynamic behavior of bubbles during extracorporeal shock-wave lithotripsy. Ultrasound Med Biol. 1998;24:723-738.  [PubMed]  [DOI]  [Cited in This Article: ]
42.  Ohl CD, Ikink R. Shock-wave-induced jetting of micron-size bubbles. Phys Rev Lett. 2003;90:214502.  [PubMed]  [DOI]  [Cited in This Article: ]
43.  Ohl CD, Ory E. Aspherical bubble collapse - comparison with simulations. Nonlinear acoustics at the turn of the millennium. New York: American Institute of Physics 2000; 393-396.  [PubMed]  [DOI]  [Cited in This Article: ]
44.  Chomas JE, Dayton P, May D, Ferrara K. Threshold of fragmentation for ultrasonic contrast agents. J Biomed Opt. 2001;6:141-150.  [PubMed]  [DOI]  [Cited in This Article: ]
45.  Brennen CE. Fission of collapsing cavitation bubbles. J Fluid Mech. 2002;472:153-166.  [PubMed]  [DOI]  [Cited in This Article: ]
46.  Bloch SH, Wan M, Dayton PA, Ferrara KW. Optical observation of lipid- and polymer-shelled ultrasound microbubble contrast agents. Appl Phys Lett. 2004;84:631-633.  [PubMed]  [DOI]  [Cited in This Article: ]
47.  Postema M, Bouakaz A, Versluis M, de Jong N. Ultrasound-induced gas release from contrast agent microbubbles. IEEE Trans Ultrason Ferroelectr Freq Control. 2005;52:1035-1041.  [PubMed]  [DOI]  [Cited in This Article: ]
48.  Postema M, Bouakaz A, ten Cate FJ, Schmitz G, de Jong N, van Wamel A. Nitric oxide delivery by ultrasonic cracking: some limitations. Ultrasonics. 2006;44 Suppl 1:e109-e113.  [PubMed]  [DOI]  [Cited in This Article: ]
49.  Fagan MJ, Postema M.  Introduction to stress and strain analysis. Kingston upon Hull: The University of Hull 2007; .  [PubMed]  [DOI]  [Cited in This Article: ]
50.  Bevan PD, Karshafian R, Matsumura M, Tickner G, Burns PN. An acoustic study of disruption of polymer-shelled bubbles [microbubble contrast agents]. Proc IEEE Ultrason Symp. 2004;2:1391-1394.  [PubMed]  [DOI]  [Cited in This Article: ]
51.  Moran CM, Anderson T, Pye SD, Sboros V, McDicken WN. Quantification of microbubble destruction of three fluorocarbon-filled ultrasonic contrast agents. Ultrasound Med Biol. 2000;26:629-639.  [PubMed]  [DOI]  [Cited in This Article: ]
52.  Leighton TG The acoustic bubble. London: Academic Press Ltd 1994; .  [PubMed]  [DOI]  [Cited in This Article: ]
53.  Dayton PA, Allen JS, Ferrara KW. The magnitude of radiation force on ultrasound contrast agents. J Acoust Soc Am. 2002;112:2183-2192.  [PubMed]  [DOI]  [Cited in This Article: ]
54.  Dayton PA, Morgan KE, Klibanov AL, Brandenburger G, Nightingale KR, Ferrara KW. A preliminary evaluation of the effects of primary and secondary radiation forces on acoustic contrast agents. IEEE Trans Ultrason Ferroelectr Freq Control. 1997;44:1264-1277.  [PubMed]  [DOI]  [Cited in This Article: ]
55.  Tortoli P, Michelassi V, Corsi M, Righi D, Takeuchi Y. On the interaction between ultrasound and contrast agents during Doppler investigations. Ultrasound Med Biol. 2001;27:1265-1273.  [PubMed]  [DOI]  [Cited in This Article: ]
56.  Shortencarier MJ, Dayton PA, Bloch SH, Schumann PA, Matsunaga TO, Ferrara KW. A method for radiation-force localized drug delivery using gas-filled lipospheres. IEEE Trans Ultrason Ferroelectr Freq Control. 2004;51:822-831.  [PubMed]  [DOI]  [Cited in This Article: ]
57.  Zhao S, Borden M, Bloch SH, Kruse D, Ferrara KW, Dayton PA. Radiation-force assisted targeting facilitates ultrasonic molecular imaging. Mol Imaging. 2004;3:135-148.  [PubMed]  [DOI]  [Cited in This Article: ]
58.  Tortoli P, Boni E, Corsi M, Arditi M, Frinking P. Different effects of microbubble destruction and translation in Doppler measurements. IEEE Trans Ultrason Ferroelectr Freq Control. 2005;52:1183-1188.  [PubMed]  [DOI]  [Cited in This Article: ]
59.  Rychak JJ, Klibanov AL, Hossack JA. Acoustic radiation force enhances targeted delivery of ultrasound contrast microbubbles: in vitro verification. IEEE Trans Ultrason Ferroelectr Freq Control. 2005;52:421-433.  [PubMed]  [DOI]  [Cited in This Article: ]
60.  Lum AF, Borden MA, Dayton PA, Kruse DE, Simon SI, Ferrara KW. Ultrasound radiation force enables targeted deposition of model drug carriers loaded on microbubbles. J Control Release. 2006;111:128-134.  [PubMed]  [DOI]  [Cited in This Article: ]
61.  Kotopoulis S, Postema M. Microfoam formation in a capillary. Ultrasonics. 2010;50:260-268.  [PubMed]  [DOI]  [Cited in This Article: ]
62.  Mettin R, Doinikov AA. Translational instability of a spherical bubble in a standing ultrasound wave. Appl Acoust. 2009;70:1330-1339.  [PubMed]  [DOI]  [Cited in This Article: ]
63.  Kaul S. Myocardial contrast echocardiography: a 25-year retrospective. Circulation. 2008;118:291-308.  [PubMed]  [DOI]  [Cited in This Article: ]
64.  Bao S, Thrall BD, Miller DL. Transfection of a reporter plasmid into cultured cells by sonoporation in vitro. Ultrasound Med Biol. 1997;23:953-959.  [PubMed]  [DOI]  [Cited in This Article: ]
65.  Chen S, Shohet RV, Bekeredjian R, Frenkel P, Grayburn PA. Optimization of ultrasound parameters for cardiac gene delivery of adenoviral or plasmid deoxyribonucleic acid by ultrasound-targeted microbubble destruction. J Am Coll Cardiol. 2003;42:301-308.  [PubMed]  [DOI]  [Cited in This Article: ]
66.  Delius M, Hofschneider PH, Lauer U, Messmer K. Extracorporeal shock waves for gene therapy? Lancet. 1995;345:1377.  [PubMed]  [DOI]  [Cited in This Article: ]
67.  Frenkel PA, Chen S, Thai T, Shohet RV, Grayburn PA. DNA-loaded albumin microbubbles enhance ultrasound-mediated transfection in vitro. Ultrasound Med Biol. 2002;28:817-822.  [PubMed]  [DOI]  [Cited in This Article: ]
68.  Greenleaf WJ, Bolander ME, Sarkar G, Goldring MB, Greenleaf JF. Artificial cavitation nuclei significantly enhance acoustically induced cell transfection. Ultrasound Med Biol. 1998;24:587-595.  [PubMed]  [DOI]  [Cited in This Article: ]
69.  Kondo I, Ohmori K, Oshita A, Takeuchi H, Fuke S, ShiKondo I, Ohmori K, Oshita A, Takeuchi H, Fuke S. Treatment of acute myocardial infarction by hepatocyte growth factor gene transfer: the first demonstration of myocardial transfer of a "functional" gene using ultrasonic microbubble destruction. J Am Coll Cardiol. 2004;44:644-653.  [PubMed]  [DOI]  [Cited in This Article: ]
70.  Lawrie A, Brisken AF, Francis SE, Wyllie D, Kiss-Toth E, Qwarnstrom EE, Dower SK, Crossman DC, Newman CM. Ultrasound-enhanced transgene expression in vascular cells is not dependent upon cavitation-induced free radicals. Ultrasound Med Biol. 2003;29:1453-1461.  [PubMed]  [DOI]  [Cited in This Article: ]
71.  Lindner JR, Kaul S. Delivery of drugs with ultrasound. Echocardiography. 2001;18:329-337.  [PubMed]  [DOI]  [Cited in This Article: ]
72.  Manome Y, Nakayama N, Nakayama K, Furuhata H. Insonation facilitates plasmid DNA transfection into the central nervous system and microbubbles enhance the effect. Ultrasound Med Biol. 2005;31:693-702.  [PubMed]  [DOI]  [Cited in This Article: ]
73.  Miller DL, Bao S, Gies RA, Thrall BD. Ultrasonic enhancement of gene transfection in murine melanoma tumors. Ultrasound Med Biol. 1999;25:1425-1430.  [PubMed]  [DOI]  [Cited in This Article: ]
74.  Miller DL, Bao S, Morris JE. Sonoporation of cultured cells in the rotating tube exposure system. Ultrasound Med Biol. 1999;25:143-149.  [PubMed]  [DOI]  [Cited in This Article: ]
75.  Miller DL, Dou C. Membrane damage thresholds for pulsed or continuous ultrasound in phagocytic cells loaded with contrast agent gas bodies. Ultrasound Med Biol. 2004;30:405-411.  [PubMed]  [DOI]  [Cited in This Article: ]
76.  Miller DL, Dou C. Membrane damage thresholds for 1- to 10-MHz pulsed ultrasound exposure of phagocytic cells loaded with contrast agent gas bodies in vitro. Ultrasound Med Biol. 2004;30:973-977.  [PubMed]  [DOI]  [Cited in This Article: ]
77.  Mukherjee D, Wong J, Griffin B, Ellis SG, Porter T, Sen S, Thomas JD. Ten-fold augmentation of endothelial uptake of vascular endothelial growth factor with ultrasound after systemic administration. J Am Coll Cardiol. 2000;35:1678-1686.  [PubMed]  [DOI]  [Cited in This Article: ]
78.  Newman CM, Lawrie A, Brisken AF, Cumberland DC. Ultrasound gene therapy: on the road from concept to reality. Echocardiography. 2001;18:339-347.  [PubMed]  [DOI]  [Cited in This Article: ]
79.  Pislaru SV, Pislaru C, Kinnick RR, Singh R, Gulati R, Greenleaf JF, Simari RD. Optimization of ultrasound-mediated gene transfer: comparison of contrast agents and ultrasound modalities. Eur Heart J. 2003;24:1690-1698.  [PubMed]  [DOI]  [Cited in This Article: ]
80.  Porter TR, Xie F. Targeted drug delivery using intravenous microbubbles. Ultrasound Contrast Agents Basic principles and clinical applications. 2nd ed. London: Martin Dunitz Ltd 2001; 347-351.  [PubMed]  [DOI]  [Cited in This Article: ]
81.  Porter TR, Xie F. Therapeutic ultrasound for gene delivery. Echocardiography. 2001;18:349-353.  [PubMed]  [DOI]  [Cited in This Article: ]
82.  Song J, Chappell JC, Qi M, VanGieson EJ, Kaul S, Price RJ. Influence of injection site, microvascular pressure and ultrasound variables on microbubble-mediated delivery of microspheres to muscle. J Am Coll Cardiol. 2002;39:726-731.  [PubMed]  [DOI]  [Cited in This Article: ]
83.  Tachibana K, Tachibana S. The use of ultrasound for drug delivery. Echocardiography. 2001;18:323-328.  [PubMed]  [DOI]  [Cited in This Article: ]
84.  Tachibana K, Uchida T, Ogawa K, Yamashita N, Tamura K. Induction of cell-membrane porosity by ultrasound. Lancet. 1999;353:1409.  [PubMed]  [DOI]  [Cited in This Article: ]
85.  Unger EC, Hersh E, Vannan M, McCreery T. Gene delivery using ultrasound contrast agents. Echocardiography. 2001;18:355-361.  [PubMed]  [DOI]  [Cited in This Article: ]
86.  Unger EC, Matsunaga TO, McCreery T, Schumann P, Sweitzer R, Quigley R. Therapeutic applications of microbubbles. Eur J Radiol. 2002;42:160-168.  [PubMed]  [DOI]  [Cited in This Article: ]
87.  Taniyama Y, Tachibana K, Hiraoka K, Namba T, Yamasaki K, Hashiya N, Aoki M, Ogihara T, Yasufumi K, Morishita R. Local delivery of plasmid DNA into rat carotid artery using ultrasound. Circulation. 2002;105:1233-1239.  [PubMed]  [DOI]  [Cited in This Article: ]
88.  van Wamel A, Bouakaz A, Bernard B, ten Cate F, de Jong N. Radionuclide tumour therapy with ultrasound contrast microbubbles. Ultrasonics. 2004;42:903-906.  [PubMed]  [DOI]  [Cited in This Article: ]
89.  Mehier-Humbert S, Bettinger T, Yan F, Guy RH. Ultrasound-mediated gene delivery: kinetics of plasmid internalization and gene expression. J Control Release. 2005;104:203-211.  [PubMed]  [DOI]  [Cited in This Article: ]
90.  Kudo N, Okada K, Yamamoto K. Sonoporation by single-shot pulsed ultrasound with microbubbles adjacent to cells. Biophys J. 2009;96:4866-4876.  [PubMed]  [DOI]  [Cited in This Article: ]
91.  Okada K, Kudo N, Kondo T, Yamamoto K. Contributions of mechanical and sonochemical effects to cell membrane damage induced by single-shot pulsed ultrasound with adjacent microbubbles. J Med Ultrasonics. 2008;35:169-176.  [PubMed]  [DOI]  [Cited in This Article: ]
92.  Karshafian R, Bevan PD, Burns PN, Samac S, Banerjee M. Ultrasound-induced uptake of different size markers in mammalian cells. Proc IEEE Ultrason Symp. 2005;1:13-16.  [PubMed]  [DOI]  [Cited in This Article: ]
93.  Schlicher RK, Radhakrishna H, Tolentino TP, Apkarian RP, Zarnitsyn V, Prausnitz MR. Mechanism of intracellular delivery by acoustic cavitation. Ultrasound Med Biol. 2006;32:915-924.  [PubMed]  [DOI]  [Cited in This Article: ]
94.  Mehier-Humbert S, Bettinger T, Yan F, Guy RH. Plasma membrane poration induced by ultrasound exposure: implication for drug delivery. J Control Release. 2005;104:213-222.  [PubMed]  [DOI]  [Cited in This Article: ]
95.  Miller DL, Nyborg WL. Theoretical investigation of the response of gas-filled micropores and cavitation nuclei to ultrasound. J Acoust Soc Am. 1983;73:1537-1544.  [PubMed]  [DOI]  [Cited in This Article: ]
96.  Miller DL, Song J. Lithotripter shock waves with cavitation nucleation agents produce tumor growth reduction and gene transfer in vivo. Ultrasound Med Biol. 2002;28:1343-1348.  [PubMed]  [DOI]  [Cited in This Article: ]
97.  Lentacker I, De Smedt SC, Sanders NN. Drug loaded microbubble design for ultrasound triggered delivery. Soft Matter. 2009;5:2161-2170.  [PubMed]  [DOI]  [Cited in This Article: ]
98.  Klibanov AL. Targeted delivery of gas-filled microspheres, contrast agents for ultrasound imaging. Adv Drug Deliv Rev. 1999;37:139-157.  [PubMed]  [DOI]  [Cited in This Article: ]
99.  Christiansen JP, French BA, Klibanov AL, Kaul S, Lindner JR. Targeted tissue transfection with ultrasound destruction of plasmid-bearing cationic microbubbles. Ultrasound Med Biol. 2003;29:1759-1767.  [PubMed]  [DOI]  [Cited in This Article: ]
100.  Dayton P, Morgan K, Allietta M, Klibanov A, Brandenburger G, Ferrara K. Simultaneous optical and acoustical observations of contrast agents. Proc IEEE Ultrason Symp. 1997;2:1583-1591.  [PubMed]  [DOI]  [Cited in This Article: ]
101.  Takeuchi Y. July 1999. IEEE Trans Ultrason Ferroelectr Freq Control. 1999;46:c1-c2.  [PubMed]  [DOI]  [Cited in This Article: ]
102.  Postema M, ten Cate FJ, Schmitz G, de Jong N, van Wamel A. Generation of a droplet inside a microbubble with the aid of an ultrasound contrast agent: first result. Lett Drug Des Discov. 2007;4:74-77.  [PubMed]  [DOI]  [Cited in This Article: ]
103.  Dorbolo S, Caps H, Vandewalle N. Fluid instabilities in the birth and death of antibubbles. New J Phys. 2003;5:161.  [PubMed]  [DOI]  [Cited in This Article: ]
104.  Katz JI. Jets from collapsing bubbles. Proc R Soc Lond A. 1999;455:323-328.  [PubMed]  [DOI]  [Cited in This Article: ]
105.  Duchemin L, Popinet S, Josserand C, Zaleski S. Jet formation in bubbles bursting at a free surface. Phys Fluids. 2002;14:3000-3008.  [PubMed]  [DOI]  [Cited in This Article: ]
106.  Bekeredjian R, Grayburn PA, Shohet RV. Use of ultrasound contrast agents for gene or drug delivery in cardiovascular medicine. J Am Coll Cardiol. 2005;45:329-335.  [PubMed]  [DOI]  [Cited in This Article: ]
107.  Miller DL, Dou C, Song J. DNA transfer and cell killing in epidermoid cells by diagnostic ultrasound activation of contrast agent gas bodies in vitro. Ultrasound Med Biol. 2003;29:601-607.  [PubMed]  [DOI]  [Cited in This Article: ]
108.  van Wamel A, Bouakaz A, ten Cate F, de Jong N. Effects of diagnostic ultrasound parameters on molecular uptake and cell viability. Proc IEEE Ultrason Symp. 2002;2:1419-1422.  [PubMed]  [DOI]  [Cited in This Article: ]
109.  Hallow DM, Mahajan AD, McCutchen TE, Prausnitz MR. Measurement and correlation of acoustic cavitation with cellular bioeffects. Ultrasound Med Biol. 2006;32:1111-1122.  [PubMed]  [DOI]  [Cited in This Article: ]
110.  Feril LB Jr, Kondo T, Takaya K, Riesz P. Enhanced ultrasound-induced apoptosis and cell lysis by a hypotonic medium. Int J Radiat Biol. 2004;80:165-175.  [PubMed]  [DOI]  [Cited in This Article: ]
111.  Watanabe A, Kawai K, Sato T, Nishimura H, Kawashima N, Takeuchi S. Apoptosis induction in cancer cells by ultrasound exposure. Jpn J Appl Phys. 2004;43:3245-3248.  [PubMed]  [DOI]  [Cited in This Article: ]
112.  Abdollahi A, Domhan S, Jenne JW, Hallaj M, Dell'Aqua G, Mueckenthaler M, Richter A, Martin H, Debus J, Ansorge W. Apoptosis signals in lymphoblasts induced by focused ultrasound. FASEB J. 2004;18:1413-1414.  [PubMed]  [DOI]  [Cited in This Article: ]
113.  Miller MW, Miller DL, Brayman AA. A review of in vitro bioeffects of inertial ultrasonic cavitation from a mechanistic perspective. Ultrasound Med Biol. 1996;22:1131-1154.  [PubMed]  [DOI]  [Cited in This Article: ]
114.  Albrecht T, Blomley M, Bolondi L, Claudon M, Correas JM, Cosgrove D, Greiner L, Jäger K, Jong ND, Leen E. Guidelines for the use of contrast agents in ultrasound. January 2004. Ultraschall Med. 2004;25:249-256.  [PubMed]  [DOI]  [Cited in This Article: ]
115.  Claudon M, Cosgrove D, Albrecht T, Bolondi L, Bosio M, Calliada F, Correas JM, Darge K, Dietrich C, D'Onofrio M. Guidelines and good clinical practice recommendations for contrast enhanced ultrasound (CEUS) - update 2008. Ultraschall Med. 2008;29:28-44.  [PubMed]  [DOI]  [Cited in This Article: ]
116.  Bernatik T, Becker D, Neureiter D, Hänsler J, Frieser M, Schaber S, Hahn EG, Strobel D. [Detection of liver metastases--comparison of contrast--enhanced ultrasound using first versus second generation contrast agents]. Ultraschall Med. 2003;24:175-179.  [PubMed]  [DOI]  [Cited in This Article: ]
117.  Strobel D, Seitz K, Blank W, Schuler A, Dietrich C, von Herbay A, Friedrich-Rust M, Kunze G, Becker D, Will U. Contrast-enhanced ultrasound for the characterization of focal liver lesions--diagnostic accuracy in clinical practice (DEGUM multicenter trial). Ultraschall Med. 2008;29:499-505.  [PubMed]  [DOI]  [Cited in This Article: ]
118.  Albrecht T, Hohmann J, Oldenburg A, Skrok J, Wolf KJ. Detection and characterisation of liver metastases. Eur Radiol. 2004;14 Suppl 8:P25-P33.  [PubMed]  [DOI]  [Cited in This Article: ]
119.  Dietrich CF, Kratzer W, Strobe D, Danse E, Fessl R, Bunk A, Vossas U, Hauenstein K, Koch W, Blank W. Assessment of metastatic liver disease in patients with primary extrahepatic tumors by contrast-enhanced sonography versus CT and MRI. World J Gastroenterol. 2006;12:1699-1705.  [PubMed]  [DOI]  [Cited in This Article: ]
120.  Konopke R, Kersting S, Bergert H, Bloomenthal A, Gastmeier J, Saeger HD, Bunk A. Contrast-enhanced ultrasonography to detect liver metastases : a prospective trial to compare transcutaneous unenhanced and contrast-enhanced ultrasonography in patients undergoing laparotomy. Int J Colorectal Dis. 2007;22:201-207.  [PubMed]  [DOI]  [Cited in This Article: ]
121.  Torzilli G. Contrast-enhanced intraoperative ultrasonography in surgery for liver tumors. Eur J Radiol. 2004;51 Suppl:S25-S29.  [PubMed]  [DOI]  [Cited in This Article: ]
122.  Torzilli G, Botea F, Procopio F, Donadon M, Balzarini L, Lutman F, Calliada F, Montorsi M. Use of contrast-enhanced intraoperative ultrasonography during liver surgery for colorectal cancer liver metastases – Its impact on operative outcome. Analysis of a prospective cohort study. Eur J Cancer Suppl. 2008;6:16-23.  [PubMed]  [DOI]  [Cited in This Article: ]
123.  Lassau N, Lamuraglia M, Koscielny S, Spatz A, Roche A, Leclere J, Avril MF. Prognostic value of angiogenesis evaluated with high-frequency and colour Doppler sonography for preoperative assessment of primary cutaneous melanomas: correlation with recurrence after a 5 year follow-up period. Cancer Imaging. 2006;6:24-29.  [PubMed]  [DOI]  [Cited in This Article: ]
124.  Cosgrove D, Lassau N. [Assessment of tumour angiogenesis using contrast-enhanced ultrasound]. J Radiol. 2009;90:156-164.  [PubMed]  [DOI]  [Cited in This Article: ]
125.  Lassau N, Koscielny S, Albiges L, Chami L, Benatsou B, Chebil M, Roche A, Escudier BJ. Metastatic renal cell carcinoma treated with sunitinib: early evaluation of treatment response using dynamic contrast-enhanced ultrasonography. Clin Cancer Res. 2010;16:1216-1225.  [PubMed]  [DOI]  [Cited in This Article: ]
126.  Leen E. The role of contrast-enhanced ultrasound in the characterisation of focal liver lesions. Eur Radiol. 2001;11 Suppl 3:E27-E34.  [PubMed]  [DOI]  [Cited in This Article: ]
127.  Nicolau C, Catalá V, Vilana R, Gilabert R, Bianchi L, Solé M, Pagés M, Brú C. Evaluation of hepatocellular carcinoma using SonoVue, a second generation ultrasound contrast agent: correlation with cellular differentiation. Eur Radiol. 2004;14:1092-1099.  [PubMed]  [DOI]  [Cited in This Article: ]
128.  Ding H, Wang WP, Huang BJ, Wei RX, He NA, Qi Q, Li CL. Imaging of focal liver lesions: low-mechanical-index real-time ultrasonography with SonoVue. J Ultrasound Med. 2005;24:285-297.  [PubMed]  [DOI]  [Cited in This Article: ]
129.  Camaggi V, Piscaglia F, Bolondi L. Recent advances in the imaging of hepatocellular carcinoma. From ultrasound to positron emission tomography scan. Saudi Med J. 2007;28:1007-1014.  [PubMed]  [DOI]  [Cited in This Article: ]
130.  Dai Y, Chen MH, Fan ZH, Yan K, Yin SS, Zhang XP. Diagnosis of small hepatic nodules detected by surveillance ultrasound in patients with cirrhosis: Comparison between contrast-enhanced ultrasound and contrast-enhanced helical computed tomography. Hepatol Res. 2008;38:281-290.  [PubMed]  [DOI]  [Cited in This Article: ]
131.  Forner A, Vilana R, Ayuso C, Bianchi L, Solé M, Ayuso JR, Boix L, Sala M, Varela M, Llovet JM. Diagnosis of hepatic nodules 20 mm or smaller in cirrhosis: Prospective validation of the noninvasive diagnostic criteria for hepatocellular carcinoma. Hepatology. 2008;47:97-104.  [PubMed]  [DOI]  [Cited in This Article: ]
132.  Giorgio A, De Stefano G, Coppola C, Ferraioli G, Esposito V, Di Sarno A, Giorgio V, De Stefano M, Sangiovanni V, Liorre G. Contrast-enhanced sonography in the characterization of small hepatocellular carcinomas in cirrhotic patients: comparison with contrast-enhanced ultrafast magnetic resonance imaging. Anticancer Res. 2007;27:4263-4269.  [PubMed]  [DOI]  [Cited in This Article: ]
133.  Koda M, Matsunaga Y, Ueki M, Maeda Y, Mimura K, Okamoto K, Hosho K, Murawaki Y. Qualitative assessment of tumor vascularity in hepatocellular carcinoma by contrast-enhanced coded ultrasound: comparison with arterial phase of dynamic CT and conventional color/power Doppler ultrasound. Eur Radiol. 2004;14:1100-1108.  [PubMed]  [DOI]  [Cited in This Article: ]
134.  Lu MD, Yu XL, Li AH, Jiang TA, Chen MH, Zhao BZ, Zhou XD, Wang JR. Comparison of contrast enhanced ultrasound and contrast enhanced CT or MRI in monitoring percutaneous thermal ablation procedure in patients with hepatocellular carcinoma: a multi-center study in China. Ultrasound Med Biol. 2007;33:1736-1749.  [PubMed]  [DOI]  [Cited in This Article: ]
135.  Suzuki S, Iijima H, Moriyasu F, Sasaki S, Yanagisawa K, Miyahara T, Oguma K, Yoshida M, Horibe T, Ito N. Differential diagnosis of hepatic nodules using delayed parenchymal phase imaging of levovist contrast ultrasound: comparative study with SPIO-MRI. Hepatol Res. 2004;29:122-126.  [PubMed]  [DOI]  [Cited in This Article: ]
136.  Vallone P, Gallipoli A, Izzo F, Fiore F, Delrio P. Local ablation procedures in primary liver tumors: Levovist US versus spiral CTto evaluate therapeutic results. Anticancer Res. 2003;23:5075-5079.  [PubMed]  [DOI]  [Cited in This Article: ]
137.  D'Onofrio M, Zamboni G, Faccioli N, Capelli P, Pozzi Mucelli R. Ultrasonography of the pancreas. 4. Contrast-enhanced imaging. Abdom Imaging. 2007;32:171-181.  [PubMed]  [DOI]  [Cited in This Article: ]
138.  Faccioli N, Crippa S, Bassi C, D'Onofrio M. Contrast-enhanced ultrasonography of the pancreas. Pancreatology. 2009;9:560-566.  [PubMed]  [DOI]  [Cited in This Article: ]
139.  Recaldini C, Carrafiello G, Bertolotti E, Angeretti MG, Fugazzola C. Contrast-enhanced ultrasonograpic findings in pancreatic tumors. Int J Med Sci. 2008;5:203-208.  [PubMed]  [DOI]  [Cited in This Article: ]
140.  D'Onofrio M, Mansueto G, Falconi M, Procacci C. Neuroendocrine pancreatic tumor: value of contrast enhanced ultrasonography. Abdom Imaging. 2004;29:246-258.  [PubMed]  [DOI]  [Cited in This Article: ]
141.  Gilja OH, Heimdal A, Hausken T, Gregersen H, Matre K, Berstad A, Ødegaard S. Strain during gastric contractions can be measured using Doppler ultrasonography. Ultrasound Med Biol. 2002;28:1457-1465.  [PubMed]  [DOI]  [Cited in This Article: ]
142.  Ødegaard S, Nesje LB, Hoff DA, Gilja OH, Gregersen H. Morphology and motor function of the gastrointestinal tract examined with endosonography. World J Gastroenterol. 2006;12:2858-2863.  [PubMed]  [DOI]  [Cited in This Article: ]
143.  Ødegaard S, Nesje LB, Gilja OH.  Atlas of endoscopic ultrasonography. Bergen: Fagbokforlaget 2007; .  [PubMed]  [DOI]  [Cited in This Article: ]
144.  Lassau N, Brule A, Chami L, Benatsou B, Péronneau P, Roche A. [Evaluation of early response to antiangiogenic treatment with dynamic contrast enhanced ultrasound]. J Radiol. 2008;89:549-555.  [PubMed]  [DOI]  [Cited in This Article: ]
145.  Lassau N, Lamuraglia M, Chami L, Leclère J, Bonvalot S, Terrier P, Roche A, Le Cesne A. Gastrointestinal stromal tumors treated with imatinib: monitoring response with contrast-enhanced sonography. AJR Am J Roentgenol. 2006;187:1267-1273.  [PubMed]  [DOI]  [Cited in This Article: ]
146.  Magnon C, Galaup A, Rouffiac V, Opolon P, Connault E, Rosé M, Perricaudet M, Roche A, Germain S, Griscelli F. Dynamic assessment of antiangiogenic therapy by monitoring both tumoral vascularization and tissue degeneration. Gene Ther. 2007;14:108-117.  [PubMed]  [DOI]  [Cited in This Article: ]
147.  Franco M, Man S, Chen L, Emmenegger U, Shaked Y, Cheung AM, Brown AS, Hicklin DJ, Foster FS, Kerbel RS. Targeted anti-vascular endothelial growth factor receptor-2 therapy leads to short-term and long-term impairment of vascular function and increase in tumor hypoxia. Cancer Res. 2006;66:3639-3648.  [PubMed]  [DOI]  [Cited in This Article: ]
148.  Krishna PD, Shankar PM, Newhouse VL. Subharmonic generation from ultrasonic contrast agents. Phys Med Biol. 1999;44:681-694.  [PubMed]  [DOI]  [Cited in This Article: ]
149.  Guidi F, Vos HJ, Nicchi F, Boni E, Tortoli P. Acoustical Imaging of Individual Microbubbles. Acoustical imaging. Berlin: Springer 2007; 257-265.  [PubMed]  [DOI]  [Cited in This Article: ]
150.  Postema M, Mleczko M, Schmitz G. Mutual attraction of oscillation microbubbles. Advances in medical engineering. Berlin: Springer 2007; 75-80.  [PubMed]  [DOI]  [Cited in This Article: ]
151.  Postema M, Marmottant P, Lancée CT, Versluis M, Hilgenfeldt S, de Jong N. Ultrasound-induced coalescence of free gas microbubbles. Proc IEEE Ultrason Symp. 2004;1:1-4.  [PubMed]  [DOI]  [Cited in This Article: ]
152.  Bevan PD, Karshafian R, Burns PN. The influence of fragmentation on the acoustic response from shrinking bubbles. Ultrasound Med Biol. 2008;34:1152-1162.  [PubMed]  [DOI]  [Cited in This Article: ]
153.  Chomas JE, Dayton PA, May D, Allen J, Klibanov A, Ferrara K. Optical observation of contrast agent destruction. Appl Phys Lett. 2000;77:1056-1058.  [PubMed]  [DOI]  [Cited in This Article: ]
154.  Borden MA, Kruse DE, Caskey CF, Zhao S, Dayton PA, Ferrara KW. Influence of lipid shell physicochemical properties on ultrasound-induced microbubble destruction. IEEE Trans Ultrason Ferroelectr Freq Control. 2005;52:1992-2002.  [PubMed]  [DOI]  [Cited in This Article: ]
155.  Postema M, de Jong N, Schmitz G. Shell rupture threshold, fragmentation threshold, blake threshold. Proc IEEE Ultrason Symp. 2005;3:1708-1711.  [PubMed]  [DOI]  [Cited in This Article: ]
156.  Postema M, Marmottant P, Lancée CT, Hilgenfeldt S, de Jong N. Ultrasound-induced microbubble coalescence. Ultrasound Med Biol. 2004;30:1337-1344.  [PubMed]  [DOI]  [Cited in This Article: ]
157.  Postema M, de Jong N, Schmitz G. Nonlinear behavior of ultrasound-insonified encapsulated microbubbles. Innovations in nonlinear acoustics. Melville: American Institute of Physics 2006; 275-278.  [PubMed]  [DOI]  [Cited in This Article: ]
158.  Takeuchi Y. Industrial use thermoplastic microballoon to mimic the contrast agents and its in-vitro behavior including released gas dynamics. Proc Proc IEEE Ultrason Symp. 1997;2:1579-1582.  [PubMed]  [DOI]  [Cited in This Article: ]
159.  Bevan PD, Karshafian R, Tickner EG, Burns PN. Quantitative measurement of ultrasound disruption of polymer-shelled microbubbles. Ultrasound Med Biol. 2007;33:1777-1786.  [PubMed]  [DOI]  [Cited in This Article: ]