INTRODUCTION
The human biliary system consists of the gallbladder, the cystic duct, common bile duct and the sphincter of Oddi. The gallbladder is a thin-walled, pear-shaped sac and generally measures 7-10 cm in length and about 3 cm in width. This muscular sac is located in a fossa in the posterior of the right lobe of the liver. The average storage capacity of a gallbladder is about 20-30 mL. Bile, the liquid that flows in the biliary system, is composed of three major components: cholesterol, bile salts, and bilirubin. When the gallbladder is not functioning properly, the components of the bile are supersaturated leading to the formation of solid crystals, called gallstones.
Archaeologists have found human gallstones originating from the 17th century B C in Mycenae, Greece which suggests that mankind has been suffering from this disease for at least 4000 years[1]. Cholecystectomy is the most commonly performed abdominal operation in the West, with some 60 000 operations performed in England and Wales every year[2] at a cost to the National Health Service (NHS) of approximately £60 million[3]. However, not all the operations provided an effective cure; in 50% of acalculous diseases, patients complained about the recurrence of the symptoms[4]. Therefore, understanding the mechanisms of gallstone diseases is essential for better diagnosis and treatments of these diseases.
The earliest attempts to understand gallstone formation focused on phenomena occurring within the gallbladder. Cholesterol gallstone formation depends upon two conditions: (1) cholesterol crystal nucleation; (2) cholesterol crystal growth. The necessary physical-chemical factor for crystal nucleation or growth is cholesterol super-saturation in bile[5-8]. Bile stasis may cause cholesterol super-saturation and allow the formation of cholesterol stones[9]. Additional studies have shown that hyper-secretion of gallbladder mucus is also an important factor in gallstone formation by accelerating cholesterol nucleation[10-12]. It has also been found that increased glycoproteins in bile precede cholesterol saturation and crystallization[13].
The gallbladder is able to react to the stimulus of eating by contracting and discharging bile into the duodenum. Currently the gallbladder is regarded as a ‘slow pump’, where emptying or refilling is concerned; its volume change is related to the pressure inside the gallbladder and its compliance[14-16]. This relationship is often assumed to be linear[14], but more recently it has been described as a ‘bellows’ plus pump, in which emptying and refilling alternates[9,17]. Cholecystokinin (CCK), a chemical stimulus, not only causes the gallbladder to contract but also allows the cystic duct[18] and sometimes the common bile duct[19] to contract. Thus, an injection of CCK is often used to study gallbladder motor function in vivo.
Poor gallbladder motor function can lead to abnormal gallbladder emptying and is believed to contribute to bile stasis and hence gallstone formation. Many studies have shown that gallbladder emptying is abnormal in patients with gallstones[20-31]. In addition, it has been observed that cystic duct flow resistance is increased before gallstone formation[32,33].
All these studies suggest that the mechanics of the bile duct and flow within it play an important role in bile stasis and gallstone formation. From a mechanical point of view, the biliary system can be considered to be a pump-pipe system, where the gallbladder provides the driving pressure, and the flow rate of the bile going through the ducts depends on the resistance as well as the pressure drop between the gallbladder and the downstream end of the common bile duct. In this sense, gallbladder motor function is closely related to the pressure drop, flow rate and the flow resistance in the biliary system. For a given pressure drop, if the flow resistance of the system is higher, then a smaller volume of bile will be driven out of the gallbladder during emptying. Thus the principal areas of interest are mechanical details, such as flow rate, pressure drop and resistance of the biliary system which are related to the geometry of the gallbladder and the ducts. Bile flow in the biliary system is governed not only by the fluid dynamics but also by the solid mechanics, since it is the interaction between the bile flow and soft tissue deformation which determines the characteristics of the system. In addition, it is important to identify which geometric parameters, material properties, or external stimuli have the most significant influence on the system behaviour. It is the purpose of this paper to review the current studies of the mechanical aspects of the biliary system, and their relationship with gallbladder diseases, in particular, gallstones.
THE ROLE OF BILE FLUID DYNAMICS
Bile rheology
Bile rheology, the study of bile viscosity, is of interest in any consideration of the mechanics of bile flow, since it contributes directly to the flow resistance in the biliary tract. Experimental measurements showed that the density of gallbladder bile is very close to that of water, i.e. 1000 kg/m3, at room temperature[34]. However, the viscosity of bile is very different to that of water (which is constant at approximately 1 mPa.s) and it can change significantly in pathological situations.
Bouchier et al[35] reported that the dynamic viscosity of gallbladder bile is higher than that of hepatic bile and that viscosity is increased in pathological states[36]. Doty[37] suggested that this was due to the presence of mucus in gallbladders with stones. Jungst et al[38] also showed that the viscosity of bile was markedly higher in patients with cholesterol (5.0 mPa.s) and mixed stones (3.5 mPa.s) compared to that of hepatic bile (0.92 mPa.s). He also found a positive correlation between mucin and viscosity in gallbladder bile but not in hepatic bile.
Tera[39] found experimentally that normal gallbladder bile formed layers when left to stand. The dynamic viscosity of the top thinnest layer is 2.0 mPa.s, but that of the thickest layer is 2.2 mPa.s after allowing 2 h for sedimentation to take place[39]. Gottschalk and Lochner[40] measured postoperative bile viscosity, sampled by T-tube drainage of 29 patients with a modified horizontal capillary viscometer, from the day of operation to the 9th post-operative day and confirmed that the viscosity changes with time and the bile behaves like a visco-elastic Maxwell fluid (viscous-elastic fluid). Non-Newtonian shear-thinning behaviour was also observed using a Contraves Low Shear viscometer: the bile dynamic viscosity decreased from 5 mPa.s at a shear rate of 0.1 s-1 to 1.5 mPa.s at 2.0 s-1[40]. Coene et al[41] reported that the bile viscosity of patients with gallstones varied as a function of shear rate, and that the bile dynamic viscosity decreased from 2.5 mPa.s at a shear rate of 0.1s-1 to 1.5 mPa.s at 100s-1. These observations seem to indicate that the bile in gallbladder with gallstones has shear-thinning non-Newtonian behaviour at low shear rate. Ooi[34] measured the dynamic viscosity in fresh bile samples from 59 patients undergoing cholecystectomy and found the dynamic viscosity of gallbladder bile to be between 1.77-8.0 mPa.s for shear rates between 0.5 s-1-75 s-1[34]. He discovered that the bile in 20 subjects behaved like a Newtonian fluid, while in 22 subjects it showed shear-thinning at a low shear rate and then shear-thickening at a higher shear rate. In 8 subjects there was shear-thickening, but in 4 other subjects with mucus shear-thinning was observed. In general, the Newtonian bile seemed to be associated with normal subjects. Increased viscosity of gallbladder bile has been considered an important factor in the pathogenesis of gallstone disease[38].
It is clear that the bile viscosity can be subject-dependent even in normal physiological cases. In pathological cases, it can also vary between Newtonian, weakly non-Newtonian and strongly non-Newtonian behaviours. However, for healthy subjects, it may be reasonable to assume that bile is a Newtonian fluid. Indeed, this assumption has been widely used in modelling of cystic ducts[34,42-44].
Geometry of biliary duct and flow resistance
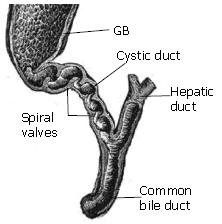
During gallbladder refilling and emptying in response to hormonal and neural stimuli[45], the bile flow passes through the cystic duct which connects the gallbladder and common bile duct, see Figure 1. Observations on the cystic duct anatomy have shown that the duct typically presents a combination of two types of structure: (1) in which the duct lumen wall may present the valve of Heister[46,47]; (2) the duct has a smooth lumen which describes various geometries such as spiral, winding, kinks or spiral incorporating an M-shape loop etc[34,48]. Different cystic duct structures can significantly affect the pressure drop required to drive the same flow of bile through the system. Structure type (1), for example, offers much more flow resistance compared to type (2).
Figure 1 The geometry of the biliary tract, where the valves of Heister in the cystic duct are shown.
The relation between the cystic duct geometry and cholelithiasis has been investigated in vivo. Based on 250 patients with cholelithiasis and 250 healthy controls, Deenitchin et al[49] discovered that patients with gallstones have significantly longer and more narrow cystic ducts (of mean length 48 mm and diameter 4 mm) than those without stones (of mean length 28 mm and diameter 7 mm). The results suggest that flow resistance is affected by the cystic duct geometry, and may be associated with cholelithiasis.
Rodkiewicz et al[42], on examining the pressure drop across the biliary system of a dog, found that flow rate of bile, , in the biliary system tree (including the sphincter of Oddi) was related to the pressure drop, , by a power law, i.e. , not the Poiseuille law commonly used for flow in a rigid straight tube which is . The power index n was in the range of 1.47-2.05. On the other hand, they found that the Poiseuille law was approximately valid when the bile flowed along a long, circular, smooth and rigid tube[42], which suggested that dog’s bile is more or less a Newtonian fluid.
The key to a more accurate estimation of detailed flow resistance is the reconstruction of the biliary tract for each patient. 2D real-time ultrasonography and HIDA scintigraphy techniques have long been applied in gallbladder volume measurement and diagnosis of cholecystitis[50-52]. However, these can only give limited information on the 3D biliary tract. A 3D real-time ultrasonography technique is now being developed and has been applied to the measurement of gallbladder shape and volume[53]. The 3D spiral/helical computed tomography (CT) has also been involved in diagnosis of cholecystitis, since it not only shows the 3D images of the gallbladder but also of the whole biliary tract[54-60]. These techniques may in the future facilitate the development of specific models for measuring flow resistance.
Sphincter of Oddi
The sphincter of Oddi is located at the termination of the common bile duct and pancreatic duct. The human sphincter of Oddi segment is 6-15 mm in length and has a muscular structure. The physiological functions of sphincter of Oddi include: (1) regulating bile flow into the duodenum; (2) diverting hepatic bile into the gallbladder and (3) preventing reflux of duodenal contents from the duodenum into the biliary tree[61,62]. When CCK is released, it causes the gallbladder to contract and the sphincter of Oddi to relax allowing bile to empty. Coordination of gallbladder and sphincter of Oddi function may also be influenced by nerve bundles which connect the gallbladder and the sphincter of Oddi via the cystic duct[63,64]. The effect of enteric hormones on sphincter of Oddi motor function was determined by recording intraluminal pressure[65]. It was found that the human sphincter of Oddi demonstrated unique phasic contractions, which would have an important role in regulating biliary and pancreatic duct emptying[65]. Several studies on the opossum sphincter of Oddi showed that it regulates bile like a peristaltic pump at low common bile duct pressure and as a resistor at higher common bile duct pressures[66-68]. Funch-Jensen et al[69] observed that the CCK injection inhibited the activity of the sphincter of Oddi of dogs, thus as bile flow increased, the gallbladder pressure remained unchanged. Funch-Jensen[62] further argued that the peristaltic pump activity of the human sphincter of Oddi was probably less important since CCK inhibited the phasic wave of the sphincter.
The basal pressure of human sphincter of Oddi is affected by gallstone disease. Cicala et al[70] investigated motor activity of the sphincter in 155 patients, and found that gallstones are frequently associated with increased basal pressure, which might obstruct bile flow causing gallbladder stasis. The early work on pressure drop and flow resistance across dog biliary duct illustrated that the resistance of sphincter of Oddi is at least about 3 times higher than that of the cystic duct[71]. These results suggest the mechanical role for the sphincter of Oddi in the system can be significant. In fact, this may contribute to the reasons that the computational prediction of pressure drop in the cystic duct resistance is much lower than the clinically observed opening pressure during emptying[34].
THE ROLE OF SOLID MECHANICS
Mechanical properties of gallbladder muscles
The gallbladder contracts under the control of nervous and hormonal stimuli during the emptying process[64]. Contraction of the muscle fibre mesh generates a vector of force directed toward the centre of the gallbladder lumen. To model the muscle changes due to the contraction, a relationship which describes the muscle responses of a system to external forces is required. This important relationship is known as the constitutive relation, which allows us to predict the stress distribution within the muscle. Most of the current mechanical studies on gallbladder muscles have concentrated on the constitutive relations either in the form of the gallbladder volume-pressure relationship, or the length-tension relationship of a muscle strip.
The pressure-volume relation
The relationship between the volume change and the differential pressure in the gallbladder can be expressed as (1), where is the compliance of the gallbladder, which can be determined from in vitro or in vivo experiments.
The pressure-volume response of opossum was studied by Ryan and Cohen[14] under basal conditions and after a continuous intravenous infusion of gastrinI, secretin, and CCK. It was found that without stimulation, the gallbladder was capable of accommodating a volume increase with only slight changes in pressure whereas CCK significantly increased the pressure in the gallbladder. They found that the gallbladder compliance was about 0.77 mL/mmHg under basal conditions, but decreased to 0.38, and 0.34 mL/mmHg as CCK stimulation increased from 0.025 to 2.5 μg/kg.h. Schoetz et al[15] measured the dynamic pressure-volume relation of adult female baboons. Their results showed a hysteresis loop in the pressure-volume relation which was exacerbated by CCK stimulation. This suggests that the gallbladder muscle may behave as a visco-elastic material. However, the mean values they measured, with and without stimuli, were very close to that of Ryan and Cohen[14]. Middelfart et al[16] measured the pressure-volume relationship of the gallbladders in 11 patients with gallstones, in which the gallbladders were injected with saline via a McGaham catheter. It was found that the compliance varied from 0.17 to 4.0 mL/mmHg, and was highly subject dependent, with a mean value of about 2.66 mL/mmHg.
The length-tension relation
Since the gallbladder consists of a layer of smooth muscle, it is subject to both active and passive tensions during emptying. The active tension is generated by hormonal stimuli, and the passive tension is caused by stretch of the muscle. The constitutive equation between the active force and length variation in the gallbladder has been studied in strips of gallbladder using uni-axial experiments. Although the response of the smooth muscle to the hormone should vary with time, currently all studies assumed that the length-tension relation in gallbladder is time-independent.
Mack and Todd[72] studied 50 strips from 25 human gallbladders obtained at operation. They found that the human gallbladder muscle was capable of maintained tone in vitro and that peak tension could be achieved within 3-5 min following hormonal stimulation. Unfortunately, they did not measure the quantitative relation between length and tension, therefore no constitutive equation for these studies could be established.
Washabau et al[73] used gallbladder muscle strips from mature female guinea pigs to measure the isometric stress stimulated with either 10-8 to 10-4M acetyl choline or 10-80 mmol/L KCl stimulations. The passive tension increased with the length ratio L/L0 (where L is the deformed length, and L0 is the initial length). The active tension was found to achieve its maximal value at L0, and declined afterward, although the total tension (active + passive) rose with L/L0. Bird et al[74] measured the tension of muscle strips from human gallbladder removed at cholecystectomy. They found no differences for samples taken from the longitudinal, circular and oblique planes. However, the samples taken from the gallbladder body region contracted more forcefully than those from the gallbladder neck region. Strips from the body region were also more sensitive to muscarinic stimulation. They did not measure the length-tension relation. Ahmed et al[75] compared the response of strips from patients with acalculous biliary pain to those of normal gallbladders following CCK-8 and carbachol stimulation. They found no difference in the CCK responses in these two groups; but again, the group also did not measure the length-tension relation.
The mechanical properties of bile duct
There are no experimental data available for mechanical properties of human biliary ducts at the present time. Most of the measurements on biliary ducts were conducted on animals. Jian and Wang[76] measured 16 bile duct systems in healthy adult dogs and found that in normal physiological condition the bile duct experiences an almost uniform circumferential and longitudinal stress. However, in diseased cases the stresses are non-uniform, and much larger at the inside wall than at the outside wall. They also found that the elastic modulus (a material property which represents the ratio of stress to strain in an elastic body) decreases from the common bile duct to the common hepatic duct and is lowest in the hepatic duct. The elastic modulus of the cystic duct is comparable to that of the hepatic duct. Duch et al[77] examined 11 pig hepatic and the common bile ducts. They found that the cross-sectional areas in the common bile duct are significantly higher than those of the hepatic duct under a pressure range of 0-8 kPa. In a second study, the structural and mechanical changes were quantified in the common bile duct at different time intervals following experimental acute obstruction[78]. In this study, the duct was ligated near the duodenum in pigs, and studied after 3 h, 12 h, 2 d, 8 d and 32 d. It was found that the circumferential stress-strain relation changed with time.
NUMERICAL AND MATHEMATICAL MODELLING
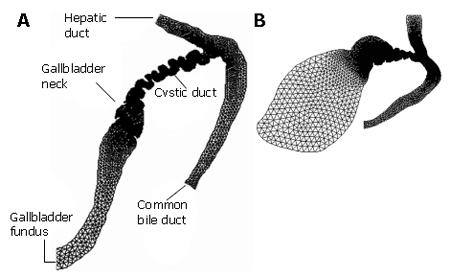
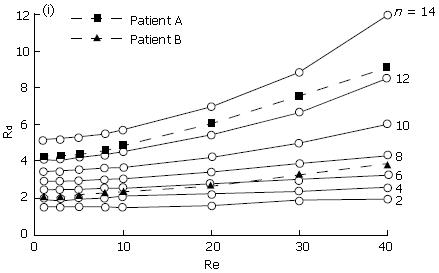
Ooi et al[34] studied the effect of the cystic duct geometry on the flow resistance using both two-, and three dimensional cystic duct models. In their numerical study, the cystic duct was modelled as a straight pipe with two types of baffles of different numbers and height (Figure 2). The bile was assumed to be Newtonian, and its viscosity varied between 1-4 mPa.s. The results were then compared with more realistic two-dimensional models based on patient’s biliary system images (Figure 3). It was found that both the baffle height and number of baffles can significantly affect the flow resistance. In fact, the flow resistance responds to these geometric effects much more than to an increased bile viscosity. Under the same flow conditions, the resistance from the scanned model based on a diseased gallbladder was found to be larger than that of a healthy one (Figure 4).
Figure 2 Two types of the cystic duct models used by Ooi et al[43] (modified from Figure 2 in the Journal of Biomechanics, vol 37, page 1913-1922) .
Figure 3 Computational models built from two patients' biliary system images used by Ooi et a[[43] (modified from Journal of Biomechanics, vol.
37, page 1913-1922, Figure 2). Patient A is reported to have gallstones, and patient B is the normal control.
Figure 4 The resistance, Rd, plotted with the Reynolds number, Re (which is defined as the ratio of inertia over viscous forces, and is proportional to the flow rate for a given duct and bile).
n is the number of the baffles in the duct[43] (modified from Journal of Biomechanics, vol. 37, page 1913-1922, Figure 6).
In an attempt to validate the numerical results by Ooi et al[43], Al-Altabi et al[79-81] performed a series of experimental studies on the flow patterns in a tube with uniform baffles as shown in Figure 2A. In these experiments, the Reynolds number was more than 50, which is much higher than that in the human biliary system (which is usually less than 10). Therefore, only qualitative comparisons between the experiments and the numerical modelling of could be made. However, in the higher Reynolds number range, good quantitative agreement between the numerical results from these duct models and the experimental measurements were obtained by Al-Altabi et al[80,81]. In addition, they discovered that the flow in the duct with baffles presented complicated mixing layers and possibly turbulent flows when the Reynolds number was higher. Based on these findings, a one-dimensional model was put forward to predict the pressure drop for a turbulent flow in the duct model with baffles[81]. However, it remains to be shown that these results are of any relevance to biliary flow which operates at a much lower Reynolds number range.
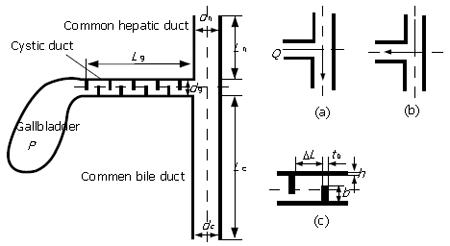
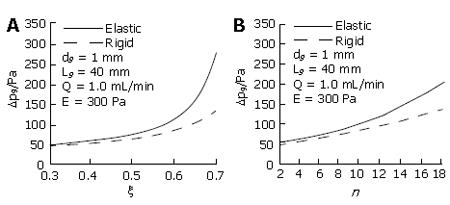
In all these studies, the cystic duct was studied in isolation, and the duct wall was assumed to be rigid. A further development by Li et al[44] studied one-dimensional rigid and elastic wall models for the biliary system, including the cystic duct, and the T-junction of the common bile duct and hepatic duct (Figure 5). Cystic ducts with baffles were modelled using the concept of equivalent diameter and length, and can be either rigid or elastic. Both emptying and refilling phases were considered. Using this model, the effects of the geometry, elasticity of cystic duct wall, bile flow rate and viscosity on the pressure drop, were studied in detail. It was found that many factors, including the elastic modulus and bile viscosity, can affect the pressure drop. However, the geometric changes in the cystic duct were still dominant. Among the geometric factors, the baffle height, b, was found to have more significant effect than the number of baffles, because it caused a greater change in the equivalent diameter and length. The pressure drop also increased with a decrease in the Young’s modulus of the cystic duct during emptying, as a more compliant duct tended to collapse at the downstream end, thus narrowing the equivalent diameter further (Figure 6). However, it was also found that a more compliant gallbladder duct gave rise to an area of expansion near the gallbladder neck thus increasing the equivalent diameter, which reduced the pressure drop required to drive the bile during emptying. In Li et al’s[44] model, it was found that when the elastic modulus of the cystic duct was more than 700 Pa, the wall deformation became negligible, and a rigid-walled model gave a good estimate of the pressure drop in the system. However, it was noted that the pressure drop in the cystic duct models predicted by both Ooi et al[34,44] and Li et al, as well as that from the in vitro measurements of Al-Atabi et al[79,80], was much smaller than the clinical observations of the opening pressure during emptying. The reason for this is, at least in part, that the function of the Sphincter of Oddi was not included, and also because the real nature of the bile, the complicated cystic duct geometry, the soft tissue deformation, and their interactions were not fully taken into account.
Figure 5 One-dimensional model of human billiary system and bile flow directions in the (a) emptying and (b) refill phases, (c) details of baffles at one section of the cystic duct[44].
p is the pressure inside the gallbladder, and Q is the flow rate of bile fluid. (Modified from figure 2 to be published in ASME Journal of Biomechanical Engineering).
Figure 6 Pressure loss variations with baffle height ratio (A) and baffle number (B) for both rigid and elastic models[44].
(Modified from figure 8 to be published in ASME Journal of Biomechanical Engineering).
CORRELATION OF MECHANICAL FACTORS TO BILIARY PAIN
Acalculous biliary pain or functional biliary pain is defined as steady pain located in the epigastrium and right upper quadrant in the absence of gallstones or when other structural abnormalities exists in the biliary tract[82]. However, surgery for this condition is often conducted without any guarantee of relieving the symptoms, so a reliable pain prediction model is needed. Previous attempts to provide an accurate predictor for relief of gallbladder symptoms have not been successful with only about 50% of patients obtaining symptomatic relief following surgery[83]. Moreover some patients without stones appear to have typical gallbladder pain, but only half of them gain relief of their pain if the gallbladder is removed. It would therefore be useful to have a way of determining whether the pain is actually arising in the gallbladder, because similar symptoms can be produced by adjacent organs, such as the stomach, duodenum and pancreas, even without obvious disease.
Impaired motor function of gallbladder and sphincter of Oddi have long been suspected as a major factor contributing to gallbladder pain. The presumed mechanism for the pain is obstruction leading to distension and inflammation. The obstruction might result from a lack of co-ordination between the gallbladder and either the cystic duct or the sphincter of Oddi due to increased flow resistance or tone[84]. In other words, pain may be produced by contraction against resistance or stretch of the gallbladder wall. When the gallbladder is inflamed, artificial distension produces typical pain[62].
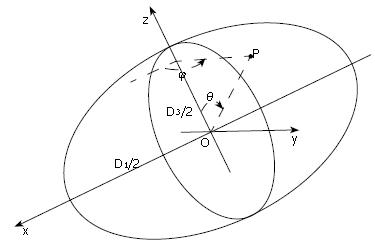
Preliminary work has been carried out to identify the correlation between possible mechanical factors to biliary pain[85]. Li et al[44,86] developed a mathematical model for the human biliary system during the emptying phase, based on a clinical test in which gallbladder volume changes are measured in response to a standard stimulus and a recorded pain profile. In their model the gallbladder was assumed to be a thin-walled ellipsoid under uniform pressure (Figure 7), where the three axis lengths can be estimated from the in vivo volume measurements. Using this information, together with the constitutive equation (1), choosing the compliance C to be 2.731 mL/mmHg[87], they predicted the flow resistance, R, in the biliary ducts using a Windkessel model[88]:
Figure 7 Gallbladder body shape during emptying is assumed to be ellipsoidal with major and minor axis lengths D1, D2 and D3 (D1 > D2≥ D3); the gallbladder is subjected to a uniform internal pressure.
The stress due to the pressure at any point P has three components, σθ (meridian), σφ (latitude) and τθφ (in surface)[85].
Math 1
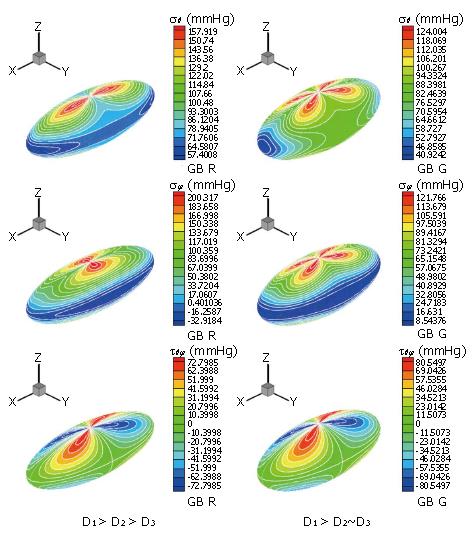
where Pd is the pressure at the downstream end of the tract. The detailed stress distributions in the gallbladder wall during emptying for different gallbladder geometries were also calculated analytically (Figure 8). This model was then applied to clinical data from CCK provocation tests from 25 patients. It was found that the pressure change in the gallbladder, the gallbladder ejection fraction and the shape change are all contributing to, but not solely responsible for the pain. However, the maximum stress in the gallbladder, σmax, is singled out to be the only factor closely correlated with gallbladder pain. In fact, using the simple criterion that the maximum stress σmax > 200 mmHg, 76% of the model predictions for pain agreed with the clinical results[44]. However further research is required to confirm the stress-pain relationship, and to validate and improve the model.
Figure 8 Li et al[85] calculated the stress distributions for two different subjects: R (left) and G (right).
The top frame is the principal meridian stress, σθ, the middle frame is the principal latitude stress, σφ, and the bottom one is the in-plane shear stress τθφ. It is seen that the location and the maximum stresses change as the ratio of the lengths of the three axes change.
FUTURE CHALLENGES
Patient-specific prediction of flow resistance
Current studies show that geometry changes in the biliary system play the dominant role in controlling bile flow and pressure drop. Further modelling work on 3D models of the biliary system is clearly required to help identify the key geometrical parameters.
In addition, if any prediction of flow resistance is to be used in clinical diagnosis, the model clearly needs to be patient-specific. The key to predicting patient specific flow features relies on obtaining the realistic geometry of the biliary system. This will involve three-dimensional geometrical reconstructions of the biliary system during emptying. Therefore, techniques for the reconstructions based on non-invasive clinical measurements need to be developed.
Bile rheology
It has been found that the bile can demonstrate non-Newtonian behaviour at low shear rates, but its relation with gallstone formation is not understood. Experiments on bile’s viscosity can be contradictory and it seems that the bile property is not only subject dependent, but also pathologically dependent. In other words, it changes with the status of bile concentration and with tiny stones (crystals) forming, and the collective behaviour is controlled by the resulting two-phase flow. More experimental and modelling work are required to understand the bile rheology before we can estimate the flow details more accurately; this is especially true if the measurement to be patient specific.
The constitutive equations for the gallbladder (and biliary tract) are still to be established even for a healthy subject. Currently, only limited information on the volume-pressure relation of the gallbladder and the length-tension relation for single muscle strips, are available. More experimental work is required to identify the mechanical properties both for healthy and diseased gallbladders. The lack of data on the mechanical properties makes it impossible to build a quantitatively reliable mathematical or numerical model to deal with the contraction and emptying activity of the human gallbladder. The biliary system also presents active contraction under chemical stimulations such as CCK. For instance, the gallbladder, the sphincter of Oddi, and even the cystic duct are reported to have this activity[89]. Needless to say, studying the active smooth muscle behaviour and its response to chemical stimulations during physiological and pathological gallbladder emptying poses an exciting challenge at the next level, both for experimentalists and biomechanics modellers.
Fluid-structure interactions
Fluid-structure interactions add to the complications when attempting to describe the behaviour of the biliary system. To date, only limited work has been carried out on the fluid structure interactions. Ooi et al[90] simulated the bile flow in a simple two-dimensional elastic cystic duct model, and the nature of the fluid-structure interactions was only crudely modelled in a one-dimensional model[44]. No work on the fluid-structure interactions in a three-dimensional model has been reported. However, it is the fluid-structure interactions in the biliary system that provide the crucial link between chemical stimuli and mechanical response in the biliary systems, since these chemical stimuli changes the tissue structure, hence the geometry and the elastic modulus, which in turn change the flow resistance and stresses in the system.
Prediction of the biliary pain
To date, only preliminary work has been carried out on the link between biliary pain and levels of stress within the system[44,86]. More work is required to confirm a positive correlation between the stress and bililary pain. Although the study by Li et al[86] considered both the active and the passive stresses, the active stress was not obtained from modelling of the smooth muscle mechanics; rather, it assumed a same generic form for all subjects. In practice, this will vary between individuals and in pathological situations.
DISCUSSION
The fluid dynamics in the human biliary system depend on the gallbladder motor function, biliary tract geometry, the smooth muscle activity, bile rheology and their interactions. These mechanical factors play important roles in the normal functions of the biliary systems and may help us to understand the nature and origin of ‘gallbladder pain’. There hasve been extensive clinical and experimental work both on human and animal biliary systems, however, only few modelling and numerical studies have been carried out to study the system from the mechanical point of view. This paper has reviewed the current progress in understanding the mechanical aspects of the biliary system, and covered the areas in bile fluid dynamics, bile rheology, gallbladder and duct tissue mechanics, mathematical and numerical modelling, and the correlations between the mechanical stresses and the gallbladder. The preliminary work reported here represents a significant step forward towards understanding the origins of gallbladder pain and gallstone disease.
S- Editor Liu Y L-Editor Alpini GD E- Editor Chin GJ


