Published online Mar 7, 2007. doi: 10.3748/wjg.v13.i9.1352
Revised: December 28, 2006
Accepted: February 10, 2007
Published online: March 7, 2007
The peristaltic transport of swallowed material in the esophagus is a neuro-muscular function involving the nerve control, bolus-structure interaction, and structure-mechanics relationship of the tissue. In this study, a finite element model (FEM) was developed to simulate food transport through the esophagus. The FEM consists of three components, i.e., tissue, food bolus and peristaltic wave, as well as the interactions between them. The transport process was simulated as three stages, i.e., the filling of fluid, contraction of circular muscle and traveling of peristaltic wave. It was found that the maximal passive intraluminal pressure due to bolus expansion was in the range of 0.8-10 kPa and it increased with bolus volume and fluid viscosity. It was found that the highest normal and shear stresses were at the inner surface of muscle layer. In addition, the peak pressure required for the fluid flow was predicted to be 1-15 kPa at the bolus tail. The diseases of systemic sclerosis or osteogenesis imperfecta, with the remodeled microstructures and mechanical properties, might induce the malfunction of esophageal transport. In conclusion, the current simulation was demonstrated to be able to capture the main characteristics in the intraluminal pressure and bolus geometry as measured experimentally. Therefore, the finite element model established in this study could be used to further explore the mechanism of esophageal transport in various clinical applications.
- Citation: Yang W, Fung TC, Chian KS, Chong CK. Finite element simulation of food transport through the esophageal body. World J Gastroenterol 2007; 13(9): 1352-1359
- URL: https://www.wjgnet.com/1007-9327/full/v13/i9/1352.htm
- DOI: https://dx.doi.org/10.3748/wjg.v13.i9.1352
The transit of food the bolus through the esophageal body depends on the properties of the bolus as well as the positions of the thorax when the swallow occurs. If the food is fluid-like and a person stands upright, it only takes 2-3 s for the food to approach the lower esophageal sphincter (LES). In this case, the bolus moves mainly under the influence of gravity. When either or both the content of bolus and the position of the thorax reduce the effects of gravity, the peristaltic mechanism plays the most important role for the bolus transport. The muscle contraction is first inhibited to allow the bolus to distend and fill the esophageal lumen. This inhibition is followed by the active muscle contractions near the bolus tail to maintain the lumen closure and propel the bolus towards the stomach. The contraction wave travels at a speed of 1-4 cm/s and duration of 5-10 s is required for the bolus to reach the LES, when the muscle at LES stats to relax and LES opens. The LES remains open for 5-10 s during which the food content is emptied from the esophagus to the stomach. Thus, food transport is an interactive process between the esophageal tissue, food bolus and muscle activity.
It is well known that the stress distribution within the esophageal wall is important to understand the mechanics-function relationship of the esophagus. The stress distribution under the physiological state has been widely investigated in the literature[1,2]. However, the effect of food bolus on tissue structure has usually been represented by a luminal pressure imposed on the internal surface of the esophageal tube while the bolus and the interaction between the tissue and bolus have been ignored. On the other hand, in the study conducted by Li et al[3], a mathematical model was established to simulate the fluid (food bolus) flow within the esophageal lumen. By applying the lubrication theory[4], the intraluminal pressure was predicted from the bolus geometry. It was shown that the simulation was able to capture the main feature of the variation in intraluminal pressure. However, due to the high sensitivity of the pressure variation in the contraction zone to the variation in bolus geometry, accurately prescribed geometry must be supplied. In the current study, rather than specifying the bolus geometry, the shape of food bolus is determined from a simulated peristaltic transport process by adjusting the contraction wave, bolus viscosity and material parameters of the tissue in the physiological range. A finite element model consisting of three primary composites, i.e., tissue, bolus and muscle contraction, as well as the interactions between them is established. The simulation aims to explore the physiological features during the food transport process and to investigate the effects of the tissue properties, the fluid viscosity and volume, as well as the active contraction wave on the transport efficiency.
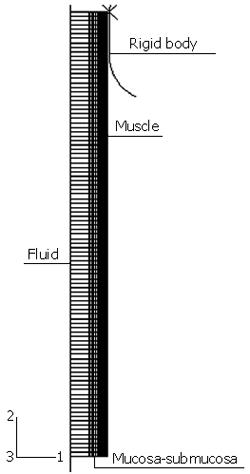
The parameters used to characterize the active contraction and bolus properties were borrowed from a few studies on the human esophagus in the literature[3,5-8] while the geometry and material parameters were measured from the porcine esophagus. In our previous study[9], it was proved that the porcine esophagus has similarities with the human being’s esophagus in terms of both axial length (25-30 cm for the pig 3-4 mo old vs 25 cm for an adult) and tensile strengths (circumferential and axial strengths are 1.2 and 3.7 MPa for the muscle and 1.6 and 8.7 MPa for the mucosa-submucosa[9] vs 1.4 and 2.2 MPa for the entire wall). Since detailed geometrical and mechanical parameters for the human’s esophagus were not available for our simulation, those for the porcine esophagus were taken as the representative so that the effects of the variations in mechanical properties on the efficiency of food transport could be examined. By assuming the esophagus a straight, circular cylindrical tube, an axisymmetrical model was constructed as shown in Figure 1. A segment of 10 cm in length was modeled to represent the abdominal region of esophagus connecting to the lower esophageal sphincter (LES). The finite element model was developed with ABAQUS 6.5 and it consisted of the following three components.
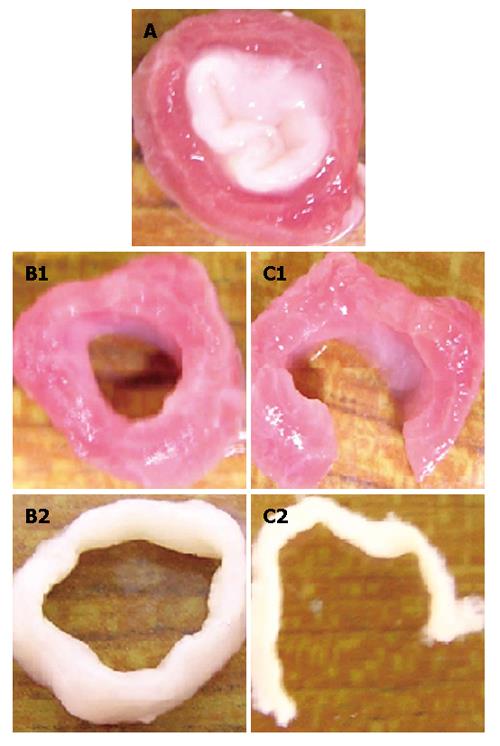
The first component is the esophageal tissue, which is modeled with both the inner mucosa-submucosal layer and outer muscle layer. Following the procedure used by Liao et al[1], the true zero-stress state was obtained by a circumferential cut for layer separation followed by a radial cut in each layer (Figure 2). The geometrical parameters, including the inner and outer radii at both the no-load state and zero-stress state as well as the opening angles at the zero-stress state, were measured with the image processing software Micro Image 4.5 (OLYMPUS-SZX12). The geometrical model was established by using the parameters at the no-load state as given in Table 1.
| Tissue | Muscle | Mucosa-submucosa | ||||||||
| Geo. | Bonded no-load state | True zero-stress state | Bonded no-load state | True zero-stress state | ||||||
| ri (mm) | r0 (mm) | Ri (mm) | R0 (mm) | θ (o) | ri (mm) | r0 (mm) | Ri (mm) | R0 (mm) | θ (o) | |
| 6.49 | 8.28 | 6.49 | 8.49 | 79.4 | 4.12 | 6.49 | 15.7 | 17.7 | 33.9 | |
| Mat. | μel (Pa) | κ1 (Pa) | κ2 | α (o) | λ0 | μel (Pa) | κ1 (Pa) | κ2 | α (o) | λ0 |
| 3752 | 23997 | 17.9 | 45 | 1.11 | 1010 | 9012 | 50.7 | 50.7 | 1.33 | |
| Fluid | μ = 0.2 Pa.s; ρ = 0.7 kg/m3; Cν = 7.2E5 Pa.s/kg | |||||||||
| Wave | νr = 0.5 mm/s; νι = 0.9 cm/s | |||||||||
It is known that the no-load state of the esophagus is not stress-free[10] and the residual stretches at the no-load state referred to the zero-stress state are evaluated as[11]:
Math 1
Math 2
where r0 and R0 are the outer radius at the no-load and zero-stress state; Θ = π - θ and θ is the opening angle; λz is the axial stretch ratio and it is assumed to be the unit. For the esophagus, the inner mucosa is compressed and the outer muscle layer is extended at the no-load state. It has been demonstrated in a previous study[10] that the residual strain significantly influences the stress distribution. For a more accurate simulation, the residual strain was introduced with the following method. Firstly, the residual deformation gradient tensor Fr was defined as the initial value of a solution-dependent variable in the subroutine SDVINI. Secondly, in the user material code (UMA) the current deformation gradient tensor referred to the true zero-stress state FCZ calculated at the start of iteration by multiplying the deformation gradient tensor referred to the no-load state FCN with Fr. The stress tensor and stiffness tensor were also calculated based on FCZ.
A structure-based constitutive model, which has been successfully applied for the esophageal tissue[9], was adopted in the simulation. With this model, the esophageal wall was modeled as an isotropic matrix of elastin reinforced with collagen fibers. Accordingly, the strain energy function ψ was decoupled into two components:
ψ = ψiso + ψaniso (3)
The neo-Hookean model was employed to describe the elastin as given in Eq.
ψiso = (μel/2) × (I1 - 3) (4)
where μel is a material constant equivalent to the shear modulus of elastin. It was assumed that the two families of collagen fibers were symmetrically arranged in θ - z plane and their orientations rendered the preferred direction of the tissue. An exponential function, as given in Eq, was used to capture the nonlinear elasticity of the collagen fibers:
Math 5
Where k1 is a material constant with the same dimension as stress and k2 is a dimensionless parameter related to the stiffening speed. I4 and I6 are the fourth and sixth invariants and can be expressed as:
I4 =λθ2cos2α+λz2sin2α (6)
I6 =λθ2cos2 (-α) +λz2sin2(-α) (7)
where α denotes the angle of the collagen fibers away from θ direction. I4 and I6 actually represent the squares of stretch ratios in the directions of the associated families of collagen fibers. A dimensionless parameter λ0 is introduced to scale the stretch ratio Ii1/2 so that the unfolding process of the collagen fiber can be accounted for. To characterize the distinct stiffness of each layer, two different groups of material parameters were given for the inner mucosa-submucosa and outer muscle layer. The parameters were determined from the inflation test with a regression method[10] and they were summarized in Table 1.
The tissue was meshed with a 4-node linear axisymmetric element (CAX4H) and it was discreted with 18 and 100 elements in the radial and axial directions, respectively. Geometrical nonlinearity was switched on for all the simulation steps.
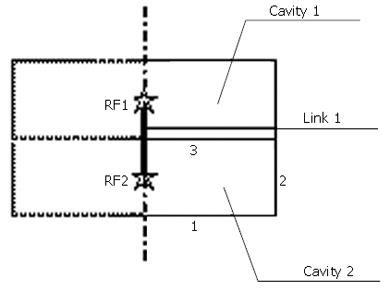
The food bolus was simulated as 100 fluid cavities connected in sequence by the fluid link elements. An example of fluid and fluid link element is illustrated in Figure 3. Each of the cavities is composed of three hydrostatic fluid elements (FAX2) and they share one common node called cavity reference node (RF). The fluid volume is that enclosed by the cylinder which is formed by revolving the three line elements. The outer boundaries of the cavity (e.g., element 2) share the same nodes with the inner boundaries of the tissue element so that the deformation of the fluid-filled tissue and the pressure exerted by the contained fluid on the cavity boundary of the structure are coupled.
In each cavity, the hydrostatic pressure is the same everywhere. However, the pressure in each cavity could be different and the difference in pressure between two adjacent cavities determines the flow rate through a fluid link element (FLINK) connecting the two RF nodes. There are 100 fluid link elements and the last one connects the RF node of the last cavity to an unconnected node representing the gastric pressure in the stomach. The relationship between the pressure difference (∆p) and the mass flow rate (q) is defined as the property of fluid link element as given in Eq.
∆p = Cvq (8)
where Cv denotes the viscous resistance coefficient. The effect of gravity has been ignored by assuming a supine position. For a local Poiseuille flow in a circular tube, Cv can be calculated as:
Cv = 8μ/πρrι4 (9)
where μ and ρ represent the fluid viscosity and density and they were given at 0.2 Pa.s and 0.7 kg/m3 for a normal food content[3]. rl is the luminal radius and it is equal to the inner radius of mucosa-submucosa at the bonded no-load state.
At the start of a peristaltic wave, the circular muscle cells shorten themselves and generate the contraction force. The mechanism of muscle contraction is complicated involving both the nerve controls and intrinsic properties of muscle cells[12]. However, from the view of consequence, the peristaltic contraction acts as an external force on the tissue structure and travels downward at a certain speed. In the model, a rigid body was defined as shown in Figure 1. By applying an inward radial displacement, the rigid body was in contact with the tissue structure and exerted a pressure force on the outer surface of the tissue. As it has been reported that the contraction zone extends 1-2 cm in length for the normal case[8], a 1 cm straight line and a 1/4 arc with the radius of 1 cm was defined as an axisymmetrical rigid body (RAX2). The arc segment was used in order to prevent the numerical singularity induced by the sudden increase in contact force at the transition point between the attached and detached region. The longitudinal travel of the contraction wave was simulated by controlling the axial displacement of the rigid body. The contraction speed vr and longitudinal traveling speed vl were set at 0.5 mm/s (i.e., circular muscle shortened at 3.14 mm/s) and 0.9 cm/s, respectively[8].
The objectives of simulation are, firstly, to investigate the main feature of the intraluminal pressure distribution and bolus shape at each stage of peristaltic transport; and secondly to study the effects of tissue properties, bolus properties, contraction and wave speed on the transport process.
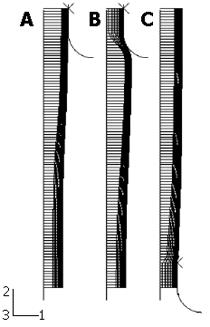
When considering that the simulated segment of esophagus connects the stomach through a LES at the distal end, the initial configuration of tissue (Figure 1) is self-balanced and hence the fluid filled in the tissue structure does not exert any force on the tissue. At this moment the fluid volume (V), which is equal to the lumen volume of the esophageal tube, is 5 mL. We start the simulation by perfusing another 2.5 mL fluid at the speed of 2.5 mL/s through the most proximal cavity. The filling of fluid expands and deforms the tissue at the top and the tissue reacts and in turn restrains further deformation. So the circumferential tensile stress is generated within the deformed wall and the intraluminal pressure at the top cavity has to increase to balance the stress in the tissue. As a consequence of the increase in pressure at the top fluid cavity, pressure difference is induced between the top cavity and its adjacent lower cavity and fluid transport is initiated. After the filling of fluid, free redistribution of fluid within all the cavities is allowed in the following 3 s. This is to simulate the ‘off’ response of muscle cells, i.e., muscle contraction begins 2-3 s after being stimulated[13,14]. Figure 4A presents the bolus shape after the redistribution of fluid and immediately before the muscle contraction. In this step, the bolus shape and intraluminal pressure distribution are determined by the properties of both the tissue and fluid bolus. By plotting the bolus shape and intraluminal pressure distribution simultaneously, the relationship between them is explored. Particularly, the effects of bolus viscosity and tissue properties on the maximal luminal radius (rmax) and maximal intraluminal pressure (Pmax) are evaluated by changing from 0.2 to 0.02 Pa.s, k1 in the muscle layer from 23997 to 2399.7 Pa, and λ0 in the mucosa-submucosal layer from 1.33 to 1.
In this step, the contact between the rigid body and the outer boundary of tissue is activated and the muscle contraction is simulated by specifying an inward radial velocity of the rigid body at 0.5 mm/s until the luminal radius decreases to about 0.5 mm. Since the cavity volume at the contraction zone (1 cm at the top) is forced to be reduced quickly, the intraluminal pressure in these cavities increases greatly which accelerates the downward flowing speed of the fluid. At the end of the muscle contraction, the main body of fluid bolus moves downward as shown in Figure 4B. In addition to the tissue and bolus properties, the intraluminal pressure distribution and bolus shape are also influenced by the contraction speed. The effect of the contraction speed on the peak pressure (Ppeak) is assessed by changing vr from 0.5 to 0.25 mm/s.
Due to the muscle contraction at the top region, the bolus content is pushed down to the lower region so that the muscle cells at the lower region are also stimulated and start to contract as well. So the contraction zone moves downwards at a certain speed as a peristaltic wave. This is simulated by specifying the axial velocity of the rigid body at 0.9 cm/s. With the downwards moving of peristaltic wave, the pressure at the bottom end increases and the LES opens. From this moment, the fluid in the esophageal lumen starts to flow into the stomach. The gastric pressure in the stomach is set at zero in this simulation. As shown in Figure 4C, some amount of food content has refluxed to the esophageal lumen when the peristaltic wave reaches the LES. This is because the continuous fluid flow is simulated and the fluid always flows from the higher-pressure region to the lower-pressure region. The secondary peristaltic wave or the next fluid bolus is supposed to further push the remaining bolus down and empty the food from the esophageal lumen. The fraction of bolus which has been cleared is evaluated as an index of the efficiency of peristaltic transport (Eff.). Our preliminary simulation showed that the transport efficiency was affected by the peristaltic wave speed. So the effect of the wave speed on the value of Eff. is investigated by changing vi from 0.9 to 0.38 cm/s. The effects of bolus viscosity, tissue properties and contraction speed are also examined.
In order to observe the features of food transport with bigger bolus, the simulation described above is repeated with a bolus volume of 10 mL.
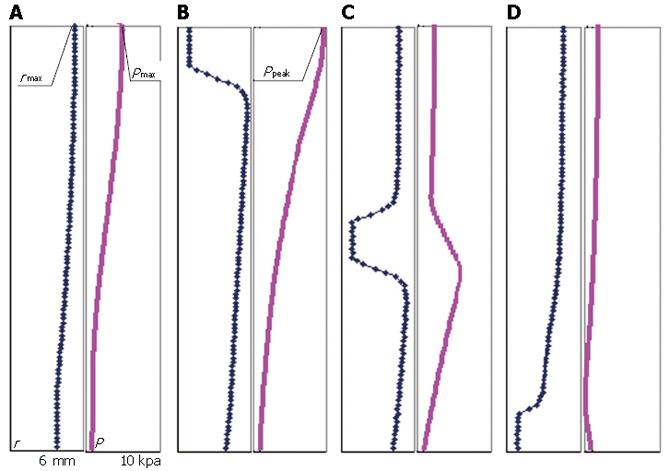
Figure 5 presents the bolus shape and intraluminal pressure distribution along the esophageal length at four representative stages, i.e., at the end of bolus filling and off response (before muscle contraction); at the end of muscle contraction at the top 1 cm segment; when the peristaltic wave reaches the middle of the entire segment; and when the peristaltic wave approaches to the end of the segment (LES).
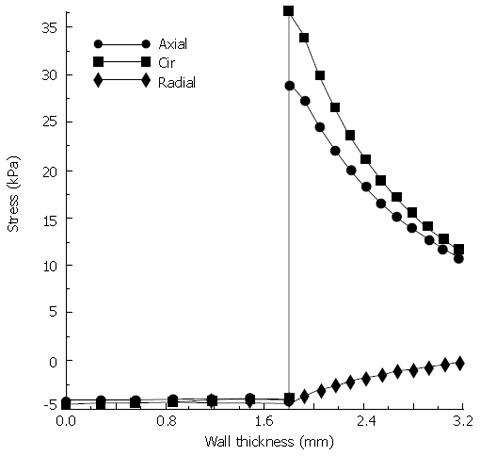
At every moment before muscle contraction, the pressure in fluid is balanced by the stress in tissue. As the pressure difference between the cavities induces the fluid flow, the bolus shape has to adjust its shape continuously with time to maintain the balance. At 3 s after the filling of food bolus, the luminal radius is the maximal at the top end (rmax = 5.3 mm) and smoothly decreases from the top to the bottom, as shown in Figure 5A. Correspondingly the maximal pressure Pmax is 4.4 kPa at the top end, which is in the range of the measured pressure in a normal human esophagus (Gregersen, 2003). It is found that all the stresses are significantly higher in the muscle layer than the mucosa-submucosal layer. The axial and circumferential stresses are the highest at the inner surface of muscle layer at the top end (29.0 and 36.5 kPa). Figure 6 presents the distribution of three normal stresses along the esophageal wall thickness. It shows that the muscle layer withstands most of the loading while the mucosa-submucosa layer just transmits the pressure. In addition to the normal stress, the shear stress also occurs due to the nonuniform bolus radius along the lumen length. The shear stress is the highest at the inner surface of muscle layer at 3.7 cm from the top end (238.6 Pa), where the greatest curvature of luminal radius occurs.
If a more fluid-like bolus is swallowed, the viscous resistance becomes smaller and the fluid flow is eased and accelerated. As given in Table 2, the maximal bolus radius and maximal intraluminal pressure are reduced by 15% and 83% respectively when the bolus viscosity decreases to 10% of the original viscosity. When the stiffness in the muscle layer decreases (k1 decreases by 90%) the tissue is easier to be dilated (rmax increases by 19%) and the intraluminal pressure is reduced (Pmax decreases by 46%). On the opposite, if the inner mucosa-submucosa layer becomes stiffer (by decreasing λ0 from 1.33 to 1) the maximal bolus radius is greatly decreased by 173% and the maximal intraluminal pressure is increased by 46%. Therefore, it is indicated that both the bolus properties and tissue properties effects the bolus radius and intraluminal pressure significantly.
| Parameter | rmax(mm) | Pmax(kPa) | λθ(muscle) | Ppeak(kPa) | Eff. (%) |
| Control (V = 7.5 mL) | 5.30 | 4.39 | 1.18 | 9.71 | 31.8 |
| μ = 0.02 Pa.s | 4.48 | 0.75 | 1.10 | 1.24 | 48.7 |
| κ1 = 2399.7 Pa | 6.32 | 2.37 | 1.30 | 6.65 | 19.0 |
| λ0 = 1 | 4.27 | 12.0 | 1.08 | 14.1 | 73.6 |
| νr = 0.25 mm/s | 5.30 | 4.39 | 1.18 | 6.25 | 33.9 |
| νl = 0.38 cm/s | 5.30 | 4.39 | 1.18 | 9.71 | 38.0 |
| Control (V = 10 mL) | 5.91 | 9.58 | 1.25 | 14.4 | 43.9 |
| μ = 0.02 Pa.s | 4.62 | 1.17 | 1.11 | 1.32 | 61.5 |
| κ1 = 2399.7 Pa | 7.12 | 7.28 | 1.39 | 9.73 | 22.4 |
| λ0 = 1 | 4.41 | 14.8 | 1.09 | 15.0 | 80.0 |
| νr = 0.25 mm/s | 5.91 | 9.58 | 1.25 | 8.94 | 46.7 |
| νl = 0.38 cm/s | 5.91 | 9.58 | 1.25 | 14.4 | 51.2 |
At the end of muscle contraction, the bolus radius at the top 1 cm segment is reduced to 0.5 mm and a steep slope forms due to the rapid increase of radius in the distal 1 cm segment as shown in Figure 5B. The intraluminal pressure is the maximal at the top end (Ppeak = 9.7 kPa), which is the pressure required for the fluid flow and is expected to be provided by the active muscle contraction. It is known that the stretch level of the circular muscle during the expansion of bolus affects the activity level of the muscle cells and hence the contraction force that they are able to generate (Cohen and Green, 1973). It is found that, for bolus with viscosity of 0.2 and 0.02 Pa.s, the circular muscle is stretched by 18% and 10% on average and the required peak pressures are 9.7 and 1.2 kPa respectively (Table 2). We assume that it represents the physiological condition for the normal esophagus, i.e., the muscle cells are able to generate the pressure which is required if and only if they are stretched to the corresponding levels indicated in the above two cases.
For the case of systemic sclerosis (SS) where the amount of collagen in mucosa increases and the tissue becomes stiffer (which is simulated by decreasing λ0 from 1.33 to 1 for the mucosa-submucosal layer), the inflation of the esophageal wall reduces during the transit of food and accordingly the stretch of muscle also reduces (λθ = 1.08). In this case, the contraction force generated by the muscle should be less than 1.2 kPa based on the above assumption. However, the pressure needed for the fluid flow is shown to be 14.1 kPa (Table 2), which is even higher than can be generated when the muscle is stretched by 18%. So the simulation implies that, in the case of SS disease, the esophageal tissue has to remodel itself so that higher contraction force can be generated when the muscle is stretched to a relatively small level. The simulation also shows that if the contraction speed decreases by 50%, the intraluminal pressure required for the fluid flow decreases by 36% (Table 2). It implies that if the self-adjustment does not work, the transport process of the SS esophagus will become slower compared to the normal case.
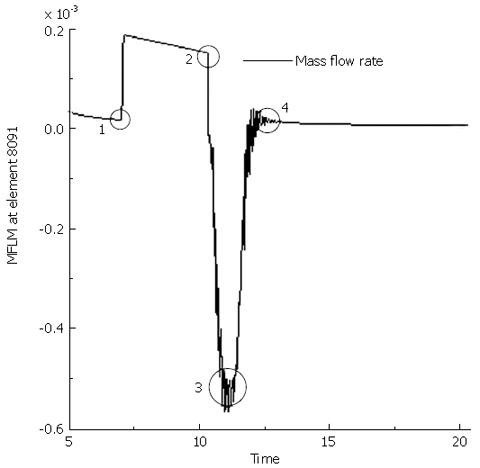
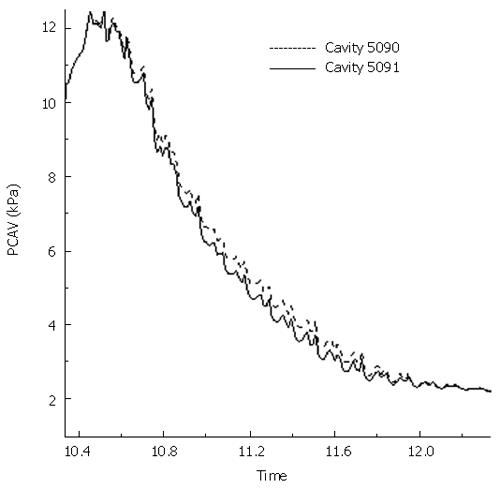
Figure 7 presents the mass flow rate from the fluid cavity 5091 (1 cm away from the top) to the fluid cavity 5090, two of which the fluid link element 8091 connects, during the muscle contraction and the moving of peristaltic wave. It shows that the flow rate increases suddenly when the contraction starts, decreases slightly during the process of contraction, and suddenly decreases at the end of contraction. During the first two seconds after the contraction, i.e., from the moment when the contraction wave leaves to the moment when it is 1 cm away from the cavity 5091, backward flow occurs. The reflux of fluid is due to the intraluminal pressure in the cavity 5090 is higher than that in cavity 5091 during this period, as shown in Figure 8. Even though the period of fluid reflux is short, it induces that the food content cannot be cleared up from the esophageal lumen to the stomach and some of them are retained in the esophagus as shown in Figure 5C and D. The transport efficiency is 31.8% for a bolus volume of 7.5 mL and viscosity of 0.2 Pa.s (Table 2). For fluid with lower viscosity (μ = 0.02 Pa.s), the transport efficiency increases by 53%. In the case of osteogenesis imperfecta (OI) where the collagen deficiency occurs (which is simulated by decreasing k1 to 10% of the original value for the muscle layer), the transport efficiency is reduced by 44%. While for the SS esophagus where the tissue becomes stiffer, it increases by 93% instead. So it is indicated that the higher stiffness of tissue results in higher percentage of bolus content to be cleared up. However, for the SS esophagus, the muscle contraction force required for the fluid flow increases greatly which might exceed the magnitude that the muscle contraction can provide. In conclusion, both esophageal diseases might induce the malfunction of the esophagus. From Table 2, it can also be found that the decrease of either the contraction speed or the peristaltic wave speed can increase the transport efficiency to some extent. It implies that higher transport efficiency could be achieved at the cost of slowing down of transport speed.
The simulation with a bolus volume of 10 mL shows similar features as described above. In comparison, with a bigger bolus, the maximal luminal radius increases by 12% during the filling process. Due to the stiffening of tissue properties, the maximal intraluminal pressure increases by an even higher percentage (118%). The peak pressure and transport efficiency also increase by 48% and 38% respectively. It implies that the muscle contraction has to be strengthened in order to transmit a bigger bolus. The simulation indicates that the efficiency increases for a bigger bolus transport. However, it is under the condition of this, that the increased peak pressure can be provided by the active muscle contraction, as assumed during the simulation. In reality, there is a limit for the maximum muscle contraction force. Therefore, the conclusion that the transport efficiency increases with bolus size could only be true within the physiological range. The parametric studies show that the effects of bolus viscosity, tissue properties and contraction wave speed are also similar with those found for the transport of the a 7.5 mL bolus.
In this study, the fluid is simulated as the fluid cavities between which the fluid could transmit through a fluid link as a Poiseuille flow. The fluid and tissue structure are coupled to simulate the interaction between them. It is found that the maximal intraluminal pressure increases with bolus volume and fluid viscosity. This is consistent with the observations in an experimental study conducted by Ren et al[6]. The active muscle contraction is represented as an external force imposed through a rigid body. By specifying the displacement of the rigid body, the contraction speed and wave speed is controlled. With the parameters in the physiological range, the peak pressure is predicted to be 1-15 kPa depending on bolus volume and viscosity. The predicted peak pressure agrees with the manometrically measured peak pressure very well[6]. It is also found that the peak pressure required for bolus transport could be reduced by slowing down the contraction speed. For the SS esophagus, the required peak pressure greatly increases, which might induce the failure and incomplete of bolus transport. The transport efficiency is found to be higher for the food bolus with lower viscosity and higher volume. For the IO disease, the esophageal wall is severely dilated and the transport efficiency greatly decreases. In order to regain the transport efficiency, the contraction speed or wave speed has to be reduced. In conclusion, both the IO or SS diseases might induce the malfunction of esophageal transport.
It is found that, during the filling of food bolus, both the normal and shear stresses are the highest at the inner surface of muscle layer. In contrast, the stresses in the mucosa-submucosa are very low. This is mainly because, at the bonded no-load state, the mucosa-submucosa is compressed substantially in order to accommodate the smaller space confined by the outer muscle layer. When the food bolus expands the esophageal lumen, the mucosa-submucosal layer unfolds itself first and hence it is exposed to a relatively lower circumferential strain. Therefore, the residual strain could be a protective mechanism to prevent the mucosa-submucosa tissue being over-stretched or over-stressed. It also indicates that the residual strain should be taken into account for an accurate evaluation of stress distribution along the esophageal wall.
In the current simulation, the lumen at the tail of the bolus is not occluded completely. This is due to the numerical difficulties encountered for further reducing of the lumen radius. In a previous study[3], a mathematical singularity in pressure also appeared in the limit of complete occlusion when the lubrication theory approximation was applied to simulate the esophageal transport. A very thin layer of bolus fluid, which was called the lubrication layer, was assumed to exist and extend through the simulated esophagus. It was demonstrated that the simulation could successfully capture the main feature of the pressure distribution under this assumption. In the current study, we adopted the same assumption and specified the lubrication radius at 0.5 mm throughout our simulation. In the physiological state, it is believed that the muscle contraction is able to seal the lumen at the bolus tail and there is less reflux for a normal transport process. Therefore, the transport efficiency is expected to be higher than that predicted in this simulation. However, the general trend in the transport efficiency due to the variations of physical parameter should still be valid and it could provide valuable information for future clinical studies.
S- Editor Liu Y L- Editor Alpini GD E- Editor Ma WH
| 1. | Liao D, Fan Y, Zeng Y, Gregersen H. Stress distribution in the layered wall of the rat oesophagus. Med Eng Phys. 2003;25:731-738. [RCA] [PubMed] [DOI] [Full Text] [Cited by in Crossref: 49] [Cited by in RCA: 50] [Article Influence: 2.4] [Reference Citation Analysis (0)] |
| 2. | Liao D, Zhao J, Fan Y, Gregersen H. Two-layered quasi-3D finite element model of the oesophagus. Med Eng Phys. 2004;26:535-543. [RCA] [PubMed] [DOI] [Full Text] [Cited by in Crossref: 33] [Cited by in RCA: 34] [Article Influence: 1.7] [Reference Citation Analysis (0)] |
| 3. | Li M, Brasseur JG, Dodds WJ. Analyses of normal and abnormal esophageal transport using computer simulations. Am J Physiol. 1994;266:G525-G543. [PubMed] |
| 4. | Li M, Brasseur JG. Non-steady peristaltic transport in finite-length tubes. J Fluid Mech. 1993;248:129-151. [DOI] [Full Text] |
| 5. | Brasseur JG, Dodds WJ. Interpretation of intraluminal manometric measurements in terms of swallowing mechanics. Dysphagia. 1991;6:100-119. [RCA] [PubMed] [DOI] [Full Text] [Cited by in Crossref: 91] [Cited by in RCA: 77] [Article Influence: 2.3] [Reference Citation Analysis (0)] |
| 6. | Ren J, Massey BT, Dodds WJ, Kern MK, Brasseur JG, Shaker R, Harrington SS, Hogan WJ, Arndorfer RC. Determinants of intrabolus pressure during esophageal peristaltic bolus transport. Am J Physiol. 1993;264:G407-G413. [PubMed] |
| 7. | Ren JL, Dodds WJ, Martin CJ, Dantas RO, Mittal RK, Harrington SS, Kern MK, Brasseur JG. Effect of increased intra-abdominal pressure on peristalsis in feline esophagus. Am J Physiol. 1991;261:G417-G425. [PubMed] |
| 8. | Pal A, Brasseur JG. The mechanical advantage of local longitudinal shortening on peristaltic transport. J Biomech Eng. 2002;124:94-100. [RCA] [PubMed] [DOI] [Full Text] [Cited by in Crossref: 56] [Cited by in RCA: 42] [Article Influence: 1.8] [Reference Citation Analysis (0)] |
| 9. | Yang W, Fung TC, Chian KS, Chong CK. Directional, regional, and layer variations of mechanical properties of esophageal tissue and its interpretation using a structure-based constitutive model. J Biomech Eng. 2006;128:409-418. [RCA] [PubMed] [DOI] [Full Text] [Cited by in Crossref: 44] [Cited by in RCA: 41] [Article Influence: 2.2] [Reference Citation Analysis (0)] |
| 10. | Yang W, Fung TC, Chian KS, Chong CK. 3D Mechanical properties of the layered esophagus: experiment and constitutive model. J Biomech Eng. 2006;128:899-908. [RCA] [PubMed] [DOI] [Full Text] [Cited by in Crossref: 49] [Cited by in RCA: 52] [Article Influence: 2.9] [Reference Citation Analysis (0)] |
| 11. | Gregersen H, Lee TC, Chien S, Skalak R, Fung YC. Strain distribution in the layered wall of the esophagus. J Biomech Eng. 1999;121:442-448. [RCA] [PubMed] [DOI] [Full Text] [Cited by in Crossref: 57] [Cited by in RCA: 48] [Article Influence: 1.8] [Reference Citation Analysis (0)] |
| 12. | Gregersen H. Biomechanics of the Gastrointestinal Tract: New Perspectives in Motility Research and Diagnostics. London: Springer 2003; . [DOI] [Full Text] |
| 13. | Cohen S, Green F. The mechanics of esophageal muscle contraction. Evidence of an inotropic effect of gastrin. J Clin Invest. 1973;52:2029-2040. [RCA] [PubMed] [DOI] [Full Text] [Cited by in Crossref: 48] [Cited by in RCA: 38] [Article Influence: 0.7] [Reference Citation Analysis (0)] |
| 14. | Muinuddin A, Paterson WG. Initiation of distension-induced descending peristaltic reflex in opossum esophagus: role of muscle contractility. Am J Physiol Gastrointest Liver Physiol. 2001;280:G431-G438. [PubMed] |


