Published online Feb 21, 2007. doi: 10.3748/wjg.v13.i7.997
Revised: December 17, 2006
Accepted: January 23, 2007
Published online: February 21, 2007
AIM: To investigate the role of cytochrome P450 (CYP) in the carcinogenesis of squamous-cell carcinoma (SCC) in human esophagus by determining expression patterns and protein levels of representative CYPs in esophageal tissue of patients with SCC and controls.
METHODS: mRNA expression of CYP2E1, CYP2C, CYP3A4, and CYP3A5 was determined using RT-PCR in both normal and malignant esophageal tissues of patients with untreated esophageal SCC (n = 21) and in controls (n = 10). Protein levels of CYP2E1, CYP2C8, CYP3A4, and CYP3A5 were measured by Western blot.
RESULTS: Within the group of SCC patients, mRNA expression of CYP 3A4 and CYP2C was significantly lower in malignant tissue (-39% and -74%, respectively, P < 0.05) than in normal tissue. Similar results were found in CYP3A4 protein levels. Between groups, CYP3A4, CYP3A5, and CYP2C8 protein concentration was significantly higher in non-malignant tissue of SCC patients (4.8-, 2.9-, and 1.9-fold elevation, P < 0.05) than in controls. In contrast, CYP2E1 protein levels were significantly higher in controls than in SCC patients (+46%, P < 0.05).
CONCLUSION: Significant differences exist in protein levels of certain CYPs in non-malignant esophageal tissue (e.g. CYP2C8, CYP3A4, CYP3A5, and CYP2E1) between SCC patients and healthy subjects and may contribute to the development of SCC in the esophagus.
- Citation: Bergheim I, Wolfgarten E, Bollschweiler E, Hölscher A, Bode C, Parlesak A. Cytochrome P450 levels are altered in patients with esophageal squamous-cell carcinoma. World J Gastroenterol 2007; 13(7): 997-1002
- URL: https://www.wjgnet.com/1007-9327/full/v13/i7/997.htm
- DOI: https://dx.doi.org/10.3748/wjg.v13.i7.997
Worldwide, esophageal cancer is one of the ten most common cancers[1] with an overall 5-year survival rate of 3%-10%[2]. Although the entity of adenocarcinoma is rising[3], the majority of carcinomas of the esophagus are squamous-cell carcinoma (SCC)[1]. Results of several epidemiological studies indicate that hot beverage, alcohol and tobacco are key risk factors for the development of carcinoma in the esophagus[1,4]. However, despite intense research[5], the role of xenobiotica-metabolizing enzymes in the development of esophageal SCC is not fully understood due to the lack of successful pharmacological therapies.
Cytochrome P450 (CYP) is a multi-gene superfamily of heme-containing enzymes catalyzing the oxidative metabolism of many compounds[6]. CYP families 1, 2, and 3, which are the main CYP families participating in the metabolism of xenobiotics, are highly expressed within the liver. However, several CYPs have been shown to be also expressed in extrahepatic tissues such as the esophagus[7]. CYPs not only function in the detoxification but may also be involved in the activation of potential (pro-) carcinogens. The alimentary tract is exposed to a large variety of compounds, including potential (pro-) carcinogens. Indeed, it has been proposed that extrahepatic tissue might play an important role in the CYP-mediated metabolism of xenobiotic compounds and therefore might affect the susceptibility of certain organs to the development of malignancies. However, knowledge on regulation and localization of CYPs outside the liver (i.e., the esophagus) is limited and should be clarified.
CYPs may play a critical role not only in the development of SCC in the esophagus but also in the treatment of SCC. Therefore, the aim of the present study was to determine mRNA expression and protein concentrations of representative CYPs (e.g., CYP2C, CYP2E1, CYP3A4, and CYP3A5) in macroscopically normal esophageal tissue of patients with untreated SCC and in disease-free controls. Furthermore, as the expression of CYPs may be altered throughout the development of carcinoma, levels of CYPs were also measured in SCC and compared to those determined in macroscopically normal neighboring esophageal tissue of the same patients.
The study was approved by the Ethics Committee of the Medical Clinic of the University of Cologne, Germany. Informed consent was obtained from all subjects included in the study. All subjects underwent endoscopy for medical screening. Of the 31 subjects enrolled, 21 had an untreated SCC of the esophagus. Ten subjects with a negative diagnosis of SCC in the esophagus or malignancies in the gastrointestinal tract and no history of esophageal SCC or other malignancies served as controls. Only subjects without medication known to affect expression of the investigated CYPs were included in the current study. All study participants completed a questionnaire concerning smoking and anthropometrical parameters (Table 1). Using a standard pinch forceps, two biopsies were obtained from macroscopically normal esophageal tissue of controls and patients with SCC. Furthermore, in SCC subjects two biopsies were taken from carcinoma. Biopsies were placed immediately in liquid nitrogen, and stored at -80°C until analysis. Histopathological analysis of SCC was performed by an experienced pathologist. Tumor staging was based on differentiation and varied from poorly differentiated (G1: n = 2, G1-2: n = 2), moderately differentiated (G2: n = 8, G2-3: n = 4) to well differentiated (G3: n = 5). In controls, the absence of SCC, inflammation, and any other pathological changes of the esophagus were confirmed endoscopically by an experienced physician.
| Parameter | Patients | Controls | P |
| n | 21 | 10 | |
| Age | 56.7 ± 1.9 | 51.1 ± 3.5 | 0.118 |
| Sex (Female/Male) | 7/14 | 5/5 | 0.425 |
| BMI | 23.8 ± 1.4 | 25.1 ± 0.6 | 0.370 |
| Cigarette usage (Yes/No) | 10/11 | 3/7 | 0.242 |
Both total RNA and protein were isolated using Trizol reagent following the instructions of the manufacturer (Invitrogene, Gaithersburg, MD, USA). Briefly, tissue was homogenized in Trizol reagent, chloroform was added and phases were separated into RNA and protein phases. RNA was precipitated using isopropanol, washed with ethanol and resuspended in RNAase-free water. Protein was precipitated using isopropanol and washed three times in 0.3 mol/L guanidin hydrochlorid in 95% ethanol solution. The protein pellet was dried, resuspended and the concentration of protein in each sample was determined using a commercially available Bradford assay (BioRad, Munich, Germany).
Using a first-strand cDNA synthesis kit (Invitrogen, Gaithersburg, MD, USA) cDNA was synthesized from 200 ng of total RNA. For the amplification of CYPs the following primer sequences were used: CYP2C8-19, detecting CYP2C isoformes 8 to 19: sense GCTAAAGTCCAGGAAGAGATTGA and antisense TCCTGCTGAGAAAGGCATGAAGT[8]; CYP2E1: sense AGCACAACTCTGAGATATGG and antisense ATAGTCACTGTACTTGAACT[8]; CYP3A4: sense CCAAGCTATGCTCTTCACCG and antisense TCAGGCTCCACTTACGGTGC[9]; CYP3A5: sense TGTCCAGCAGAAACTGCAAA and antisense TTGAAGAAGTCCTTGCGTGTC [9] . The PCR reaction mixture consisted of 0.6 μL of cDNA, 10 × PCR buffer, 200 μmol/L dNTPs (Boehringer, Mannheim, Germany), BSA (0.25 mg/mL), DMSO (2% v/v), 0.5 μmol/LM of specific primer and 0.5 U Taq-polymerase (Promega, Madison, WI, USA), and water to a final volume of 10 μL. For amplification of the four cytochrome P450 cDNAs, PCR-conditions were as follows: at 94°C for 3 s, at 45°C for 3 s, at 72°C for 30 s, for 32 cycles. Amplification of histone 3.3 (primer sequences: sense CGTGCTAGCTGGATGTCTT and antisense CCACTGAACTTCTGATTCGC[10]) was performed applying the following conditions: at 94°C for 3 s, at 45°C for 3 s, and at 72°C for 30 s, for 30 cycles. All measurements were carried out at least in duplicate in a rapid cycler (Idaho Tec., USA) within the linear range of the reaction. PCR products were separated in a 1.5% agarose gel, stained with ethidium bromide and photographed using a digital camera from Biometra (Goettingen, Germany). To ensure the success of PCR, human liver cDNA was used as a positive control. RT-PCR analysis was performed in triplicate, whenever possible. However, in case of a reduced mRNA availability, measurements were conducted in duplicate.
Antibodies used for the detection of CYP2E1 and CYP3A4 were a generous gift of Dr. M. Ingelman-Sundberg, Karolinska Institute, Stockholm, Sweden. Primary antibodies for the measurements of CYP2C8 and CYP3A5 were purchased from Chemicon, Inc. (Frankfurt, Germany).
On each blot, protein extracted from human liver was used as standard. Twenty to 30 μg of total protein and serial dilutions of standard protein (12.5, 25, and 50 μg) were separated by sodium dodecylsulphate-polyacryamide gel electrophoresis (SDS-PAGE) and transferred to nitrocellulose membranes. After blocked in 5% non-fat milk in Tris-buffered saline-Tween 20 (TBST, 0.01% v/v Tween 20), membranes were probed with dilutions of primary antibodies in TBS, followed by an incubation with the secondary antibody. The protein/antibody complex was visualized by enhanced chemiluminescence (SuperSignal® West Dura, Pierce, KTM, Bad Godesberg, Germany). Densitometric analysis was performed using the software AIDA (Raytest, Isotopenmessgeraete, Straubenhardt, Germany). Signal intensities of the samples were adjusted to the intensities of the serially diluted standards. To ensure equal loading, all blots were stained with Ponceau red. Haptene signals were normalized to β-actin using a commercially available antibody (Sigma Chemical Co., Munich, Germany).
Results are presented as means ± SE unless otherwise indicated. Fisher´s exact test was used to compare lifestyle data. The Mann-Whitney U-test was used for the comparison of relative mRNA concentration and protein levels measured in normal esophageal tissue obtained from patients with SCC and disease-free controls. Wilcoxon’s t-test was used for the comparison of relative mRNA expression and protein concentration measured in normal esophageal tissue and SCC of the same patient. P < 0.05 was considered statistically significant.
The majority of the 31 patients were of normal weight and their age ranged from 38-71 years. No differences were found in smoking habits between patients and controls (Table 1).
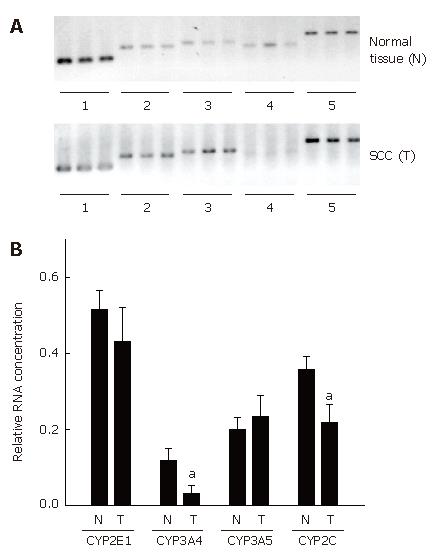
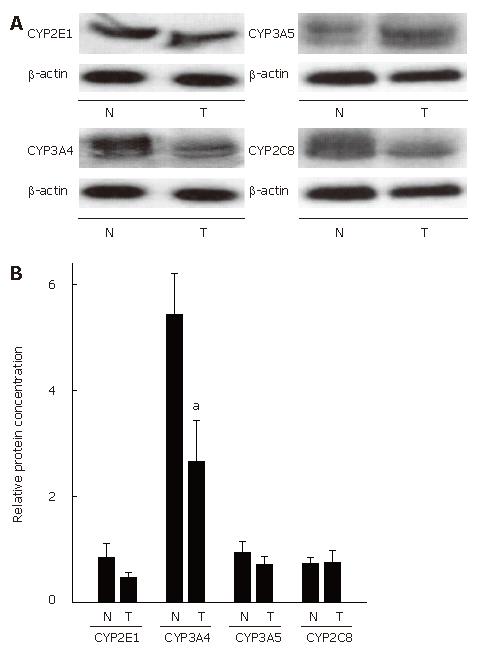
High quality of undegraded mRNA from normal esophageal tissue and SCC was obtained from 12 out of 21 patients with esophageal SCC. Expression of histone 3.3 mRNA, used as housekeeping gene, was detected in all samples. The results of RT-PCR measurements are summarized in Figure 1. In addition to RNA measurements, protein levels of CYPs were determined in normal esophageal tissue and in patients with SCC (n = 21) (Figure 2).
CYP2E1: In SCC patients, expression of CYP2E1 did not differ between normal esophageal tissue and SCC. Similarly, no differences were found in CYP2E1 protein levels between normal tissue and SCC.
CYP 3A5: CYP3A5 mRNA expression and CYP3A5 protein levels were comparable in normal esophageal tissue and SCC.
CYP2 (8-19): Expression of CYP2C (8-19) was significantly lower in tissue obtained from SCC patients that in normal neighboring esophageal tissue. Specifically, mRNA expression of CYP2C (8-19) was about 39% lower (P < 0.05) in tissue of SCC patients than in normal tissue. In addition, protein concentration of CYP2C8 was determined, however no differences were found between SCC and normal tissue.
CYP3A4: CYP3A4 mRNA expression was significantly lower in SCC than in normal neighboring esophageal tissue. Specifically, mRNA expression of CYP3A4 was about 74 % lower in SCC than in normal tissue (P < 0.05). Furthermore, protein levels of CYP3A4 were significantly lower (by about 51%) in SCC than in normal esophageal tissue (P < 0.05).
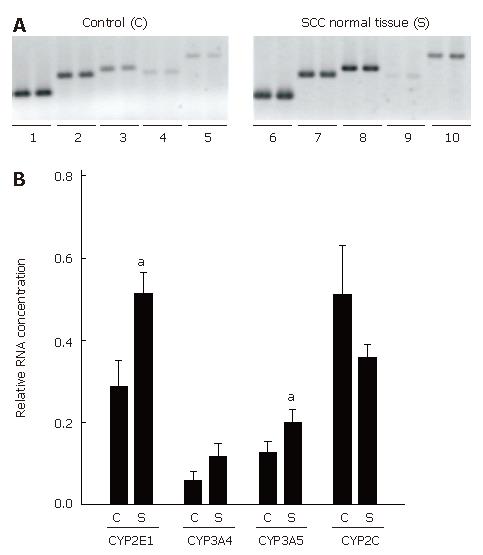
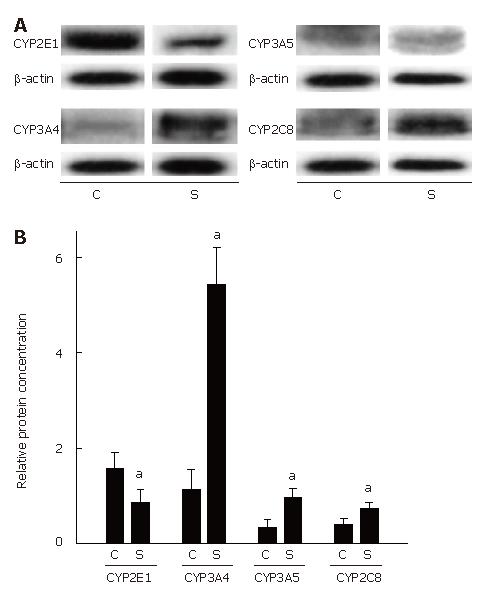
Furthermore, expression of CYP2C, CYP2E1, CYP3A4, and CYP3A5 mRNA and CYP2C8, CYP2E1, CYP3A4, as well as CYP3A5 protein concentrations were determined in normal esophageal tissue of untreated SCC patients (n = 21) and compared with those in 10 disease-free controls. Representative agarose gels depicting RT-PCR measurements and semiquantitative analysis of RT-PCR are shown in Figure 3. Expression of the housekeeping gene histone 3.3 was detected in all samples. Results of the comparisons of protein levels are summarized in Figure 4.
CYP2E1: Expression of CYP2E1 was found to be significantly higher by about 43 % in normal tissue obtained from patients with esophageal SCC than in disease-free controls (P < 0.05). Interestingly, CYP2E1 protein levels were significantly lower in normal tissue of SCC patients than in esophageal tissue obtained from disease-free controls (about -46%, P < 0.05).
CYP3A5: Expression of CYP3A5 mRNA in normal esophageal tissue was about 37 % higher in tissue obtained from SCC patients than in controls. Similar differences were found in protein levels, with protein levels of CYP3A5 being significantly higher by about 2.9-fold in normal esophageal tissue obtained from patients with esophageal SCC than in controls (P < 0.05).
CYP2C (8-19): No differences were found in CYP2C (8-19) mRNA expression between normal tissue of patients with esophageal SCC and controls. CYP2C8 protein levels were about 1.9-fold higher in normal tissue of SCC patients than in controls (P < 0.05).
CYP3A4: Similar to CYP2C (8-19), mRNA expression did not differ between normal tissue of patients with SCC and controls. However, when protein levels of CYP3A4 were compared between normal tissue of patients with SCC and controls, CYP3A4 protein concentration was found to be about 4.8-fold higher in normal tissue of SCC patients than in controls (P < 0.05).
Since it has been shown before by others and our group[11-13] that mRNA expression and protein concentration of CYP450 are not related in tissues of some digestive organs (e.g. colon), non-parametric correlation analysis of mRNA expression and protein levels for each CYP investigated was performed. Indeed, no significant correlations were found between mRNA expression and protein levels in any of the CYPs investigated (Table 2).
| Normal esophageal tissue | Spearmen R | P |
| CYP2E1 | -0.09 | 0.72 |
| CYP3A4 | 0.07 | 0.76 |
| CYP3A5 | 0.19 | 0.41 |
| CYP2C8 | 0.07 | 0.76 |
| Esophageal SCC | ||
| CYP2E1 | 0.02 | 0.96 |
| CYP3A4 | 0.16 | 0.65 |
| CYP3A5 | 0.49 | 0.15 |
| CYP2C8 | -0.22 | 0.53 |
Esophageal cancer is the third most common gastrointestinal cancer[1] with the majority of tumors being SCC[4]. It was reported that interindividual differences in CYP gene expression may contribute to the interindividual susceptibility to environmental (pro-) carcinogens and subsequently the development of malignancies[14]. Despite this hypothesis, only a few extensive studies have determined mRNA and/or protein expression of CYPs in esophageal tissue and esophageal carcinoma of humans, respectively[14-17] and most of these studies did not distinguish between adenocarcinoma and SCC. The presence of CYP2C-, CYP2E- and CYP3A- in normal esophageal tissue and SCC has been shown by others before[14-17]. However, some of the available data are contradictory and most studies determined either the expression or the protein levels in normal esophageal tissue and SCC. For example, using immunohistochemistry Murray et al[16] detected CYP3A, CYP1A, and CYP2C9 in most of the malignant tissue from patients with esophageal malignancies, but only CYP1A was detected in unaffected normal tissue of patients. Lechevrel et al[14] detected CYP3A4/5 and CYP2E1 protein and mRNA in some patients with adenocarcinoma or SCC in the esophagus. However, CYPs levels varied considerably between individuals and only CYP3A5 and CYP2E1 mRNA could be identified by RT-PCR. In the current study, CYP3A4 protein levels and CYP3A4 and CYP2C mRNA expression were found to be significantly lower in SCC than in its neighboring normal tissue. However, even more important, protein concentrations of CYP3A4, CYP3A5, and CYP2C8 were significantly higher in non-malignant esophageal tissue of patients with SCC than in tissues of healthy controls, while those of CYP2E1 were moderately reduced. At the level of mRNA expression, only CYP2E1 and CYP3A5 expression differed between groups. This finding can be considered to be of higher importance in carcinogenesis of the esophagus, as perpetually modified metabolism patterns of xenobiotics might result either in reduced detoxification of carcinogens or in elevated production of carcinogens from pro-carcinogens. The latter case might be of special importance due to strikingly increased amounts of CYP3A4 and CYP3A5 protein in non-malignant specimens from patients with SCC. These data suggest that the amount of CYPs might not only vary extensively between SCC and normal surrounding tissue but also between patients with SCC and healthy subjects. However, as in the present study CYP levels were only determined in SCC, it remains to be determined if expression and protein levels of CPYs are also altered in earlier stages of the disease (e.g., intraepithelial neoplasia of low and high grade). Furthermore, protein concentration of some CYPs (e.g., CYP2E1, CP2C8, CYP3A4, and CYP3A5) is considerably altered in normal tissue of patients with SCC compared to control subjects without malignancies. Hence, significant differences in protein concentration of these CYPs appear to be present before the development of malignancies in patients with SCC, suggesting that these enzymes are likely associated with the development of malignancies in the esophagus.
It has been suggested that expression of CYPs is not solely regulated at the level of gene transcription[18]. For instance, several studies performed in rodents and humans have reported a dissociation of mRNA expression and protein levels of CYP2C8 and CYP2E1, CYP3A4 and CYP3A5 in colon, duodenum and kidney, respectively[12,13,18]. Furthermore, in vitro studies performed in rat hepatocytes indicate that CYP2E1 is regulated by posttranscriptional ligand-dependent stabilization of the enzyme[19]. Similar mechanisms have been described for CYP3A in rats and humans[20,21]. Using cultured hepatocytes it also has been shown that only 60%-70% of mRNAs encoding for CYP2E1 are translated[22]. Indeed, in the present study, no correlation was found between protein and mRNA levels, suggesting that expression of certain CYPs (e.g., CYP2C8, CYP2E1, CYP3A4, and CYP3A5) in esophageal musoca might not solely be regulated at the level of transcription.
In conclusion, similar to the findings of others[14-17] interindividual variability along with a substantial dissociation of mRNA expression pattern and protein levels seems to be a characteristic of CYP expression. Although it is difficult to interpret the higher and lower levels of CYPs found in the present study, continued work focussing on the CYPs identified to have differential expression in patients with SCC is needed to determine their metabolic implications.
The antibodies against human CYP2E1 and CYP3A4 were kindly provided by Dr. M Ingelman-Sundberg.
S- Editor Liu Y L- Editor Wang XL E- Editor Ma WH
| 1. | Glade MJ. Food, nutrition, and the prevention of cancer: a global perspective. American Institute for Cancer Research/World Cancer Research Fund, American Institute for Cancer Research, 1997. Nutrition. 1999;15:523-526. [PubMed] |
| 2. | Eloubeidi MA, Desmond R, Arguedas MR, Reed CE, Wilcox CM. Prognostic factors for the survival of patients with esophageal carcinoma in the U.S.: the importance of tumor length and lymph node status. Cancer. 2002;95:1434-1443. [RCA] [PubMed] [DOI] [Full Text] [Cited by in Crossref: 313] [Cited by in RCA: 293] [Article Influence: 12.7] [Reference Citation Analysis (0)] |
| 3. | Bollschweiler E, Wolfgarten E, Gutschow C, Hölscher AH. Demographic variations in the rising incidence of esophageal adenocarcinoma in white males. Cancer. 2001;92:549-555. [RCA] [PubMed] [DOI] [Full Text] [Cited by in RCA: 5] [Reference Citation Analysis (0)] |
| 4. | Bollschweiler E, Wolfgarten E, Nowroth T, Rosendahl U, Mönig SP, Hölscher AH. Vitamin intake and risk of subtypes of esophageal cancer in Germany. J Cancer Res Clin Oncol. 2002;128:575-580. [RCA] [PubMed] [DOI] [Full Text] [Full Text (PDF)] [Cited by in Crossref: 64] [Cited by in RCA: 54] [Article Influence: 2.3] [Reference Citation Analysis (0)] |
| 5. | Metzger R, Schneider PM, Warnecke-Eberz U, Brabender J, Hölscher AH. Molecular biology of esophageal cancer. Onkologie. 2004;27:200-206. [RCA] [PubMed] [DOI] [Full Text] [Cited by in Crossref: 20] [Cited by in RCA: 38] [Article Influence: 1.8] [Reference Citation Analysis (0)] |
| 6. | Sheweita SA. Drug-metabolizing enzymes: mechanisms and functions. Curr Drug Metab. 2000;1:107-132. [RCA] [PubMed] [DOI] [Full Text] [Cited by in Crossref: 177] [Cited by in RCA: 153] [Article Influence: 6.1] [Reference Citation Analysis (0)] |
| 7. | Ding X, Kaminsky LS. Human extrahepatic cytochromes P450: function in xenobiotic metabolism and tissue-selective chemical toxicity in the respiratory and gastrointestinal tracts. Annu Rev Pharmacol Toxicol. 2003;43:149-173. [RCA] [PubMed] [DOI] [Full Text] [Cited by in Crossref: 602] [Cited by in RCA: 561] [Article Influence: 25.5] [Reference Citation Analysis (0)] |
| 8. | Hakkola J, Pasanen M, Purkunen R, Saarikoski S, Pelkonen O, Mäenpää J, Rane A, Raunio H. Expression of xenobiotic-metabolizing cytochrome P450 forms in human adult and fetal liver. Biochem Pharmacol. 1994;48:59-64. [RCA] [PubMed] [DOI] [Full Text] [Cited by in Crossref: 143] [Cited by in RCA: 125] [Article Influence: 4.0] [Reference Citation Analysis (0)] |
| 9. | Kivistö KT, Griese EU, Fritz P, Linder A, Hakkola J, Raunio H, Beaune P, Kroemer HK. Expression of cytochrome P 450 3A enzymes in human lung: a combined RT-PCR and immunohistochemical analysis of normal tissue and lung tumours. Naunyn Schmiedebergs Arch Pharmacol. 1996;353:207-212. [RCA] [PubMed] [DOI] [Full Text] [Cited by in Crossref: 41] [Cited by in RCA: 40] [Article Influence: 1.4] [Reference Citation Analysis (0)] |
| 10. | Futscher BW, Blake LL, Gerlach JH, Grogan TM, Dalton WS. Quantitative polymerase chain reaction analysis of mdr1 mRNA in multiple myeloma cell lines and clinical specimens. Anal Biochem. 1993;213:414-421. [RCA] [PubMed] [DOI] [Full Text] [Cited by in Crossref: 53] [Cited by in RCA: 50] [Article Influence: 1.6] [Reference Citation Analysis (0)] |
| 11. | Eliasson E, Johansson I, Ingelman-Sundberg M. Substrate-, hormone-, and cAMP-regulated cytochrome P450 degradation. Proc Natl Acad Sci USA. 1990;87:3225-3229. [RCA] [PubMed] [DOI] [Full Text] [Cited by in Crossref: 77] [Cited by in RCA: 68] [Article Influence: 1.9] [Reference Citation Analysis (0)] |
| 12. | Bergheim I, Bode C, Parlesak A. Decreased expression of cytochrome P450 protein in non-malignant colonic tissue of patients with colonic adenoma. BMC Gastroenterol. 2005;5:34. [RCA] [PubMed] [DOI] [Full Text] [Cited by in Crossref: 20] [Cited by in RCA: 24] [Article Influence: 1.2] [Reference Citation Analysis (0)] |
| 13. | Bergheim I, Bode C, Parlesak A. Distribution of cytochrome P450 2C, 2E1, 3A4, and 3A5 in human colon mucosa. BMC Clin Pharmacol. 2005;5:4. [RCA] [PubMed] [DOI] [Full Text] [Full Text (PDF)] [Cited by in Crossref: 39] [Cited by in RCA: 48] [Article Influence: 2.4] [Reference Citation Analysis (0)] |
| 14. | Lechevrel M, Casson AG, Wolf CR, Hardie LJ, Flinterman MB, Montesano R, Wild CP. Characterization of cytochrome P450 expression in human oesophageal mucosa. Carcinogenesis. 1999;20:243-248. [RCA] [PubMed] [DOI] [Full Text] [Cited by in Crossref: 66] [Cited by in RCA: 65] [Article Influence: 2.5] [Reference Citation Analysis (0)] |
| 15. | Ribeiro Pinto LF, Teixeira Rossini AM, Albano RM, Felzenszwalb I, de Moura Gallo CV, Nunes RA, Andreollo NA. Mechanisms of esophageal cancer development in Brazilians. Mutat Res. 2003;544:365-373. [RCA] [PubMed] [DOI] [Full Text] [Cited by in Crossref: 21] [Cited by in RCA: 24] [Article Influence: 1.1] [Reference Citation Analysis (0)] |
| 16. | Murray GI, Shaw D, Weaver RJ, McKay JA, Ewen SW, Melvin WT, Burke MD. Cytochrome P450 expression in oesophageal cancer. Gut. 1994;35:599-603. [RCA] [PubMed] [DOI] [Full Text] [Cited by in Crossref: 47] [Cited by in RCA: 49] [Article Influence: 1.6] [Reference Citation Analysis (0)] |
| 17. | Nakajima T, Wang RS, Nimura Y, Pin YM, He M, Vainio H, Murayama N, Aoyama T, Iida F. Expression of cytochrome P450s and glutathione S-transferases in human esophagus with squamous-cell carcinomas. Carcinogenesis. 1996;17:1477-1481. [RCA] [PubMed] [DOI] [Full Text] [Cited by in Crossref: 40] [Cited by in RCA: 42] [Article Influence: 1.4] [Reference Citation Analysis (0)] |
| 18. | Hakkak R, Korourian S, Ronis MJ, Ingelman-Sundberg M, Badger TM. Effects of diet and ethanol on the expression and localization of cytochromes P450 2E1 and P450 2C7 in the colon of male rats. Biochem Pharmacol. 1996;51:61-69. [RCA] [PubMed] [DOI] [Full Text] [Cited by in Crossref: 34] [Cited by in RCA: 35] [Article Influence: 1.2] [Reference Citation Analysis (0)] |
| 19. | Eliasson E, Mkrtchian S, Ingelman-Sundberg M. Hormone- and substrate-regulated intracellular degradation of cytochrome P450 (2E1) involving MgATP-activated rapid proteolysis in the endoplasmic reticulum membranes. J Biol Chem. 1992;267:15765-15769. [PubMed] |
| 20. | Feierman DE, Melnikov Z, Zhang J. The paradoxical effect of acetaminophen on CYP3A4 activity and content in transfected HepG2 cells. Arch Biochem Biophys. 2002;398:109-117. [RCA] [PubMed] [DOI] [Full Text] [Cited by in Crossref: 21] [Cited by in RCA: 25] [Article Influence: 1.1] [Reference Citation Analysis (0)] |
| 21. | Zangar RC, Hernandez M, Novak RF. Posttranscriptional elevation of cytochrome P450 3A expression. Biochem Biophys Res Commun. 1997;231:203-205. [RCA] [PubMed] [DOI] [Full Text] [Cited by in Crossref: 17] [Cited by in RCA: 17] [Article Influence: 0.6] [Reference Citation Analysis (0)] |
| 22. | Kocarek TA, Zangar RC, Novak RF. Post-transcriptional regulation of rat CYP2E1 expression: role of CYP2E1 mRNA untranslated regions in control of translational efficiency and message stability. Arch Biochem Biophys. 2000;376:180-190. [RCA] [PubMed] [DOI] [Full Text] [Cited by in Crossref: 38] [Cited by in RCA: 39] [Article Influence: 1.6] [Reference Citation Analysis (0)] |


