Published online Jun 7, 2007. doi: 10.3748/wjg.v13.i21.2939
Revised: January 25, 2007
Accepted: January 31, 2007
Published online: June 7, 2007
AIM: To investigate the clinical significance of mucosal expression of suppressors of cytokine signaling 1 (SOCS1) and SOCS3 in human ulcerative colitis (UC).
METHODS: Biopsy specimens for histological analysis and mRNA detection were obtained endoscopically from the rectum of 62 patients with UC (36 men; age 13-76 years). The patients were classified endoscopically according to Matts’ grade (grade 1 to 4). Expression of SOCS1 and SOCS3 mRNAs was quantified in samples by competitive reverse transcription-polymerase chain reaction (RT-PCR). GAPDH was used as an internal control for efficiency of RT-PCR and amount of RNA.
RESULTS: SOCS3 mRNA expression was significantly higher in inflamed mucosa of UC than in inactive mucosa. The level of expression was well correlated with the degree of both endoscopic and histologic inflammation. Interestingly, among the patients in remission, the group with relatively low expression of SOCS3 showed a higher rate of remission maintenance over a 12-mo period. In contrast, SOCS1 mRNA was expressed in both inflamed and non-inflamed colonic mucosa and was not correlated with the activity of colonic mucosa or prognosis.
CONCLUSION: These observations suggest that increased expression of mucosal SOCS3, but not of SOCS1, may play a critical role in the development of the colonic inflammation of UC.
- Citation: Miyanaka Y, Ueno Y, Tanaka S, Yoshioka K, Hatakeyama T, Shimamoto M, Sumii M, Chayama K. Clinical significance of mucosal suppressors of cytokine signaling 3 expression in ulcerative colitis. World J Gastroenterol 2007; 13(21): 2939-2944
- URL: https://www.wjgnet.com/1007-9327/full/v13/i21/2939.htm
- DOI: https://dx.doi.org/10.3748/wjg.v13.i21.2939
Ulcerative Colitis (UC) is a chronic inflammatory bowel disease characterized by a dysregulated mucosal immune response[1]. Many cytokines are involved in the immunopathogenesis of UC, but the importance of cytokine signaling in UC is not fully understood.
The suppressors of cytokine signaling (SOCS) are a family of proteins that regulates the strength and duration of the cytokine signaling cascade. There are eight members of the SOCS protein family: the cytokine-inducible SH2 domain-containing protein (CIS) and SOCS1 through SOCS7[2-7]. Accumulated evidence shows that SOCS proteins can potently block the Jak/STAT pathway in the pathogenesis of various inflammatory diseases[8]. The functions of SOCS1 and SOCS3 have been well documented in mouse colitis models. In a dextran sulfate-induced mouse model of colitis, SOCS3 expression was increased at day 5 and remained high for 2 wk[9]. Transgenic mice expressing a dominant-negative mutant of SOCS3 showed increased phosphorylation of STAT3 and suffered a more severe colitis than did wild-type control mice[9]. In a 2, 4, 6-Trinitrobenzene sulphonic acid-induced mouse model of colitis, SOCS1 expression was induced in intestinal mucosal lymphocytes, and SOCS1 transgenic mice developed colitis spontaneously with age[10]. It has been already reported that both SOCS1 and SOCS3 are expressed at high levels in the inflamed colonic mucosa of humans with UC[9,10], but functional significance of local SOCS expression remains unclear. The present study was undertaken to investigate the relation between levels of SOCS mRNAs and degree of inflammation in the colonic mucosa of UC patients.
Our subjects were 62 patients with UC who underwent colonoscopy. The age of the patients ranged from 13 to 76 years (mean + SD, 38.6 + 13.3 years). Rectal lesions were classified macroscopically with endoscopic Matts’ classification (Table 1)[11]. Patient characteristics are shown in Table 2.
| Endoscopic Matts’ grades |
| Grade 1---normal |
| Grade 2---mild granularity of the mucosa, with mild contact bleeding |
| Grade 3---marked granularity and edema of the mucosa, contact bleeding, and spontaneous bleeding |
| Grade 4---severe ulceration of mucosa with hemorrhage |
| Histologic Matts’ grades |
| Grade 1---normal appearance |
| Grade 2---some infiltration of the mucosa or lamina propria with either round cells or polymorphs |
| Grade 3---much cellular infiltration of the mucosa, lamina propria, and submucosa |
| Grade 4---presence of crypt abscesses, with much infiltration of all layers of the mucosa |
| Grade 5---ulceration, erosion, or necrosis of the mucosa, with cellular infiltration of some or all of its layers |
| Endoscopic Matts’ grade | |||||
| Characteristics | 1 | 2 | 3 | 4 | |
| n | 62 | 19 | 15 | 26 | 2 |
| Sex (male/female) | 36/26 | 11/8 | 10/5 | 13/13 | 2/0 |
| Mean age (in years) (range) | 38.6 | 36.2 | 39.1 | 40.1 | 37.0 |
| (13-76) | (13-61) | (18-65) | (18-76) | (25-49) | |
| Duration (in years) (range) | 6.0 | 4.7 | 8.2 | 5.6 | 5.0 |
| (0.1-29) | (0.2-10) | (0.1-20) | (0.1-29) | (1-9) | |
| Type | |||||
| (total/left hemi/rectal) | 42/10/10 | 14/1/4 | 10/4/1 | 17/4/5 | 1/1/0 |
| Tx | |||||
| Steroid | 24 | 5 | 7 | 10 | 2 |
| Azathioprine | 7 | 3 | 1 | 2 | 1 |
| Leukocytapheresis | 9 | 3 | 2 | 3 | 1 |
After endoscopic observation by colonoscopy (450ZH; Fuji Photo Optical Co., Ltd, Saitama, Japan, and/or 240Q; Olympus Co., Ltd, Tokyo, Japan), biopsy specimens were obtained endoscopically from these patients for histologic analysis and reverse transcription-polymerase chain reaction (RT-PCR) assay. The biopsy specimens were fixed routinely in 10% buffered formalin, stained with hematoxylin and eosin, and diagnosed histologically according to histologic Matts’ classification (Table 1)[11].
For the amplification of SOCS1, a pair of PCR primers was synthesized. The sequences were 5’-CCTTCCCCTTCCAGATTTGA-3’ for the 5’ primer and 5’-TCCTGGCTCCAGATACAGTT-3’ for the 3’ primer. For the amplification of SOCS3, the sequences of the primers were 5’-TCACCCACAGCAAGTTTCCCGC-3’ for the 5’ primer and 5’-GTTGACGGTCTTCCGACAGAGATGC-3’ for the 3’ primer. For the amplification of GAPDH, the sequences were 5’-AACATCATCCCTGCCTCTAC-3’ for the 5’ primer and 5’-TGGCAGGTTTTTCTAGACGG-3’ for the 3’ primer.
Total RNA from biopsy specimens was isolated with an Rneasy Mini kit (Qiagen, Valencia, CA, USA). First-strand cDNA was synthesized from 1 μg of total RNA with random 9-mers in a 20-μL total reaction volume. Before cDNA symthesis, the RNA sample was treated with Rnase-Free Dnase (Qiagen) to eliminate possible false positives due to residual genomic DNA. PCR was performed in triplicate in 10 μL reactions. GAPDH was used as an internal control for efficiency of RT and amount of RNA. Amplification conditions consisted of denaturation for 4 min at 94°C, annealing for 1 min at 65°C, and a final extension for 7 min at 72°C. The samples were amplified for 35 cycles. PCR products were run on 2% agarose gels containing 1 × TAE. After electrophoresis, RT-PCR products of SOCS-1 (277 bp), SOCS-3 (590 bp), and GAPDH (148 bp) were analyzed and quantified with a UV Transilluminator (Toyobo, Tokyo, Japan) and NIH image software. Each sample was investigated in triplicate.
Data were analyzed with StatView software (Japanese version, Hulinks, Tokyo, Japan) on a Macintosh Computer (Apple Computer, Cupertino, CA). Groups were compared with Student’s t-test. Differences were considered statistically significant at P < 0.05. Time-to-relapse curves were derived with the Kaplan-Meier method, and statistical significance was determined with the log-rank test.
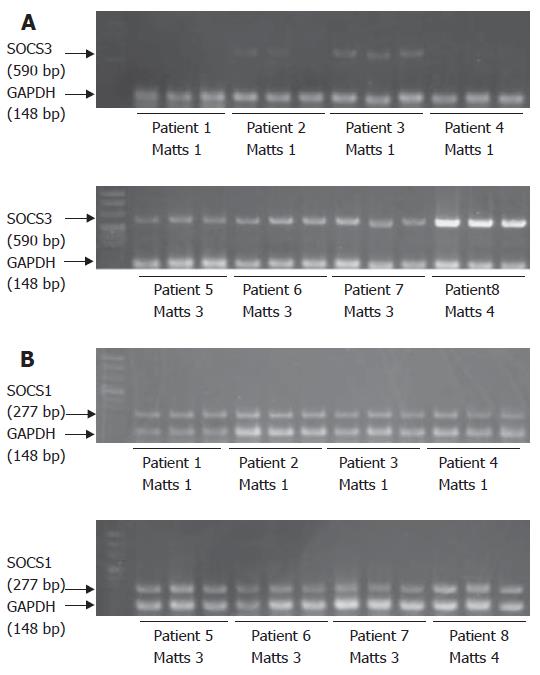
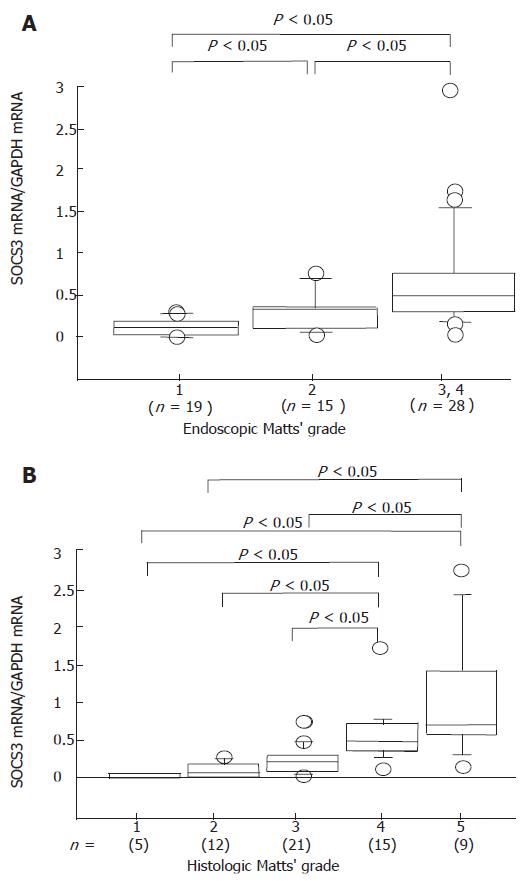
SOCS3 mRNA was detected in the colonic mucosa of patients with UC (Figure 1A), consistent with previous reports[12]. Upper level shows 4 cases of endoscopic Matts 1, and lower level shows 4 cases of Matts 3 and 4. Cases 1 to 4 with Matts 1 had low expression of SOCS3, and cases 5 to 8 with Matts 3 and 4 had high levels of SOCS3, as compared to expression of GAPDH. Quantitative analysis revealed that expression of SOCS3 mRNA was significantly higher in inflamed mucosa of UC than in inactive mucosa (Figure 2A). SOCS3 mRNA levels was also significantly correlated with histological Matts’ grade (Figure 2B).
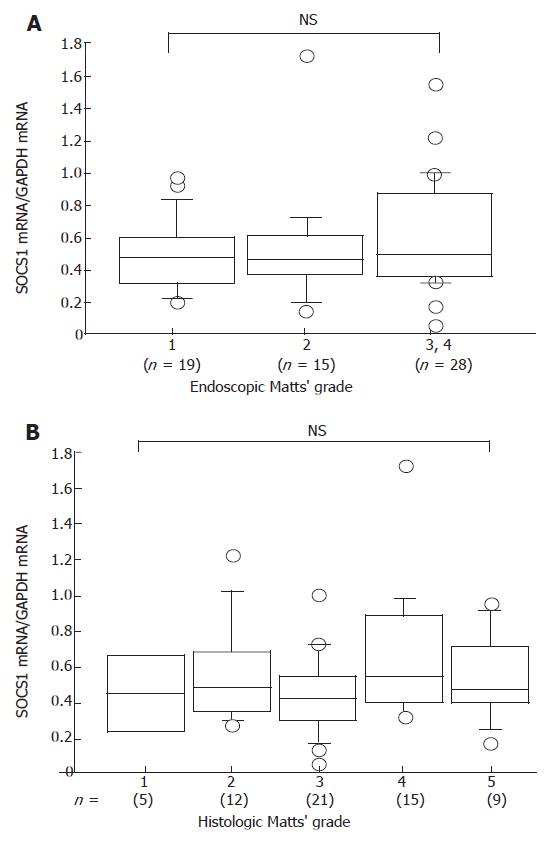
SOCS1 mRNA was expressed in both inflamed and uninflamed UC mucosa (Figure 1B); however, the level did not differ significantly (Figure 3A). The SOCS1 mRNA expression was all equally expressed compared to GAPDH. Quantitative analysis showed that there was no correlation between SOCS1 mRNA expression in the colonic mucosa and histologic Matts’ grade (Figure 3B).
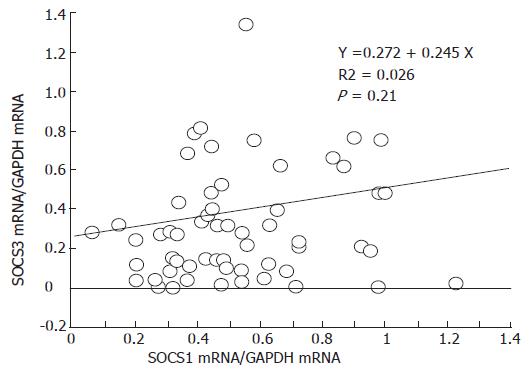
Although SOCS1 and SOCS3 are regulated by many cytokines, the relation between SOCS1 and SOCS3 remains unclear. Therefore, we evaluated the relation between expression of SOCS3 and SOCS1 mRNA and found that there was no correlation between SOCS1 and SOCS3 mRNA expression in each colonic biopsy specimen (Figure 4).
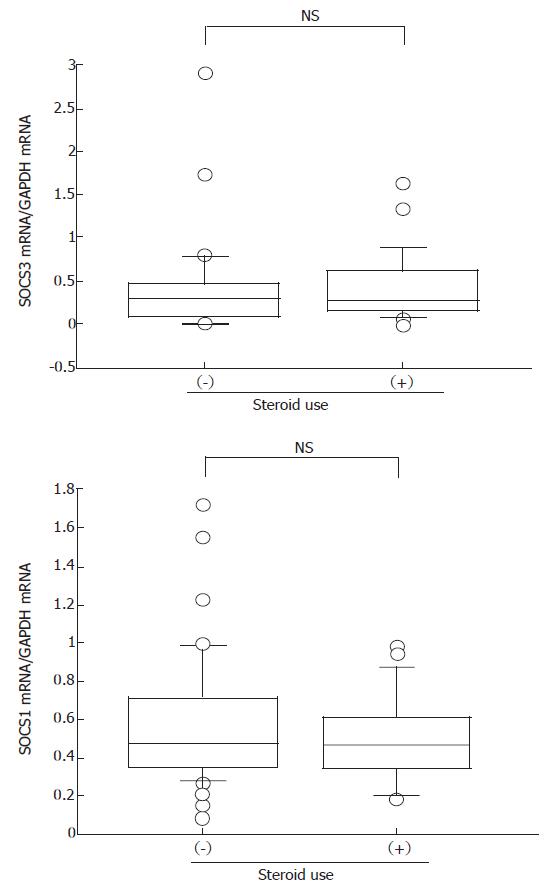
Because treatment with steroids is known to influence several immunological responses, we investigated the effect of steroid use on SOCS expression. There was a tendency for expression of both SOCS1 and SOCS3 to decrease in response to steroid treatment, but this difference was not statistically significant (Figure 5).
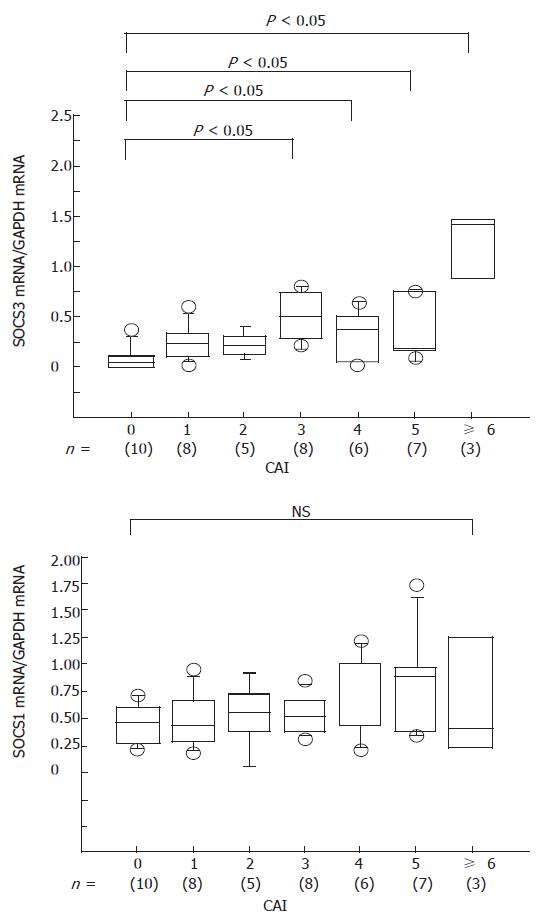
We examined the relation between the clinical activity and expression of SOCS mRNAs. The clinical activity of UC was evaluated according to the clinical activity index (CAI), which is calculated as the sum of each parameter[13]. We found that SOCS3 mRNA expression correlated well with CAI, whereas there was no correlation between SOCS1 mRNA and CAI (Figure 6).
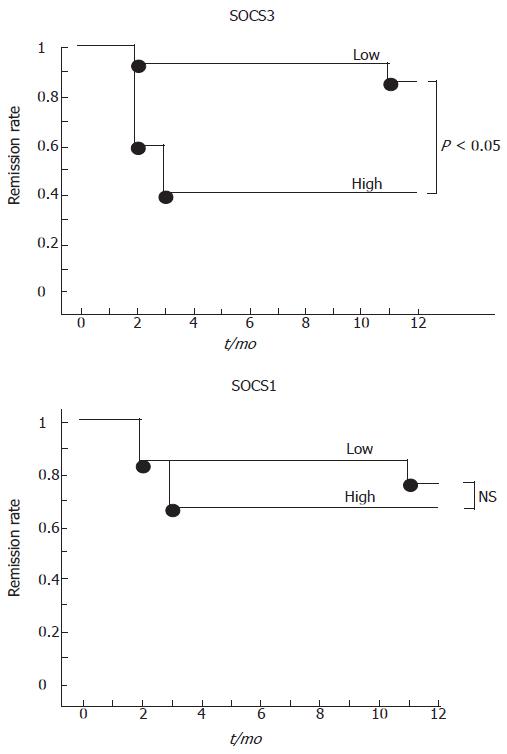
To determine if evaluation of SOCS expression is useful for prediction of prognosis for UC, we checked SOCS mRNA levels and CAI over a 12-mo period. Eighteen patients with UC in remission (CAI = 1 or 2) were analyzed for rectal SOCS expression and followed up. The patients were assessed when relapse occurred during the 12-mo period. A relapse was defined as CAI > 2. No change in treatment was made during the study. These patients were classified into two groups, low and high, according to SOCS expression levels. High SOCS3 was a SOCS3-to-GAPDH ratio of > 0.3, whereas low SOCS3 was a SOCS3-to-GAPDH ratio of ≤ 0.3. High SOCS1 was a SOCS1-to-GAPDH ratio of > 0.6, and low SOCS1 was a SOCS1-to-GAPDH ratio of ≤ 0.6. Patients who had low levels of SOCS3 (n = 14) remained in remission for the12-mo period, whereas patients with high levels of SOCS3 (n = 4) had low rate of maintaining an existing remission over the 12-mo period (Figure 7). There was no correlation between SOCS1 level and remission rate. No differences were found between the high and low SOCS3 groups in histologic score, concomitant medications, length of remission prior to inclusion in study, or history of frequency of relapses for the individual patients. These data suggest that mucosal SOCS3 expression may be a useful prognostic marker for the maintenance of remission in UC.
In the present study, we found that expression of SOCS3 mRNA is increased according to the degree of mucosal inflammation in UC and that the level of SOCS3 may be a useful prognostic marker for patients with UC. These findings suggest that SOCS3 has a significant role in UC.
In this study, we found a close correlation between SOCS3 expression and the severity of both macroscopic and histologic inflammation of UC. In contrast, SOCS1 expression did not correlate with the severity of colonic inflammation. Expression of both SOCS1 and SOCS3 is induced by a wide variety of inflammatory and anti-inflammatory cytokines, including IL-6, IL-12, IFN-γ, and IL-10[8]. We also found that there was no correlation between the levels of SOCS1 and SOCS3. Thus, high expression of SOCS3 may not be a secondary effect of mucosal cytokine induction due to inflammatory responses.
The pathogenesis of UC is still unknown, but there is accumulating evidence that T-helper 2 (TH2)-skewing immune dysregulation may be crucial in UC. Fuss et al[14] reported that lamina propria lymphocytes from UC secrete large amounts of IL-5 compared to those from healthy controls and Crohn’s disease patients. Recently, it was reported that lamina propria mononuclear cells from patients with UC produce large amounts of IL-13, much more than those from control subjects or patients with Crohn’s disease[15]. Moreover, it was also reported that IL-13 is the key effector TH2 cytokine in UC that affects epithelial tight junctions, apoptosis, and cell restitution[16]. Taken together, these data all suggest that the TH2-type immune response plays a crucial role in the pathogenesis of UC.
SOCS3 is expressed predominantly by TH2 cells[17]. SOCS3 negatively regulates the IL-12 to STAT4 Th1 pathways and is possibly required for mediating TH2 responses[18]. Interestingly, Seki et al[19] described a strong correlation between SOCS3 expression and the pathology of asthma and atopic dermatitis, well-known TH2-type diseases, as well as serum IgE levels in allergic human patients. They also showed that SOCS3 transgenic mice have increased TH2 responses in an airway hyperresponsibility model system[19]. Thus, SOCS3 has an important role in regulating the onset and maintenance of TH2-mediated immune diseases. Recently, it was reported that overexpression of SOCS3 in lung through adenovirus SOCS3 gene transfer enhances IgG immune complex-induced lung injury[20]. SOCS3 expressed at high levels in inflamed mucosa may therefore have a pathologic role in UC.
We have not examined the cellular localization of mucosal SOCS3 expression. In mice, it has been confirmed that SOCS3 mRNA is expressed mainly in hyperplastic epithelial cells and lamina propria mononuclear cells in DSS-treated inflamed colon[9]. Han et al[21] confirmed that SOCS3 protein is increased and localized primarily in lamina propria lymphocytes with a lower level of expression in crypt epithelial cells in a mouse model of colitis. According to our data, expression of SOCS3 mRNA is well correlated with the degree of histologic inflammation. Therefore, accumulation of inflammatory lamina propria immune cells may be one of the main sources of increased SOCS3 mRNA. The correlation between SOCS3 expression and the severity of UC raises the possibility that high SOCS3 expression in patients may be attributable to the accumulation of TH2 cells in the lamina propria, resulting in exacerbation of mucosal inflammation. Further studies of the cellular localization of SOCS3 are needed.
To explore the impact of high expression of SOCS3, we examined the relation between the period of remission and SOCS3 expression. The rate of remission maintenance was significantly higher in the low SOCS3 group than in the high SOCS3 group for 1 year. This finding also suggests that mucosal SOCS3 expression is not merely the result of inflammatory change. SOCS3 may be involved in the progression of the inflammation in UC.
Treatment with steroids is known to affect cellular immune responses. We found that the patients treated with steroids showed lower levels of both SOCS1 and SOCS3 than did untreated patients. It has been reported that rat SOCS3 gene in hepatocytes is down-regulated by glucocorticoids[22]. In contrast, removal of adrenal steroids by adrenalectomy reduces SOCS3 mRNA and protein levels[23]. It has been reported that SOCS1 is involved in the response of leukemia cells to glucocorticoids[24]. These raise the possibility that steroids may directly regulate SOCS expression. Targeting SOCS3 may provide a novel strategy to UC.
In summary, our present observations suggest that mucosal SOCS3 expression may play a critical role in the development of colonic inflammation associated with UC. Monitoring of rectal SOCS3 expression may be a useful means to evaluate prognosis of patients with UC.
S- Editor Liu Y L- Editor Rampone B E- Editor Wang HF
| 1. | Podolsky DK. Inflammatory bowel disease. N Engl J Med. 2002;347:417-429. [RCA] [PubMed] [DOI] [Full Text] [Cited by in Crossref: 2693] [Cited by in RCA: 2744] [Article Influence: 119.3] [Reference Citation Analysis (2)] |
| 2. | Yoshimura A, Ohkubo T, Kiguchi T, Jenkins NA, Gilbert DJ, Copeland NG, Hara T, Miyajima A. A novel cytokine-inducible gene CIS encodes an SH2-containing protein that binds to tyrosine-phosphorylated interleukin 3 and erythropoietin receptors. EMBO J. 1995;14:2816-2826. [PubMed] |
| 3. | Starr R, Willson TA, Viney EM, Murray LJ, Rayner JR, Jenkins BJ, Gonda TJ, Alexander WS, Metcalf D, Nicola NA. A family of cytokine-inducible inhibitors of signalling. Nature. 1997;387:917-921. [RCA] [PubMed] [DOI] [Full Text] [Cited by in Crossref: 1594] [Cited by in RCA: 1618] [Article Influence: 57.8] [Reference Citation Analysis (0)] |
| 4. | Endo TA, Masuhara M, Yokouchi M, Suzuki R, Sakamoto H, Mitsui K, Matsumoto A, Tanimura S, Ohtsubo M, Misawa H. A new protein containing an SH2 domain that inhibits JAK kinases. Nature. 1997;387:921-924. [RCA] [PubMed] [DOI] [Full Text] [Cited by in Crossref: 1079] [Cited by in RCA: 1085] [Article Influence: 38.8] [Reference Citation Analysis (0)] |
| 5. | Naka T, Narazaki M, Hirata M, Matsumoto T, Minamoto S, Aono A, Nishimoto N, Kajita T, Taga T, Yoshizaki K. Structure and function of a new STAT-induced STAT inhibitor. Nature. 1997;387:924-929. [RCA] [PubMed] [DOI] [Full Text] [Cited by in Crossref: 1002] [Cited by in RCA: 1009] [Article Influence: 36.0] [Reference Citation Analysis (0)] |
| 6. | Minamoto S, Ikegame K, Ueno K, Narazaki M, Naka T, Yamamoto H, Matsumoto T, Saito H, Hosoe S, Kishimoto T. Cloning and functional analysis of new members of STAT induced STAT inhibitor (SSI) family: SSI-2 and SSI-3. Biochem Biophys Res Commun. 1997;237:79-83. [RCA] [PubMed] [DOI] [Full Text] [Cited by in Crossref: 130] [Cited by in RCA: 130] [Article Influence: 4.6] [Reference Citation Analysis (0)] |
| 7. | Hilton DJ, Richardson RT, Alexander WS, Viney EM, Willson TA, Sprigg NS, Starr R, Nicholson SE, Metcalf D, Nicola NA. Twenty proteins containing a C-terminal SOCS box form five structural classes. Proc Natl Acad Sci USA. 1998;95:114-119. [RCA] [PubMed] [DOI] [Full Text] [Cited by in Crossref: 561] [Cited by in RCA: 619] [Article Influence: 22.9] [Reference Citation Analysis (0)] |
| 8. | Alexander WS, Hilton DJ. The role of suppressors of cytokine signaling (SOCS) proteins in regulation of the immune response. Annu Rev Immunol. 2004;22:503-529. [RCA] [PubMed] [DOI] [Full Text] [Cited by in Crossref: 555] [Cited by in RCA: 533] [Article Influence: 25.4] [Reference Citation Analysis (0)] |
| 9. | Suzuki A, Hanada T, Mitsuyama K, Yoshida T, Kamizono S, Hoshino T, Kubo M, Yamashita A, Okabe M, Takeda K. CIS3/SOCS3/SSI3 plays a negative regulatory role in STAT3 activation and intestinal inflammation. J Exp Med. 2001;193:471-481. [RCA] [PubMed] [DOI] [Full Text] [Full Text (PDF)] [Cited by in Crossref: 360] [Cited by in RCA: 379] [Article Influence: 15.8] [Reference Citation Analysis (0)] |
| 10. | Inagaki-Ohara K, Sasaki A, Matsuzaki G, Ikeda T, Hotokezaka M, Chijiiwa K, Kubo M, Yoshida H, Nawa Y, Yoshimura A. Suppressor of cytokine signalling 1 in lymphocytes regulates the development of intestinal inflammation in mice. Gut. 2006;55:212-219. [RCA] [PubMed] [DOI] [Full Text] [Cited by in Crossref: 31] [Cited by in RCA: 30] [Article Influence: 1.6] [Reference Citation Analysis (0)] |
| 11. | Matts SG. The value of rectal biopsy in the diagnosis of ulcerative colitis. Q J Med. 1961;30:393-407. [PubMed] |
| 12. | Brender C, Nielsen M, Kaltoft K, Mikkelsen G, Zhang Q, Wasik M, Billestrup N, Odum N. STAT3-mediated constitutive expression of SOCS-3 in cutaneous T-cell lymphoma. Blood. 2001;97:1056-1062. [RCA] [PubMed] [DOI] [Full Text] [Cited by in Crossref: 100] [Cited by in RCA: 99] [Article Influence: 4.1] [Reference Citation Analysis (0)] |
| 13. | Lichtiger S, Present DH. Preliminary report: cyclosporin in treatment of severe active ulcerative colitis. Lancet. 1990;336:16-19. [RCA] [PubMed] [DOI] [Full Text] [Cited by in Crossref: 243] [Cited by in RCA: 227] [Article Influence: 6.5] [Reference Citation Analysis (0)] |
| 14. | Fuss IJ, Neurath M, Boirivant M, Klein JS, de la Motte C, Strong SA, Fiocchi C, Strober W. Disparate CD4+ lamina propria (LP) lymphokine secretion profiles in inflammatory bowel disease. Crohn's disease LP cells manifest increased secretion of IFN-gamma, whereas ulcerative colitis LP cells manifest increased secretion of IL-5. J Immunol. 1996;157:1261-1270. [PubMed] |
| 15. | Fuss IJ, Heller F, Boirivant M, Leon F, Yoshida M, Fichtner-Feigl S, Yang Z, Exley M, Kitani A, Blumberg RS. Nonclassical CD1d-restricted NK T cells that produce IL-13 characterize an atypical Th2 response in ulcerative colitis. J Clin Invest. 2004;113:1490-1497. [RCA] [PubMed] [DOI] [Full Text] [Cited by in Crossref: 516] [Cited by in RCA: 574] [Article Influence: 27.3] [Reference Citation Analysis (0)] |
| 16. | Heller F, Florian P, Bojarski C, Richter J, Christ M, Hillenbrand B, Mankertz J, Gitter AH, Bürgel N, Fromm M. Interleukin-13 is the key effector Th2 cytokine in ulcerative colitis that affects epithelial tight junctions, apoptosis, and cell restitution. Gastroenterology. 2005;129:550-564. [RCA] [PubMed] [DOI] [Full Text] [Cited by in Crossref: 806] [Cited by in RCA: 892] [Article Influence: 44.6] [Reference Citation Analysis (0)] |
| 17. | Egwuagu CE, Yu CR, Zhang M, Mahdi RM, Kim SJ, Gery I. Suppressors of cytokine signaling proteins are differentially expressed in Th1 and Th2 cells: implications for Th cell lineage commitment and maintenance. J Immunol. 2002;168:3181-3187. [RCA] [PubMed] [DOI] [Full Text] [Cited by in Crossref: 184] [Cited by in RCA: 193] [Article Influence: 8.4] [Reference Citation Analysis (0)] |
| 18. | Yamamoto K, Yamaguchi M, Miyasaka N, Miura O. SOCS-3 inhibits IL-12-induced STAT4 activation by binding through its SH2 domain to the STAT4 docking site in the IL-12 receptor beta2 subunit. Biochem Biophys Res Commun. 2003;310:1188-1193. [RCA] [PubMed] [DOI] [Full Text] [Cited by in Crossref: 85] [Cited by in RCA: 98] [Article Influence: 4.5] [Reference Citation Analysis (0)] |
| 19. | Seki Y, Inoue H, Nagata N, Hayashi K, Fukuyama S, Matsumoto K, Komine O, Hamano S, Himeno K, Inagaki-Ohara K. SOCS-3 regulates onset and maintenance of T(H)2-mediated allergic responses. Nat Med. 2003;9:1047-1054. [RCA] [PubMed] [DOI] [Full Text] [Cited by in Crossref: 267] [Cited by in RCA: 287] [Article Influence: 13.0] [Reference Citation Analysis (0)] |
| 20. | Gao H, Hoesel LM, Guo RF, Rancilio NJ, Sarma JV, Ward PA. Adenoviral-mediated overexpression of SOCS3 enhances IgG immune complex-induced acute lung injury. J Immunol. 2006;177:612-620. [RCA] [PubMed] [DOI] [Full Text] [Cited by in Crossref: 23] [Cited by in RCA: 25] [Article Influence: 1.3] [Reference Citation Analysis (0)] |
| 21. | Han X, Sosnowska D, Bonkowski EL, Denson LA. Growth hormone inhibits signal transducer and activator of transcription 3 activation and reduces disease activity in murine colitis. Gastroenterology. 2005;129:185-203. [RCA] [PubMed] [DOI] [Full Text] [Cited by in Crossref: 49] [Cited by in RCA: 53] [Article Influence: 2.7] [Reference Citation Analysis (0)] |
| 22. | Paul C, Seiliez I, Thissen JP, Le Cam A. Regulation of expression of the rat SOCS-3 gene in hepatocytes by growth hormone, interleukin-6 and glucocorticoids mRNA analysis and promoter characterization. Eur J Biochem. 2000;267:5849-5857. [RCA] [PubMed] [DOI] [Full Text] [Cited by in Crossref: 55] [Cited by in RCA: 76] [Article Influence: 3.0] [Reference Citation Analysis (0)] |
| 23. | Madiehe AM, Lin L, White C, Braymer HD, Bray GA, York DA. Constitutive activation of STAT-3 and downregulation of SOCS-3 expression induced by adrenalectomy. Am J Physiol Regul Integr Comp Physiol. 2001;281:R2048-R2058. [PubMed] |
| 24. | Yoshida NL, Miyashita T, U M, Yamada M, Reed JC, Sugita Y, Oshida T. Analysis of gene expression patterns during glucocorticoid-induced apoptosis using oligonucleotide arrays. Biochem Biophys Res Commun. 2002;293:1254-1261. [RCA] [PubMed] [DOI] [Full Text] [Cited by in Crossref: 58] [Cited by in RCA: 59] [Article Influence: 2.6] [Reference Citation Analysis (0)] |


