Published online Feb 14, 2006. doi: 10.3748/wjg.v12.i6.880
Revised: March 25, 2005
Accepted: April 2, 2005
Published online: February 14, 2006
AIM: To observe biological characteristics of hepatocarcinoma cells before and after CD80 transfection and to compare the effect of CD80-transfected hepatocarcinoma cells on T lymphocyte activation.
METHODS: Retro virus vector carrying CD80 gene was transfected into HepG2 cells to establish CD80-transfected hepatocarcinoma cells (HepG2/hCD80). Flow cytometry (FCM) was performed to detect CD80 expression in the transfected cells. RT-PCR was used to evaluate CD80 expression at mRNA level. In the presence of anti-CD3 mAb, the proliferation of T lymphocyte was observed by MTT. Meanwhile, the expression of activated molecule marker CD25 was analyzed through FCM.
RESULTS: A stable cell line HepG2/hCD80 expressing the human CD80 was established. Growth curve showed that the molecule CD80 could obviously decrease the growth of tumor cells. HepG2/hCD80 was evidenced to have a potency to enhance T cell proliferation and upregulate CD25 expression.
CONCLUSION: CD80 transfection can lower malignant phenotype of hepatocarcinoma cells. CD80 transfection has a down-regulatory effect to activated T cells in vitro.
- Citation: Li DC, Zhu XG, Zhang Y, Fu JX. Role of CD80 in stimulating T lymphocyte activation. World J Gastroenterol 2006; 12(6): 880-884
- URL: https://www.wjgnet.com/1007-9327/full/v12/i6/880.htm
- DOI: https://dx.doi.org/10.3748/wjg.v12.i6.880
It has been widely accepted that T cell activation in the course of anti-tumor immunity requires two distinct signals for T helper precursor cell expansion[1,2]. Optimal activation of antigen-specific T cells requires not only the engagement of T-cell receptor (TCR) with Ag/major histocompatibility complex (MHC), but also co-stimulatory signals provided by antigen-presenting cells[3,4]. Among the interactions of these co-stimulatory molecules, ligation of CD28/CTLA-4 and CD86 or CD80 is regarded as a major signal transduction pathway[5]. As the first identified B7 family member, CD80 is widely expressed in a broad spectrum of tissues, even on some malignant tumor cells, thereby suggesting the potential mechanism of immune evasion of tumor cells[6]. Cancer of the liver is regarded as a tumor of low immunogenicity. Although there is a high level of HLA I expression on the surface of hepatocarcinoma cells, it still has a low immunogenicity due to the absence or low expression of CD80[7]. In this study, we established a CD80-transfected hepatocarcinoma cell line to observe the characteristic of HepG2/hCD80 and make further investigation on the role it plays in T cell activation.
Retro virus vector pLNShB7 carrying hCD80 was presented by Professor Lu Daru of Fudan University. Package cell (singlephilic GP+E86, doublephilic GP+envAm12) and fibroblast cell NIH3T3 were kept by Jiangsu Hematological Research Institute and cultured in DMEM supplemented with 150 mL/L new born calf serum (NCS), and incubated at 37 °C in a humidified atmosphere containing 50 mL/L CO2 in air. Hepatocarcinoma cell line HepG2 was purchased from Shanghai Zhongshang Hospital, cultured in RPMI 1640 medium supplemented with 150 mL/L NCS, and incubated at 37 °C in a humidified atmosphere containing 50 mL/L CO2 in air. ELISA kit was purchased from Shanghai Senxiong Biological Co., Ltd. Mouse IgG-PE or IgG-FITC was purchased from Immunotech Company. MTT kit was purchased from Sigma Company. The mouse anti-human CD80 mAb was kindly gifted by Dr. Qiu Yuhua, Immunology Research Institute of Suzhou University.
Plasmid pLNShCD80 was transfected into E. coli JM109 and was confirmed by EcoRI. Purified vector DNA was transfected into GP+E86 cells using Lipofectamine. Singlephilic GP+E86/CD80 cells were selected by G418 (0.6 g/L) and then Ping-pong transfection strategy was adopted to produce doublephilic GP+envAm12/CD80. Supernatant of GP+envAm12/CD80 was collected and stored at –80 °C.
HepG2 cells were incubated in Petri dish until they grew to 60% confluence. Then, the culture medium was replaced with 1:1 mixed virus supernatant and culture medium containing Polybrene at the final concentration of 4 mg/L. Such transduction process was repeated after a 3-h incubation at 37 °C. After 24 h, the cells were digested and adjusted to proper concentration for selective culture in medium with G418 (0.6 g/L). The empty vector-transfected HepG2 (HepG2/mock) cells were prepared as a negative control in the following experiment.
PCR was adopted to integrate NeoR gene in target cells and hCD80 gene. Primers for NeoR gene: 5’-CGTTG TCACT GAAGC GGGAA GG-3’. Primers for hCD80: 5’-ATTTT CTTCT CCTTT TGCCA GTAG-3’. Samples were initially denatured for 5 min at 95 °C. Gene amplification was conducted for 32 cycles, each cycle consisted of denaturation at 94 °C for 45 s, annealing at 58 °C for 45 s, and polymerization at 72 °C for 2 min, followed by an extra incubation at 72 °C for 7 min to ensure full extension of the products. Products of amplification were analyzed on 12 g/L agarose gels in Tris–borate–EDTA, and stained with ethidium bromide.
CD80-transfected HepG2 cells were cultured with anti-CD80 mAb (2 mg/L) at 4 °C for 30 min. After being washed twice, the FITC-goat anti-mouse IgG as secondary antibody was added, followed by incubation at 4 °C for 30 min. Then flow cytometry (FCM) was performed to detect the expression of CD80 after washes.
Total RNA was isolated from 106 transfected cells with TRIzol reagents (Takara, Dalian, China) following the manufacturer’s instructions. Using the total RNA as template, the first-strand cDNA of CD80 was obtained with oligo (dT) as a reverse primer following the manufacturer’s protocol. Then the PCR amplification was carried out under the similar PCR conditions with the primers mentioned above.
The HepG2/hCD80 or HepG2/mock cells were seeded onto a 24-well plate with 1×10⁵/well. During the 8-day culture, cells’ status was detected every day for an average value. According to the results, curves of cell growth were drawn and multiple proliferation time was calculated by the following formula: times of growth=maximum living cell number/living cell number of inoculation; multiple proliferation time=time from inoculation to the maximum cell number/time of growth.
Two milliliters fresh peripheral blood was diluted with Hanks’ balanced salt solution at a ratio of 1:3 and subjected to separation by 10 mL Ficoll density-gradient centrifugation at 2 000 r/min for 20 min. Then turbid fluid containing T cells was collected and subjected to another 10 mL Ficoll. After being washed twice with Hanks’ balanced salt solution and separated by density-gradient centrifugation at 1 500 r/min for 15 min, the isolated T cells were cultured in RPMI 1640 at 37 °C in a humidified atmosphere containing 50 mL/L CO2 in air. Through the detection by FCM with PE-labeled anti-CD3 mAb, the T cell purification was about 70%.
About 1×10⁶ HepG2/CD80 or HepG2/mock cells were collected separately for Co-60 radiation (100 Gy) and then cultured in RPMI 1640 at 37 °C in a humidified atmosphere containing 50 mL/L CO2 in air for further usage.
HepG2/CD80 or HepG2/mock cells were seeded onto 96-well plates with 200 µL/well. Each was divided into two groups, and three double wells were set for each group. Lymphocytes were added into each well according to E:T ratio of 1:10. The mixture of lymphocytes and tumor cells was cultured in RPMI 1640 at 37 °C in a humidified atmosphere containing 50 mL/L CO2 in air. After a 3-day culture, MTT solution was added to each well to the final concentration of 10 g/L and the cells were further incubated for 5 h. Then 100 µL of isopropylalcohol was added to dissolve the crystal after the supernatant was removed by centrifugation at 3 000 r/min for 5 min and the wells were washed thrice with PBS. Then the absorbance of solution of each well was measured at 570 nm by a microplate reader (Bio-Rad). All the measurements were separately performed in triplicate. PI was calculated using the formula: PI=(A570 nm of HepG2/hCD80–A570 nm of HepG2/mock well)/A570 nm of lymphocytes in each well.
HepG2/CD80 or HepG2/mock cells were seeded onto 24-well plates. Lymphocytes were added into each well according to E:T ratio of 1:10. The mixture of lymphocytes and tumor cells was cultured in RPMI 1640 at 37 °C in a humidified atmosphere containing 50 mL/L CO2 in air. After 2-, 5- and 7-day co-cultures, the lymphocytes, respectively, were stained with FITC-CD4 mAb, FITC-CD8 mAb, and FITC-CD25 mAb and incubated for 30 min, washed again with PBS. FCM was performed to detect the expressions of CD4, CD8, and CD25 on the surface of T cells.
The data was statistically analyzed by two-sided t-test, and P≤0.01 was considered statistically significant. Values were expressed as mean±SD.
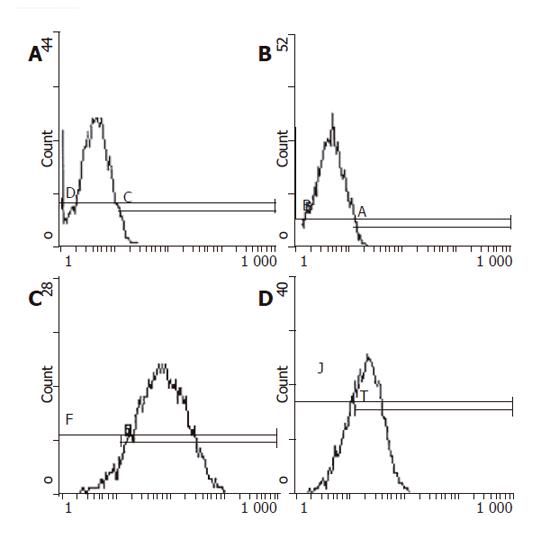
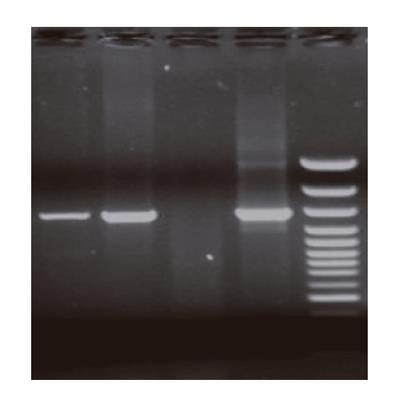
Retro virus vector pLNShB7 was transfected into HepG2 cells with the help of GP+envAm12 package cell. Drug resistant strains were selected by G418 to obtain doublephilic GP+envAm12/CD80 clones. FCM analysis showed that the expression of CD80 reached a rather high level (Figure 1). RT-PCR result further confirmed the expression of CD80 in the transfected cells at mRNA level (Figure 2).
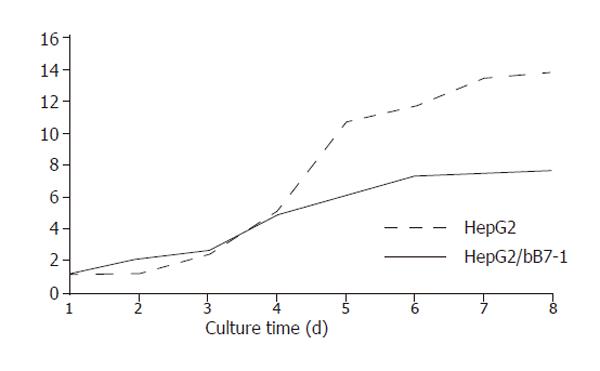
During 8 d of culture, the cells were counted each day for an average value. Curve of cell growth was drawn according to the results (Figure 3), which showed that the curve of HepG2/hCD80 cells was rising up very slowly, indicating that the growth ratio of HepG2/hCD80 cells was obviously lower compared to HepG2/mock cells. Multiple proliferation time of HepG2 cells was 13.86 h, while that of HepG2/hCD80 was 25.09 h.
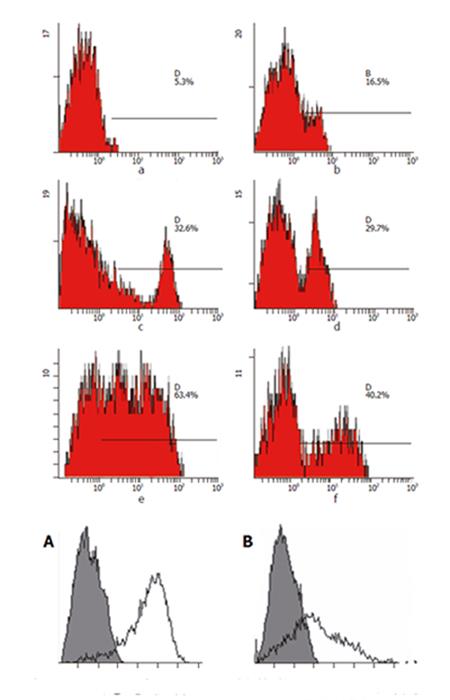
After Co-60 radiation, HepG2/mock or HepG2/hCD80 cells were mixed with lymphocytes and cultured together. FCM was used to detect surface molecular expression in T cells on days 2, 5, and 7. The results showed that CD4, CD8, and CD25 expressions were obviously higher in HepG2/hCD80 group than in HepG2/mock group on day 5 (Figure 4).
HepG2/CD80 or HepG2/mock cells were mixed with lymphocytes and cultured together as described above. After a 3-day co-culture, lymphocyte proliferation was examined by MTT. The results showed that PI of HepG2/hCD80 group (1.25±0.12) was obviously higher than that of HepG2 group (0.43±0.07, P<0.01).
Immune response of solid tumor is mainly cell immunity whose major effector cells are T lymphocytes. An optimal initiation of antigen-specific lymphocytes requires a combination of signals 1 and 2 (co-stimulatory signals). Hepatocarcinoma was regarded as a tumor of absent or low immunogenicity. Through testing different hepatocarcinoma cell lines, Tatsumi et al.[8] discovered that only high level MHC-II molecules were expressed on the surface of hepatocarcinoma cells, while the expression levels of CD80 and CD86 turned to be very low. Although mRNA of both CD80 and CD86 was detected, the concentration was very low. Using FCM, we also examined CD80 expression level on the surface of HepG2 cells, which showed that only a few HepG2 cells expressed CD80 molecule with a percentage of only 3.66%. Obvious differentiation was found compared with positive control group. RT-PCR showed that human CD80 mRNA was about 605-bp in length (Figure 2), which was consistent with that of FCM results. Taken together the present and previous studies, we speculated that absence of CD80 expression contributed to the low immunogenicity of HepG2 cells.
CD80, a glycoprotein of 44/45 ku, is mainly expressed on activated B lymphocytes, macrophages and dendritic cells as well as tissues of chronic infection and tumor cells[9]. Our experiment demonstrated that only a low level of CD80 expression was detected on the surface of HepG2 cells. Researches showed that some cytokines could upregulate CD80 expression on many kinds of cells. For example, IL-2 and IL-4 are able to enhance CD80 expression on B lymphocytes[2]. But, generally speaking CD80 expression, even under above stimulation, is yet relatively low and unable to stimulate effective anti-tumor immune response. Therefore, by means of highly effective CD80 gene transfection to enhance B7 molecule expression at gene level, signal 2 was regained so as to effectively trigger anti-tumor immune response.
To effectively transfect CD80 gene, a vector of high efficiency and fewer side effects is necessary. Retro virus vector, at present, is a vector most widely used in the study of gene therapy. With this kind of vector, IL-2, p53 and other therapeutic genes could be transferred with high efficiency into hepatocarcinoma cells[10]. So, we adopted retro virus as a carrier of CD80 gene. After selection by G418, FCM analysis showed that the positive ratio of HepG2/hCD80 group was about 92.2%, 28 times higher than the control group. Thus, a clone stably expressing CD80 molecule was established, host cell HepG2 regained the ability of transducting the second signal, which is necessary to trigger T cell immune response.
By CD80 transfection, we not only established positive clones highly expressing CD80 molecules but also found that the growth curve of HepG2/hCD80 cells was rising up very slowly with the growth ratio obviously lower than that of HepG2 cells. Multiple proliferation time of HepG2/hCD80 was markedly longer than that of HepG2 (P<0.01). So, CD80 transfection might change the status of tumor cells, while there is still a long way to go before clarifying its underlying molecular mechanisms.
T cell activation is crucial to immune response. After activation, a series of biochemical reactions occur, including signal transduction, gene activation and transcription, new molecule expression on cell surface, cytokine secretion and cells entering proliferation cycles[11]. Following activation, interaction between IL-2 and IL-2R plays an important role in T cell proliferation[12]. Absence of co-stimulatory signals might lead to T cell anergy, which could be explained by IL-2 decrease or no-response on IL-2 stimulation. On the surface of T cells, there are two IL-2 receptors, one is p55 (CD25) the other is p75 which has a relatively higher affinity, both have low affinity to IL-2[13]. Resting T cells just express p75 and not p55, so it could only be activated by highly concentrated IL-2[14]. A study showed that by the positive-feedback regulation of IL-2, CD25 could rapidly express and form complex with p75 to enhance the affinity of IL-2 and T cells[15]. In this way, biological effects could be fully exerted with low level of IL-2 stimulation. After CD80 transfection, our experiment showed that CD25 expression on T cell surface was greatly improved and was obviously higher compared to control group, which may be explained by cascade effects of immune system[16].
Enhancement of CD4 and CD8 expressions on T cell surface means the improvement of combined ability between TCR and MHC-I or MHC-II molecules[17]. Compared with HepG2 group, HepG2/hCD80 group showed markedly increased CD4 and CD8 molecules and actively proliferated T cells, suggesting that the malignant status of hepatocarcinoma cells might be changed and enhancement of co-stimulatory signal could effectively stimulate T cell activation so as to exert strong anti-tumor effects.
S- Editor Kumar M and Guo SY L- Editor Elsevier HK E- Editor Liu WF
| 1. | Zhang H, Haasch D, Idler KB, Okasinski GF. Isolation and promoter mapping of the gene encoding murine co-stimulatory factor B7-1. Gene. 1996;183:1-6. [RCA] [PubMed] [DOI] [Full Text] [Cited by in Crossref: 8] [Cited by in RCA: 8] [Article Influence: 0.3] [Reference Citation Analysis (0)] |
| 2. | Ranheim EA, Kipps TJ. Tumor necrosis factor-alpha facilitates induction of CD80 (B7-1) and CD54 on human B cells by activated T cells: complex regulation by IL-4, IL-10, and CD40L. Cell Immunol. 1995;161:226-235. [RCA] [PubMed] [DOI] [Full Text] [Cited by in Crossref: 61] [Cited by in RCA: 63] [Article Influence: 2.1] [Reference Citation Analysis (0)] |
| 3. | Chambers CA. The expanding world of co-stimulation: the two-signal model revisited. Trends Immunol. 2001;22:217-223. [RCA] [PubMed] [DOI] [Full Text] [Cited by in Crossref: 146] [Cited by in RCA: 139] [Article Influence: 5.8] [Reference Citation Analysis (0)] |
| 4. | Gause WC, Halvorson MJ, Lu P, Greenwald R, Linsley P, Urban JF, Finkelman FD. The function of costimulatory molecules and the development of IL-4-producing T cells. Immunol Today. 1997;18:115-120. [RCA] [PubMed] [DOI] [Full Text] [Cited by in Crossref: 57] [Cited by in RCA: 57] [Article Influence: 2.0] [Reference Citation Analysis (0)] |
| 5. | Gerstmayer B, Pessara U, Wels W. Construction and expression in the yeast Pichia pastoris of functionally active soluble forms of the human costimulatory molecules B7-1 and B7-2 and the B7 counter-receptor CTLA-4. FEBS Lett. 1997;407:63-68. [RCA] [PubMed] [DOI] [Full Text] [Cited by in Crossref: 19] [Cited by in RCA: 19] [Article Influence: 0.7] [Reference Citation Analysis (0)] |
| 6. | Yeh KY, Pulaski BA, Woods ML, McAdam AJ, Gaspari AA, Frelinger JG, Lord EM. B7-1 enhances natural killer cell-mediated cytotoxicity and inhibits tumor growth of a poorly immunogenic murine carcinoma. Cell Immunol. 1995;165:217-224. [RCA] [PubMed] [DOI] [Full Text] [Cited by in Crossref: 36] [Cited by in RCA: 38] [Article Influence: 1.3] [Reference Citation Analysis (0)] |
| 7. | Dessureault S, Gallinger S. Allogeneic lymphocyte responses to B7-1 expressing human cancer cell lines. J Surg Res. 1996;64:42-48. [RCA] [PubMed] [DOI] [Full Text] [Cited by in Crossref: 3] [Cited by in RCA: 4] [Article Influence: 0.1] [Reference Citation Analysis (0)] |
| 8. | Tatsumi T, Takehara T, Katayama K, Mochizuki K, Yamamoto M, Kanto T, Sasaki Y, Kasahara A, Hayashi N. Expression of costimulatory molecules B7-1 (CD80) and B7-2 (CD86) on human hepatocellular carcinoma. Hepatology. 1997;25:1108-1114. [RCA] [PubMed] [DOI] [Full Text] [Cited by in Crossref: 71] [Cited by in RCA: 73] [Article Influence: 2.6] [Reference Citation Analysis (0)] |
| 9. | Wang SD, Chen LP. Immune regulation of B7-CD28. Shanghai Mianyixue Zazhi. 2003;23:1-5. |
| 10. | Felzmann T, Ramsey WJ, Blaese RM. Anti-tumor immunity generated by tumor cells engineered to express B7-1 via retroviral or adenoviral gene transfer. Cancer Lett. 1999;135:1-10. [RCA] [PubMed] [DOI] [Full Text] [Cited by in Crossref: 6] [Cited by in RCA: 6] [Article Influence: 0.2] [Reference Citation Analysis (0)] |
| 11. | Xu P, Qian M. A new mechanism of T cell activation-synapse. Guowai Yixue Mianyixue Fence. 2001;24:225-227. |
| 12. | Chen Y, Yan MS, Wei Q. Calcieurin and NFAT in T cell activation. Guowai Yixue Mianyixue Fence. 1999;22:225-228. |
| 13. | Linsley PS, Brady W, Grosmaire L, Aruffo A, Damle NK, Ledbetter JA. Binding of the B cell activation antigen B7 to CD28 costimulates T cell proliferation and interleukin 2 mRNA accumulation. J Exp Med. 1991;173:721-730. [RCA] [PubMed] [DOI] [Full Text] [Full Text (PDF)] [Cited by in Crossref: 799] [Cited by in RCA: 916] [Article Influence: 26.9] [Reference Citation Analysis (0)] |
| 14. | Phillips JH, Takeshita T, Sugamura K, Lanier LL. Activation of natural killer cells via the p75 interleukin 2 receptor. J Exp Med. 1989;170:291-296. [RCA] [PubMed] [DOI] [Full Text] [Full Text (PDF)] [Cited by in Crossref: 75] [Cited by in RCA: 92] [Article Influence: 2.6] [Reference Citation Analysis (0)] |
| 15. | Schulz O, Sewell HF, Shakib F. Proteolytic cleavage of CD25, the alpha subunit of the human T cell interleukin 2 receptor, by Der p 1, a major mite allergen with cysteine protease activity. J Exp Med. 1998;187:271-275. [RCA] [PubMed] [DOI] [Full Text] [Full Text (PDF)] [Cited by in Crossref: 205] [Cited by in RCA: 208] [Article Influence: 7.7] [Reference Citation Analysis (0)] |
| 16. | Tanaka Y, Albelda SM, Horgan KJ, van Seventer GA, Shimizu Y, Newman W, Hallam J, Newman PJ, Buck CA, Shaw S. CD31 expressed on distinctive T cell subsets is a preferential amplifier of beta 1 integrin-mediated adhesion. J Exp Med. 1992;176:245-253. [RCA] [PubMed] [DOI] [Full Text] [Full Text (PDF)] [Cited by in Crossref: 265] [Cited by in RCA: 286] [Article Influence: 8.7] [Reference Citation Analysis (0)] |
| 17. | Rabinowitz R, Hadar R, Schlesinger M. The appearance of the CD4 CD8 phenotype on activated T cells: possible role of antigen transfer. Hum Immunol. 1997;55:1-10. [RCA] [PubMed] [DOI] [Full Text] [Cited by in Crossref: 13] [Cited by in RCA: 14] [Article Influence: 0.5] [Reference Citation Analysis (0)] |


