INTRODUCTION
Resistance of tumor cells toward induction of apoptosis is one of the main reasons for failure of anticancer treatment[1]. NF-κB is a ubiquitous transcription factor that is activated by a variety of cytokines and mitogens[2] and is thought to be a key regulator of genes involved in inflammation, response to infection, and stress. Classic NF-κB is a heterodimer of p50 (NF-κB-1) and p65 (Rel-A), but proteins that constitute the NF-κB family form a variety of homodimers and heterodimers[3]. NF-κB is retained in an inactive form in the cytoplasm through association with one of the IκB inhibitory proteins, including IκBα, IκBβ and IκBε[4]. After cellular stimulation, the phosphorylation, ubiquination, and subsequent proteolysis of IκBα in proteosomes enables NF-κB to translocate into the nucleus[5-8], where it regulates the transcription of NF-κB-response genes by interacting with κB binding sites[9,10]. Recently, abundant evidence has implicated cellular NF-κB transcription factors in the control of apoptosis in many systems. It has been suggested to be associated with increased survival in many tumor cells. A number of studies implicated NF-κB in apoptosis resistant tumor cells[11-16]. A superrepressor form of IκBα contains a serine-to-alanine mutation at amino acids 32 and 36, which inhibits signal-induced phosphorylation and subsequent proteosome-mediated degradation of IκBα. This IκB superrepressor has been used to demonstrate that inhibition of NF-κB induces apoptosis through a variety of cancer therapeutic agents and TNF-α[17,18]. Based on this, we have successfully cloned the IκBα gene and constructed the superrepressor IκBαM in Chinese. We have generated recombinant adenovirus AdIκBαM, which will provide a solid basis for the study of IκBα-mediated antitumor gene therapy. In the present study, we investigated whether the recombinant adenovirus induces the TNF-α-mediated apoptosis in the human hepatocarcinoma cell line (HepG2) and in vivo.
MATERIALS AND METHODS
Cell culture
HepG2 cells, Hela cells and 293 cells were maintained in RPMI 1640 medium with 10% fetal bovine serum, penicillin (100 mg/L), and streptomycin (100 mg/L).
Construction of recombinant adenovirus AdIκBαM
The full-length cDNA of IκBα superrepressor(IκBαM), whose serines 32, 36 were mutated into the alanine, was kindly provided by Dr Bing-Rong Liu (from our laboratory). The IκBαM was inserted into the adenoviral shuttle plasmid Track-CMV(a gift from Mr TC He, Molecular Oncology Laboratory, the University of Chicago Medical Center). It contains green fluorescent protein(GFP). We thus constructed the recombinant adenoviral plasmid pAdIκBαM. However, pAdIκBα did not have replacement of serines 32, 36 with alanines. Recombinant adenoviral plasmids were digested with PacI. Then, the digested recombinant adenoviral plasmid was transfected into 293 cells with FuGENETM 6 transfection reagent(Roche). Viral transfection products (AdIκBαM, AdIκBα) were monitored by GFP expression. The recombinant adenovirus was selected and purified using standard procedures[19]. To obtain a large quantity of recombinant adenovirus (AdIκBαM, AdIκBα), the 293 cells were infected and grown for 48 h at 37°C. The infected cells were harvested and centrifuged using a tabletop centrifuge at 1000 r/min for 5 min. The infected cells were resuspended in PBS. The cells were lysed by 4 freeze-thaw cycles to release the virus. The virus was purified through 1 CsCl gradient. The purified recombinant adenovirus was then titrated by the plaque assay[19], aliquoted, and stored at -70°C until use.
HepG2 cell analysis in BALB/c nude mice
All mice whose age was 4 wk, weighing between 15-18 g were provided by SLACCAS, China. Number of females was equal to males. Approximately 2 × 10⁵ HepG2 cells in 200 μL of PBS media were injected subcutaneously into the back of 40 BALB/c nude mice. All mice were maintained and handled under specific pathogen-free conditions at the Animal Center in Chongqing University of Medical Sciences. The tumors of 8 mice in each group were directly injected with 2 × 10⁹ plaque-forming units(PFU) of AdIκBαM. Eight mice were injected with 2 × 10⁹ pfu of AdIκBα. The third group of mice was injected with 2 × 10⁸ pfu of AdIκBαM and the fourth group with 2 × 10⁷ pfu of AdIκBαM. Groups of control mice were injected with phosphate buffered saline (PBS). All mice were injected 5 times in total, every other day, 100 μL each time. After the injection was finished, on the fourth day all mice were killed. The tumor growth curve was drawn. The volume of tumor was calculated according to the formula: Tumor volume = Length × Width2 × 0.4.
Hematoxylin and eosin staining
HE staining analysis was carried out for evaluation of cell necrosis and apoptosis. The percentage of cells under-going apoptosis was determined as the number of HE-positive cells in at least 10 randomly selected vision fields of sections obtained from tumors in each group of mice.
TUNEL analysis of HepG2 cell apoptosis in BALB/c nude mice
HepG2 cell apoptosis in BALB/c mice was determined using in situ apoptosis staining with the TUNEL staining kit according to the manufacturer’s instructions (Roche). Tissues from the mouse tumor were fixed in 4% buffered paraformaldehyde for 4 h and decalcified in 59 mmol/L EDTA, pH 7.8, for 3 wk. The tissue was then dehydrated with different concentrations of ethanol and xylene, and embedded in paraffin. Tissue specimens were cut into 8-μm sections and mounted onto glass slides. Slides were incubated with fresh proteinase K (20 mg/L)-streptavidin-labeled horseradish peroxidase (HRP) at room temperature for 10 min. The slides were covered with a cover glass and incubated at 37°C for 1 h in a humidified chamber. Nonspecific staining was blocked by incubating the slides with blocking buffer at room temperature for 30 min. The slides were incubated with a klenow labeling buffer in the presence of biotin-labeled dNTP for 1.5 h at 37°C. After washing 6 times with PBS, the slides were incubated with streptavidin-conjugated antibody at a 1:50 dilution in Tris buffer, pH 7.4 with PBS and developed by incubation with diaminobenzidine solution for 5 min. Cells undergoing apoptosis were identified by dark brown staining of the nuclei. For quantitative analysis of the percentage of apoptotic cells, a total of 10 random vision fields were evaluated.
Electron microscopy
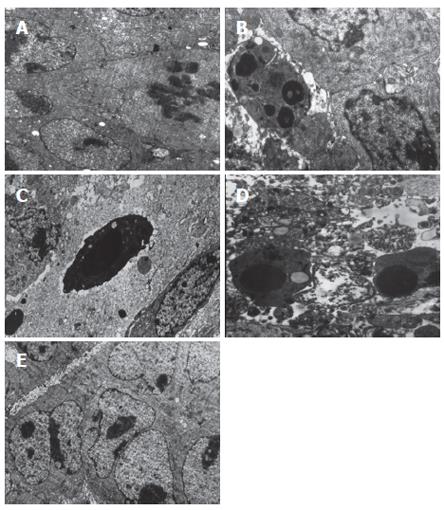
Electron microscope analysis was carried out for evaluation of cell necrosis and apoptosis.
Statistical analysis
Student’s t-test was used for testing the statistical significance of the differences between the groups. A P value of less than 0.05 was considered statistically significant.
RESULTS
Construction and analysis of recombinant adenovirus AdIκBαM
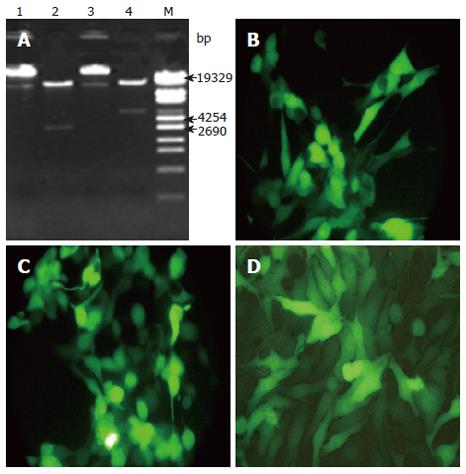
The recombinant adenovirus plasmids were generated by cloning the IκBαM/IκBα construct into adenoviral shuttle plasmid Track-CMV. The recombinant adenovirus plasmids were digested with PacI. The digested products were identified by 0.8% agarose gel electrophoresis (Figure 1A). pAdIκBαM was digested into 2 fragments: one was about 3 kb, the other probably 30 kb; pAdIκBα was digested into fragments of about 4.5 kb and 30 kb. The digested recombinant adenovirus plasmid was transfected into 293 cells. Two days after transfection, the fluorescence was observed (Figure 1B, C). The results showed that we have successfully cloned the IκBαM/IκBα gene into the plasmid Track-CMV, and the recombinant adenovirus AdIκBαM/AdIκBα was established. The virus was grown to a titer of 2 × 10¹² pfu/L by purification over a CsCl gradient. AdIκBαM could be expressed in HepG2 cells after infection for 48 h (Figure 1D).
Figure 1 M: DNA Marker; Lanes 1, 3: Recombinant adenoviral plasmids pAd-IκBαM/pAd-IκBα un-cleaved with PacI; Lanes 2, 4: Recombinant adenoviral plasmids pAd-IκBαM/pAd-IκBα cleaved with PacI.
A: Indentification of recombinant adenoviral plasmids by restriction analysis; B, C: The pAd-IκBαM/pAd-IκBα was transfected into 293 cells and GFP expression was observed by fluorescence microscopy after transfection for 36 h; B: pAd-IκBαM; C: pAd-IκBα (× 200). D: The recombinant adenovirus AdIκBαM infected into HepG2 and GFP expression was visualized by fluorescence microscopy after transfection for 48 h, (× 200).
Induction of apoptosis of HepG2 in BALB/c nude mice by AdIκBαM in vivo
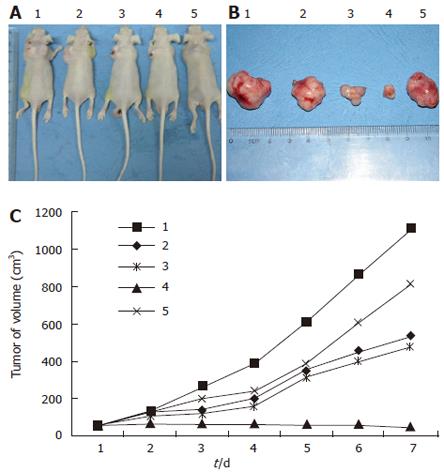
HepG2 cells (2 × 10⁵) were injected into the back of 40 BALB/c nude mice subcutaneously. After 2 wk, a tumor about 5 mm was observed in all mice. All mice were killed on the fourth day after a different treatment in the different groups (Figure 2A). The tumors from all mice were processed for histologic analysis (Figure 2B). Tumor volumes were calculated (Figure 2C). No effect was observed in mice injected with control PBS. In contrast, BALB/c nude mice treated with AdIκBαM (2 × 10¹² pfu/L) exhibited the most obvious inhibition of tumor growth, the tumor growth being stopped. Injection with AdIκBα (2 × 10¹² pfu/L) had a slight effect on tumor growth at first, which then diminished.
Figure 2 A: Mice were killed on the fourth day after different injections (1: Control PBS, 2: AdIκBαM 2 × 10¹⁰, 3: AdIκBαM 2 × 10¹¹, 4: AdIκBαM 2 × 10¹², 5: AdIκBα 2 × 10¹²); B: Tumors from mice were processed for histologic analysis.
The sequence of mice is according to that in A; C: The tumor growth curve. The sequence of mice is according to that in A, B.
HE staining and TUNEL analysis
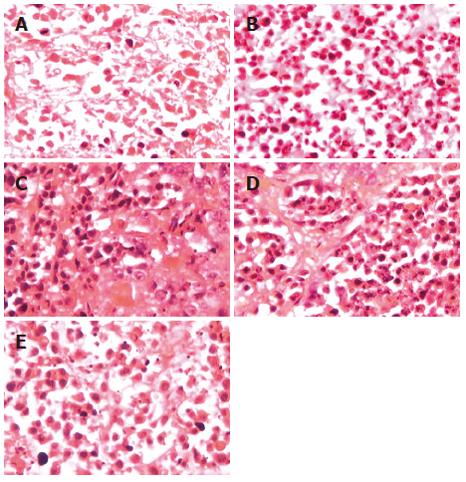
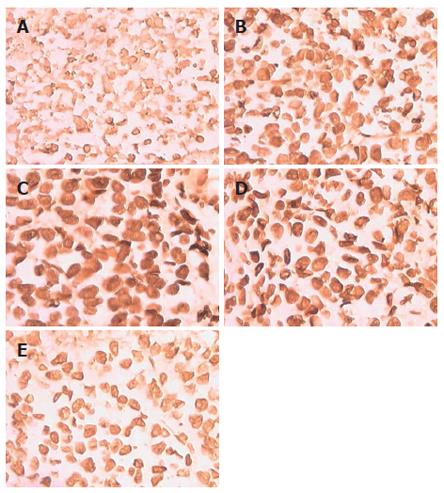
There was a difference in the incidence of cell destruction by HE staining, which was exhibited by almost all mice (Figure 3). BALB/c mice injected with AdIκBα demonstrated a slight effect. In contrast, BALB/c mice treated with AdIκBαM (2 × 10¹² pfu/L) exhibited extensive pyknotic nuclei and cell destruction. There were masses of cell necrosis in BALB/c mice injected with PBS, because ischemia in tumor resulted in cell necrosis. The number of apoptotic cells in the AdIκBαM (2 × 10¹²) group was 16.8 ± 3.1 (P < 0.01); in the AdIκBαM (2 × 10¹¹) group 13.1 ± 2.3 (P < 0.01); in the AdIκBαM (2 × 10¹⁰) group 10.1 ± 2.1 (P < 0.01); in the AdIκBα group 5.3 ± 1.8 (P > 0.05); in the PBS control group 3.8 ± 1.8 (P > 0.05). Moreover, to determine if AdIκBαM induced apoptosis in vivo, the tumor was sectioned and analyzed by in situ TUNEL staining (Figure 4). There was significant apoptosis of HepG2 cells infected with AdIκBαM (2 × 10¹² pfu/L) but not of HepG2 treated with control PBS and some apoptosis in HepG2 cells injected with AdIκBα. Furthermore, there was a direct correlation between AdIκBαM dosage and cell apoptosis. The number of apoptotic cells in the AdIκBαM (2 × 10¹²) group was 14.7 ± 2.4 (P < 0.01); in the AdIκBαM (2 × 10¹¹) group 12.4 ± 2.2 (P < 0.01); in the AdIκBαM (2 × 10¹⁰) group 8.3 ± 2.0 (P < 0.01); in the AdIκBα group 3.4 ± 1.6 (P > 0.05); in the PBS control group 4.2 ± 1.7 (P > 0.05).
Figure 3 Morphological changes of HepG2 cells from mice treated with different methods were analyzed by HE staining.
A: PBS control; B: AdIκBαM (2 × 10¹⁰); C: AdIκBαM (2 × 10¹¹); D: AdIκBαM (2 × 10¹²); E: AdIκBα (2 × 10¹²).
Figure 4 TUNEL was used to evaluate apoptosis of HepG2 cells in BALB/c mice.
A: PBS control; B: AdIκBαM (2 × 10¹⁰ pfu/L); C: AdIκBαM (2 × 10¹¹ pfu/L); D: AdIκBαM (2 × 10¹² pfu/L); E: AdIκBα (2 × 10¹² pfu/L).
Results of electron microscopy
Those cells with dark concentrated nuclei under EM were considered as apoptotic cells. In the AdIκBαM (2 × 10¹²) group, there were 1-2 apoptotic cells in a random vision field (× 4000-6000, Figure 5A). Necrotic tissue or cells were observed around the apoptotic cells, but no proliferative phase was found. In the AdIκBαM (2 × 10¹¹) group, there were 0-2 apoptotic cells in a random vision field (× 4000-6000, Figure 5B). In the AdIκBαM (2 × 10¹⁰) group, apoptotic cells could seldom be found (Figure 5C), whereas in the PBS control and AdIκBα group, there were few apoptotic cells, and many tumor cells were in the proliferative phase; however, necrotic tumor cells could also be found (Figures 5D, E). Necrotic tumor cells could be found in the AdIκBαM (2 × 10¹²) group, probably because AdIκBαM could induce the tumor cells to apoptosis, and then to necrosis. Necrotic tumor cells could be found in the PBS control group probably because the tumor developed too fast and the blood supply was inadequate. Because the results of electron microscopy are the most reliable evidence of apoptosis, we could speculate that recombinant adenovirus could induce apoptosis of human hepatocarcinoma and inhibit the tumor cell proliferation.
Figure 5 Electron microscopic analysis was used to evaluate apoptosis in HepG2 cells in mice.
A: PBS control (× 4000); B: AdIκBαM 2 × 10¹⁰ pfu/L (× 6000); C: AdIκBαM 2 × 10¹¹ pfu/L (6000 ×); D: AdIκBαM 2 × 10¹² pfu/L (× 6000); E: AdIκBα 2 × 10¹² pfu/L (× 4000).
DISCUSSION
TNF-α is an important cytokine in the promotion of growth and invasion of cells. It interacts with TNFRIand TNFR II. Signaling through both TNFRI and TNFRII can induce apoptosis[20-22]. Interactions with TNFRIproduce a proapoptotic signal by recruitment of TNFR I-associated death domain (TRADD) protein to the death-inducing signaling complex (DISC) of the TNFRItimer[23,24]. TRADD recruits the Fas-associated death domain (FADD), which in turn, recruits caspase 8 and signals apoptosis[25]. Simultaneously, an anti-apoptosis pathway involves recruitment of cellular LAP (cLAP), receptor interactive peptide (RIP), and TNFR-associated factor 2 (TNFR2), which leads to activation of NF-κB-inducing kinase (NIK) [26]. This results in phosphorylation of IκBα and IκBβ and translocation of NF-κB to the nucleus. This second signal predominates in hepatocarcinoma, and NF-κB translocation to the nucleus plays a role in transcription of several genes, including TNF-α, interleukin-1β, and IL-6, as well as collagenase, stromelysin, and adhesion molecules[27,28]. At the same time, NF-κB translocation inhibits apoptosis in many cell types, including tumor cell lines. HepG2 cell line, like other cell lines, does not undergo apoptosis in response to TNF-α. Therefore, we propose that TNF-α acts as a growth factor in the HepG2 cell line, as well as induces production of cytokines and invasive enzymes. Taken together, it implies that NF-κB may play a role in preventing maximal apoptotic killing in treatment regimens such as TNF, radiation therapy, and certain chemotherapeutic agents. Resistance to anticancer therapies appears to be mediated by resistance to apoptosis. Therefore, modulation of NF-κB activity could potentially lead to improved cell killing in the HepG2 cell line and in vivo. Based on this understanding, we have successfully constructed the superrepressor of NF-κB (AdIκBαM), in which 32, 36 serines were replaced with alanines and could not be phosphorylated by NIK.
The studies by Duffey et al[29] demonstrated that human head and neck squamous carcinoma cell transfected with IκBαM was significantly restrained. The results of our study with AdIκBαM showed that the HepG2 cell line could be sufficiently infected with this recombinant adenovirus. Furthermore, IκBαM could be expressed stably in HepG2 cells. This was especially prominent with induction by TNF-α. Overexpression of mutated IκBα by an AdIκBαM construct resulted in inhibition of nuclear translocation of NF-κB after TNF-α stimulation of HepG2 cells. Under these conditions, the HepG2 cell underwent extensive apoptosis in response to TNF-α in vitro. There was distinct apoptosis in HepG2 cells treated alone with AdIκBαM and little apoptosis treated with AdIκBα and no apoptosis treated with PBS. This indicated that AdIκBαM could facilitate or induce apoptosis in HepG2 cells in vitro. There are histocyte cells and T cells in BALB/c nude mice, and the BALB/c mice may contain TNF-α in vivo. In light of the results of the experiment in vitro, we did not use TNF-α in vivo. BALB/c mice treated with AdIκBαM (2 × 10¹² pfu/L) exhibited the most extensive inhibition of tumor growth. In contrast, no effect was observed in mice injected with PBS and a slight effect in mice treated with AdIκBα. Mice treated with AdIκBαM (2 × 10¹² pfu/L) underwent extensive apoptosis in vivo. However, there was little apoptosis in mice treated with AdIκBα (2 × 10¹² pfu/L). In this study, we focused particularly on the suppression of tumor growth and the induction of cell apoptosis by the recombinant adenovirus. Although various degrees of necrosis could be observed by HE staining, more work should be done on whether the recombinant adenovirus could lead to tumor death through inducing the damage of tumor blood vessels. Meanwhile, we should pay more attention to the toxicity of recombinant adenovirus, the first-pass effect of liver, the antigenicity and the targeting of recombinant adenovirus.
In conclusion, the AdIκBαM is expressed in HepG2 cell effectively and stably. It could inhibit the activity of NFκB, and cause increased apoptosis as well as suppression of liver tumor.


