Published online Oct 14, 2005. doi: 10.3748/wjg.v11.i38.5938
Revised: August 1, 2004
Accepted: August 5, 2004
Published online: October 14, 2005
AIM: To study the anti-hepatoma efficiency of arsenic trioxide (As2O3) in the treatment of experimental rat hepatocellular carcinoma (HCC) induced by 2-acetamidofluorene (2-FAA) and to elucidate the possible mechanisms.
METHODS: SD rats (2 mo old) had been fed with 2-FAA for 8 wk to induce HCC, and then they were treated with As2O3 or matrine. On d 29, the rats were killed and the liver was weighed and liver tumors were counted. The histological changes of liver tissue were observed under microscope, and the cellular dynamic parameters were studied by flow cytometry. Immunohistochemistry (two-step method) was used to observe the expression of vascular endothelial growth factor (VEGF) and micro-vessel density (MVD) on consecutive sections. The pathological parameters were also analyzed, the levels of serum aspartate aminotransferase (AST), alanine aminotransferase (ALT), total bilirubin (TBi), and direct bilirubin (DBi).
RESULTS: The number of liver tumors decreased significantly in groups treated with As2O3, especially in medium-dose (1 mg/kg) group (t = 2.80, P<0.01). As2O3 caused HCC cell death via apoptosis; necrosis was seen and apoptosis was common when the dose was 1 mg/kg. Proliferation index decreased sharply in medium-dose (1 mg/kg) group (7.87±4.11 vs 24.46±6.49, t = 2087, P<0.01), but not in 0.2 mg/kg group. However, S-phase fraction decreased dramatically in both groups, it reached the bottom level only when the dose was 1 mg/kg compared with control (0.40±0.13 vs 3.01±0.51, t = 2.97, P<0.01), and it was obviously accompanied with accumulation of cells in G0/G1 (G0/G1 restriction). The expressions of VEGF and MVD in medium-dose (1 mg/kg) group were significantly lower than normal saline group (0.63±0.74 vs 2.44±0.88, P<0.05; 15.75±3.99 vs 47.44±13.41, t = 2.80, P<0.01). Compared with normal saline group, medium- and low-dose groups As2O3 and matrine lowered the levels of ALT in serum (61.46±9.46, 63.75±20.40, 61.18±13.00 vs 108.98±29.86, t = 2.14, P<0.05), but had no effect on the level of serum AST, TBi, and DBi.
CONCLUSION: As2O3 had inhibitory effect on growth of experimental HCC in rats induced by 2-FAA, but had no obvious effect on normal hepatic cells. The mechanisms may involve decrease of cell division, accumulation of cells in G0/G1 phase, apoptosis of tumor cells, and inhibitory effect on angiogenesis through blocking VEGF.
- Citation: Tan B, Huang JF, Wei Q, Zhang H, Ni RZ. Anti-hepatoma effect of arsenic trioxide on experimental liver cancer induced by 2-acetamidofluorene in rats. World J Gastroenterol 2005; 11(38): 5938-5943
- URL: https://www.wjgnet.com/1007-9327/full/v11/i38/5938.htm
- DOI: https://dx.doi.org/10.3748/wjg.v11.i38.5938
Hepatocellular carcinoma (HCC), with the highest malignancy and worst prognosis, is a common digestive tumor[1]. In recent years, there have been many clinical drugs for the therapy of HCC patients who cannot tolerate operation, such as tamoxifen[2], flutamide[3], lipiodol for embolism[4], but the results were so far unsatisfactory. Arsenic trioxide (As2O3) has been extensively used for many malignant leukemia tumors and was proved to be effective[5]. Zhang found As2O3 inhibited growth of experimental HCC by inducing apoptosis of tumor cells[6]. Si applied matrine for late HCCs and noticed growth inhibition and apoptosis of malignant cells[7]. To elucidate the antineoplastic mechanisms of As2O3, we treated experimental HCC in rats induced by 2-acetamidofluorene (2-FAA) with As2O3, counted liver tumors, examined liver histological changes under microscope, examined expression of vascular endothelial growth factor (VEGF) and micro-vessel density (MVD) of tumor with immunohistochemistry, studied cellular dynamic parameters by flow cytometry, and also investigated the levels of serum aspartate aminotransferase (AST), alanine aminotransferase (ALT), total bilirubin (TBi), and direct bilirubin (DBi).
Seventy SD rats from blocked population, about 2-mo old, weighing 140-180 g (supplied by the Experimental Animal Center of Nantong Medical College), were fed with granules mixed by 0.05% (w/w) carcinogen 2-FAA (from Sigma Company, USA), and kept in constant environment (20 °C, moisture content 50%). During the 3rd-5th wk, some rats died; 4 wk later some visible gray nodes appeared on the liver surface of the dead by autopsy. Moreover, the number and size of these nodes had an increasing tendency. At the end of the 8th wk, 34 rats were still alive, and they were then fed with normal granules.
Grouping of animals Thirty-four HCC rats were divided randomly into four groups: two groups were injected intraperitoneally with As2O3 (produced by Haerbing Yida Pharma AG), diluted with four volumes of normal saline before injection, including medium-dose (1 mg/kg per d) and small-dose (0.2 mg/kg per d) groups; the third group was injected with matrine (4.2 g/kg per d) in the same way; the last was injected with normal saline (1.5 mL/kg per d) similarly. Treatment effects in all groups were observed: group A (with medium-dose As2O3 for 4 wk, n = 8); group B (with small-dose for 4 wk, n = 9); group C (with matrine for 8 wk, n = 8); group D (with saline for 4 wk, n = 9). During the experiment, we weighed the rats and then adjusted the dosage each week.
Sampling of liver and serum specimens At the end of the treatment, 34 rats were killed under diethyl ether anesthesia. Blood (4-5 mL) was drawn from heart and serum sample was collected after blood clotting and stored at 20 °C until assay. Whole liver was taken out and weighed immediately after rats were killed. After recording the distribution, size, and number of neoplastic nodes on the liver surface, we fixed part of liver tissue in 10% neutral formaldehyde for pathological examination.
Histopathologic and immunohistochemical examination Formaldehyde-fixed liver tissue was embedded in paraffin, cut into 4-mm-thick sections, some were stained with routine hematoxylin and eosin (HE) to observe liver neoplasia and morphological apoptosis under microscope; the others were examined with the immunohistochemical method. Polyclonal antibodies of VEGF and FVIIIRAg were obtained from the Beijing Zhongshan Biotechnology Company Limited. The two-step staining method consisted of the following main procedures: paraffin section was dewaxed and hydrated; tissue antigens were retrieved with microwave; the first antigen was dropped on tissue section, subsequently, which was incubated in a wet box at 37 °C for 1 h. After addition of envision reagent, these sections were put into a wet box again at room temperature for 30 min. Between the above-mentioned steps, tissue sheets were washed thrice in Tris-buffered saline (TBS, 0.01 mol/L, pH 7.4). After that, these tissue samples were colored with dolichos bifows agglutinin, cellular nuclei were redyed with hematoxylin and then sealed. In the negative control group, TBS was used as the first antibody, while the positive controls were from confirmed positive tissue specimens.
Buffy granules in cytoplasm were indicative of positive VEGF expression. According to Wang's standards[8], the median percentage of VEGF-positive-stained cells in 10 high power fields (200×)was counted. These medians were divided into five classes: less than 10% was negative (-); equivalent to or more than 10% was positive: 10-25% was +, 26-50% was ++, 51-75% was +++, and 76% or above were ++++. The five classes were respectively graded as 0-4.
MVD count was in accordance with Weidner's method (ref no.). First under low power microscope, the most intensive micro-vessel area in tumor tissues was identified, and then counted under high power (400×). Any buffy-stained endothelial cell or cell tuft, as well as any structure-unconnected micro-vessel branch, which was distinct from the surrounding tumor cells and connective tissues, was regarded as one "micro-vessel" excluding those vessels with muscular layers or a cavity with more than eight RBCs. The average of three counts was MVD of a liver tissue sample, which was checked by two pathological doctors with double-blind method.
Flow cytometric study Single-cell suspension, about 0.2 g, was prepared from fresh liver neoplasm tissue, first washed twice in PBS, cut into fragments with a clipper, and then filtered twice through a 35-mm-pore nylon filter. Cell count ranged from 3×10⁵ to 10×105cells/mL per sample. The suspension was spun by centrifugation at the rate of 1 000 r/min for 5 min, and washed in PBS twice. The obtained pellet was fixed by 70% cold ethanol, and then stored at -20‰ for 12-18 h. After being spun and washed again as previously described, the fixed single-cell suspension was pipetted into 0.01% RNase solution (Becton Dickinson Corporation) 200 μL, vortex-mixed and incubated continuously at 4°C for 30 min, stained with 50μg¸/mL propidium iodide 200μL (Becton Dickinson Corporation), and then placed in the dark at 4 °C for 10 min. The sample was analyzed from 30 min to 3 h after addition of propidium iodide. Flow cytometric analysis was performed with an FACS Caliber flow cytometer (Becton Dickinson Corporation), which was equipped with a 5 W argon-ion laser. The fluorescence intensity of propidium iodide-stained nuclei, excited by blue laser light (488 nm) with 200 mW of light-regulated power, was quantified after filtering through a 457-502 nm nylon blocking filter. Percent coefficient of variation (%CV) was adjusted to less than 4% with glutaral-fixed chicken erythrocyte nuclei (CEN). Two-micron beads function to verify instrument alignment. The modifier for color compensation was corrected with a fluorescence microsphere. A minimum of 1×10⁴ stained nuclei was examined through the flow cytometer, and the data were saved in a computer. DNA data were acquired using CELLQuest, and analyzed with ModFit LTTM. Normal peripheral blood lymphocytes and normal SD rat liver cells were used as the control samples to identify the staining efficiency of propidium iodide and the channel of diploid cells (G0/G1 phase cells). With the G0/G1 peak of CEN as an internal standard, both G0/G1 and G2/M peaks of analyzed samples were determined, and then the DNA quantity was calculated. Cell cycle percentages were derived from DNA histograms. The peak of hypodiploid, anterior to the G0/G1 peak, was the apoptosis peak. Proliferative index (PI) was equal to the sum percentage of S-phase and G2/M-phase nuclei to all; the S-phase fraction (SPF) was determined and calculated with the area under the curve between G0/G1 and G2/M peaks.
Serum enzyme determination Serum AST, ALT, TBi, and DBi total activity were measured by the direct method of nitrobenzenamine.
Experimental data were shown as mean±D. Student's t-test, and rank sum test were performed to assess potentially significant differences between individual groups, with STATA 7.0 statistical analysis software. A P value of <5% was regarded as significant when comparing various groups.
During the 1st wk, several As2O3-administrated SD rats had a short-term sinus tachycardia, which self-recovered after 1 or 2 d. Skin induration could be avoided if injection sites were changed daily. Whether by As2O3 or matrine treatment, there was no significant difference between the treatment group and the control, in terms of body weight gain and the weight ratio of liver to body (Table 1).
| Groups | Body weight | Body weight | Liver weight | Liver weight/body weight |
| A | 272.25±35.51 | 74.25±20.71 | 12.475±1.9 | 3.49±0.40 |
| B | 247.56±63.94 | 58.44±16.99 | 13.11±3.15 | 4.42±0.60 |
| C | 253.00±28.63 | 58.25±24.01 | 12.54±1.132 | 4.08±0.50 |
| D | 258.22±49.99 | 40.44±40.15 | 11.89±1.59 | 4.24±1.00 |
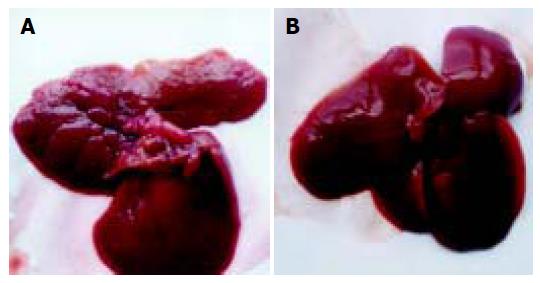
Morphological changes In contrast to the normal, HCC rat liver was gray, and hard, both volume and weight increased; slight hemorrhage and necrosis could be found on liver cross section; multiple nodes were distributed unevenly on liver surface, mostly 1-6 mm in diameters, one 9 mm-diameter node was found in the control group; the nodes were widespread on part of liver lobes, more evidently in the saline group; bulky tumor nodes appeared more frequently in the control groups. On the contrary, less node-widespread liver lobes and smaller tumor nodes were found in As2O3-treated rats (Table 2).
| Groups | n | 2-4 mm diameter nodes | 2-4 mm diameter nodes | Liver lobes with diffuse |
| A | 8 | 0 (0) | 1 (0.125) | 0 (0) |
| B | 9 | 50 (5.56) | 9 (1) | 17.5 (1.94) |
| C | 8 | 137 (15.22) | 13 (1.44) | 29 (3.22) |
| D | 9 | 223 (24.778) | 49 (5.444) | 39 (4.333) |
At the end of 4-wk treatment, five rats in group A and three rats in group B had no visible liver tumor nodes; while in the control group, all rats had widespread nodes on liver lobes and only one had sparsely distributed nodes on liver lobes (Figures 1A and B). Visible neoplastic nodes and node-widespread liver lobes in group A were less than those in groups B (P<0.05) and C (P<0.01), there was no significant difference between groups B and C.
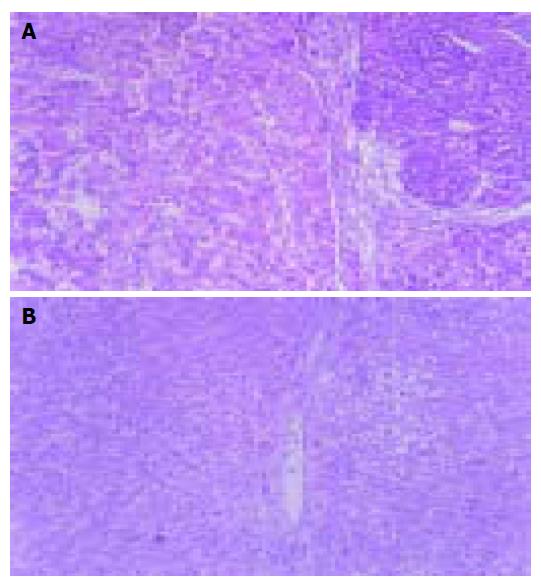
Pathological examination Under microscope, all 2-FAA-induced HCC rat liver tissues had hepatic cell degeneration, oval cell proliferation, and inflammatory cell infiltration. There were more extensive infiltrations of inflammatory cells in control groups. Whereas in group A, these pathological changes were comparatively slight: there were fewer infiltrating inflammatory cells, more regenerated nodes, partly abnormal differentiated cells, and fewer carcinoma nodes (Figure 2A). There were more apoptotic cells in As2O3-treated tumor tissues, which were shrunk and separated from other surrounding cells, round or oval in shape, and had complete cellular membrane; chromatin of apoptotic cells was condensed, edge-gathered or broken, and formed into intra-cellular nucleosomes of different sizes; acidophilia of shrunk cytoplasm was raised; no infiltrating inflammatory cells were seen near apoptotic cells (Figure 2B).
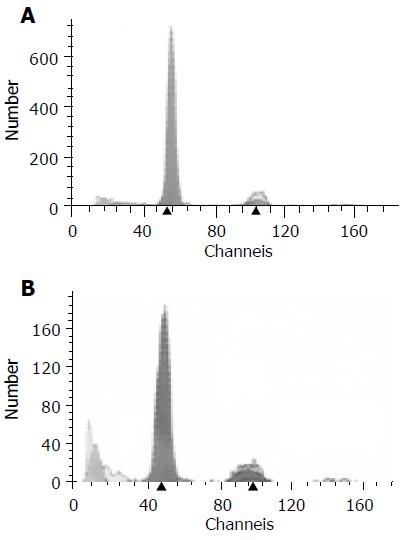
Distribution of cell cycle phases The mean percentages of SPF, G2/M phase, and PI of the 4-wk As2O3 group were less than those of the control (P<0.05), while G0/G1 phase mean ratio increased insignificantly (P>0.05, Table 3, Figures 3A and B).
The apoptotic rate in liver tumor tissues By means of DNA content assay, an obvious hypodiploid peak, before the G0/G1 peak, was called the apoptotic peak (Figures 3A and B). There was a significant increase in the apoptotic rate of the 4-wk As2O3-treated group compared with that of the control (P<0.01).
Levels of serum enzymes Compared with the control, serum ALT level of the 4-wk-treated groups was decreased (P<0.05), while AST, TBi, and DBi activity differed insignificantly (P>0.05, Table 4).
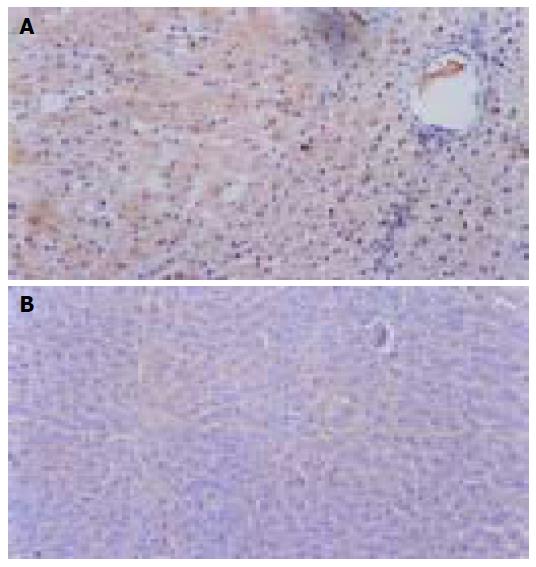
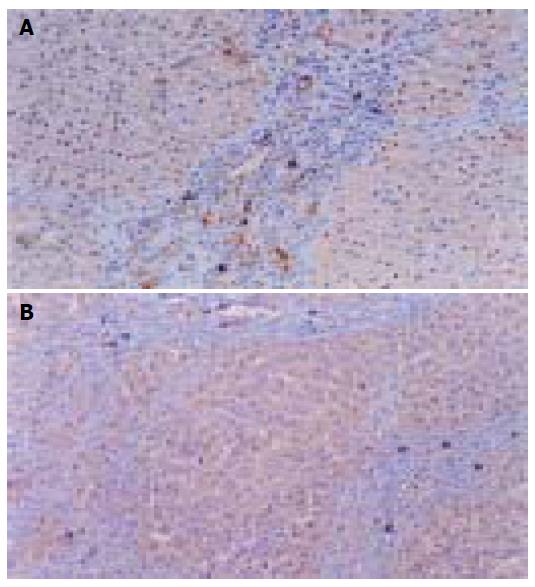
Immunohistochemical staining results Widespread brown cytoplasmic granules were VEGF positive, chiefly distributed inside tumor tissues and near the vessel endothelial cells (Figure 4A). In group A, more rats showed + to ++ degree VEGF signals, while four of eight rats were VEGF negative; in the control groups, more signals were from ++ to +++, with no negative expression (Figure 4B). There was a weakened intensity of VEGF in group A rats in comparison with the control and C groups (P<0.05, Table 5), but the difference was insignificant in all treatment groups (P>0.05), except for group A.
Vessel endothelial cells of tumor tissues, exhibited by FVIIIAg staining, formed into irregular micro-vessels, in the shapes of cluster and germination, which distributed unevenly, more intensively at the edge of tumor tissues (Figure 5A). As2O3 administration obviously inhibited neovascularization of liver tumor (Table 5, Figure 5B).
The antineoplastic mechanisms of As2O3 are not yet clear. There are probably five major pathways: (1) inducing apoptosis of tumor cells[6,9-11]; (2) restraining the metastasis of HCC[12]; (3) effecting immunity of liver tumor cells[13]; (4) inhibiting angiogenesis through blocking VEGF; (5) having synergistic anti-hepatoma effect combined with chemical drugs.
PI and SPF often indicate the proliferation of tumor cells. In our study, the distribution of cell cycle phases showed cell proliferation tended to be inhibited after 4-wk of As2O3 administration. SPF, G2/M phase, and PI all decreased (P<0.05), whereas G0/G1 phase increased insignificantly. More cells were blocked in G0/G1 phase. It is implied that As2O3 is able to prevent cells transisting from G0/G1 phase to S-phase, inhibiting the growth of tumor cells. In addition, apoptosis of tumor cells promoted by As2O3 occurred mainly at 1 mg/kg dose. PI decreased sharply in medium-dose (1 mg/kg) group (P<0.01), but not in the other (0.2 mg/kg) group (P>0.05). However, SPF decreased dramatically in both groups, suggesting 0.2 mg/kg dose also apparently inhibited synthesizing of DNA of tumor cells, but it was weaker. Therefore, antineoplastic mechanisms of As2O3 for HCC may involve the following two ways: inhibition of proliferation and induction of apoptosis of tumor cells.
In recent years, much importance has been attached to the relationship between angiogenesis and neoplasm. It has been confirmed that, solid carcinoma, once its diameter is over 2 mm, has to depend on neovascularization for its growth. It is through the blood vessel network that sufficient oxygen and nutrition are transported to meet the needs of high metabolism and fast proliferation of tumor cells. To some extent, the ability of inducing angiogenesis reflects tumor biological behaviors[14].
Various vessel growth factors act as the media to neovascularization, and VEGF is one of the most important one. Flt-1 and KDR/Flk-1, two receptors of VEGF, only exist in vessel endothelial cells, so VEGF promotes the proliferation of endothelial cells with a high specificity. VEGF can obviously improve the vessel permeability, which play an important role in tumor infiltration and metastasis[14,15]. It is necessary to find an objective and accurate indicator for the neovascularization. Thus, MVD count, which is for this purpose, has become a hot spot. In our study, VEGF and MVD were chosen to reflect the activity of tumor neovascularization. Our experiment showed that inhibitive effect ofAs2O3 on the angiogenesis was through inhibition of VEGF.
Morphological improvement by As2O3 in HCC rats could also be explained with its effects on cytokinetics. The number and distribution of liver tumor nodes decreased significantly in the As2O3 -treated than in the controls, especially in medium-dose (1 mg/kg) group (P<0.01). As2O3 also lowered VEGF expression and MVD count in rat liver tumor tissues.
Compared with normal saline group, administration of As2O3 or matrine lowered the levels of AST in serum (P<0.05), but had no effect on the amount of serum AST, TBi, and DBi (P>0.05), indicating As2O3 has no obvious effect on normal hepatic cells.
In summary, through effective inhibition of proliferation, inducement of apoptosis, and restrain of neovascularization of tumor,As2O3 can serve as a new alternative for HCC treatment without serious adverse effects.
Science Editor Zhu LH and Guo SY Language Editor Elsevier HK
Co-first-authors: Bing Tan
| 1. | Lee JH, Ku JL, Park YJ, Lee KU, Kim WH, Park JG. Establishment and characterization of four human hepatocellular carcinoma cell lines containing hepatitis B virus DNA. World J Gastroenterol. 1999;5:289-295. [PubMed] |
| 2. | Manesis EK, Giannoulis G, Zoumboulis P, Vafiadou I, Hadziyannis SJ. Treatment of hepatocellular carcinoma with combined suppression and inhibition of sex hormones: a randomized, controlled trial. Hepatology. 1995;21:1535-1542. [PubMed] |
| 3. | Chao Y, Chan WK, Huang YS, Teng HC, Wang SS, Lui WY, Whang-Peng J, Lee SD. Phase II study of flutamide in the treatment of hepatocellular carcinoma. Cancer. 1996;77:635-639. [RCA] [PubMed] [DOI] [Full Text] [Cited by in RCA: 1] [Reference Citation Analysis (0)] |
| 4. | Ram AM, Bhattacharya S, Novell JR, Dick R, Winslet MC, Hobbs KEF. Intra-arterial radiotherapy with 131 iodinelipiodol for irresectable hepatocellular carcinoma. Gut. 1996;38:A17. |
| 5. | Dai J, Weinberg RS, Waxman S, Jing Y. Malignant cells can be sensitized to undergo growth inhibition and apoptosis by arsenic trioxide through modulation of the glutathione redox system. Blood. 1999;93:268-277. [PubMed] |
| 6. | Hang C, Wang SS, Qi QH. The morphplogical and cellular dynamic changes in Arsenic Trioxide-treated rat liver c ancer. Zhongliu. 2001;21:101-105. |
| 7. | Si WK, Zhang GY, Ma WK, Kang GF. Effect of Matrine on the prolideration of HepG2 cell line. Disan Junyi Daxue Xueba. 2000;22:451. |
| 8. | Wang Y, Yang SQ, Wang ZG, Tang S, Sun WG, Liu GZ. Expressive meaning of ras p21, C-erbB-2 and P16 protein in Hepatocellular carcinoma. Shijie Huaren Xiaohua Zazhi. 1999;7:808-809. |
| 9. | Shen ZY, Shen J, Cai WJ, Hong C, Zheng MH. The alteration of mitochondria is an early event of arsenic trioxide induced apoptosis in esophageal carcinoma cells. Int J Mol Med. 2000;5:155-158. [RCA] [PubMed] [DOI] [Full Text] [Cited by in Crossref: 13] [Cited by in RCA: 27] [Article Influence: 1.1] [Reference Citation Analysis (0)] |
| 10. | Liu LX, Jiang HC, Zhuan AL, Zhou J, Wang XQ, Wu W. Arsenic trioxide induces apoptosis in hepatocellular carcinoma cells and to elucidate the possible mechanism. Zhonghua Yixue Zazhi. 2001;18:1526-1527. |
| 11. | Chen GQ, Zhu J, Shi XG, Ni JH, Zhong HJ, Si GY, Jin XL, Tang W, Li XS, Xong SM. In vitro studies on cellular and molecular mechanisms of arsenic trioxide (As2O3) in the treatment of acute promyelocytic leukemia: As2O3 induces NB4 cell apoptosis with downregulation of Bcl-2 expression and modulation of PML-RAR alpha/PML proteins. Blood. 1996;88:1052-1061. [PubMed] |
| 12. | Liu TF, Cheng BL, Guan YG, Liang T. Study on relationship between expressions of CD44 and inhibition effect of arsenic trioxide on carcinoma. Haerbing Yikedaxue Xuebao. 2001;35:111-112. |
| 13. | Tang YH, Liu TF. Effect of arsenic trioxide on the Immuni of H22 hepatocarcinoma rats. Zhonghua Weishengwuxue He Mianyixue Zazhi. 2001;21:63. |
| 14. | Kong HL, Crystal RG. Gene therapy strategies for tumor antiangiogenesis. J Natl Cancer Inst. 1998;90:273-286. [RCA] [PubMed] [DOI] [Full Text] [Cited by in Crossref: 116] [Cited by in RCA: 112] [Article Influence: 4.1] [Reference Citation Analysis (0)] |
| 15. | Ng IO, Poon RT, Lee JM, Fan ST, Ng M, Tso WK. Microvessel density, vascular endothelial growth factor and its receptors Flt-1 and Flk-1/KDR in hepatocellular carcinoma. Am J Clin Pathol. 2001;116:838-845. [RCA] [PubMed] [DOI] [Full Text] [Cited by in Crossref: 124] [Cited by in RCA: 127] [Article Influence: 5.3] [Reference Citation Analysis (0)] |


