INTRODUCTION
Conjugated linoleic acid (CLA) is a mixture of positional and geometric isomers of octadecadienoic acid found naturally in beef, cheese, and butter fat. During the past few years, CLA has attracted considerable attention as one of the most promising cancer chemopreventive agents[1]. Previously, we have shown that dietary CLA inhibited colon tumor incidence in rats treated with 1,2-dimethylhydrazine[2,3]. In addition to animal studies, in vitro studies have shown that CLA inhibits the growth of human colon cancer cells, SW 480[4] and HT-29 cells[5-7]. In contrast to these observations, other studies reported results that dietary treatment with CLA had no effect on tumor number or size in the APCmin/+ mouse, a genetic model of intestinal tumorigenesis[8]. Most of the experimental and in vitro studies on CLA have utilized synthetic CLA mixtures containing the two principal isomers, cis-9,trans-11 CLA (c9t11) and trans-10,cis-12 CLA (t10c12)[9]. Recently, Rajakangas et al[10], reported that t10c12 increased the size of adenoma in the distal part of the small intestine in the multiple intestinal neoplasia (Min) mouse model. The reason for these conflicting results can be resolved, if we understand the mechanisms by which CLA regulates colon cancer cell growth.
The ErbB family of receptor tyrosine kinases currently includes four members: epidermal growth factor receptor (EGFR)/ErbB1, ErbB2, ErbB3, and ErbB4. Polypeptides in the EGF family individually bind to and activate one or more ErbB family members[11,12]. Ligand-induced receptor homo- and hetero-dimerization stimulates ErbB receptor activation and subsequent transphosphorylation between the dimerization partners[13] Although ErbB3 is devoid of intrinsic kinase activity[14], heregulin (HRG) binds to ErbB3 and facilitates the formation of heterodimers with ErbB2, the most mitogenic family member[15,16].
The activated ErbB family receptors interact with diverse signaling pathways that ultimately may lead to cell division, differentiation, and chemotaxis. Two representative intracellular effectors of ErbB2/ErbB3 HRG coreceptor complex are mitogen-activated protein (MAP) kinase and phosphoinositide 3-kinase (PI3K). ErbB3, which incorporates multiple PI3K binding sites, has been shown to be a major recruiter of PI3K. PI3Ks phosphorylate inositol phospholipids at position 3 of the inositol ring and PI3K lipid products interact with certain proteins and modulate their localization and/or activity[17]. Protein kinase B (PKB) or Akt is known as an important downstream target for PI3K, which can be activated by a variety of growth factors and cytokines via phosphorylation on serine and threonine residues[18-20] and may participate in growth factor stimulated cell cycle[21,22] and inhibition of apoptosis[23]. Disturbance of normal PKB/Akt signaling has been reported in several human cancers[24,25] and Akt is a focal point for deregulation in cancer[26].
Overexpression of the ErbB family of receptor tyrosine kinases has been implicated in a variety of tumors including breast, lung, prostate, colon and brain. Most solid tumors express one or more of these receptors, which can often be related to tumor aggressiveness and poor patient prognosis. Several agents that target one or more members of the ErbB family of receptor tyrosine kinases are currently undergoing clinical investigation[27]. Ciardiello and coworkers reported that ErbB3 mRNA transcripts were expressed in a majority of human colon cancer cell lines and in primary and metastatic human colorectal tumors[28]. In colorectal cancer, an increase in ErbB3 expression is frequently associated with an increase in ErbB2 expression. However, no difference in ErbB1 protein levels was apparent between normal colon and cancer[29]. In addition, HRG is co-expressed with ErbB2 proteins in human colon cancer specimens and autocrine activation of ErbB2 occurs through heterodimerization with ErbB3 in GEO colon cancer cells[30]. These results suggest that the HRG/ErbB2/ErbB3 pathway may be an important modulator of aberrant growth in colon cancer[31,32], and therefore, agents that inhibit the ErbB3 receptor activation may be useful for the prevention and/or treatment of human colon cancer.
We have previously observed that the t10c12 isomer inhibited HT-29 cell growth, whereas the c9t11 isomer had no effect[7]. Therefore, in this study, we assessed whether the growth inhibitory effect of t10c12 is related to changes in HRG-ErbB3 signaling and the Akt pathway.
MATERIALS AND METHODS
Materials
We purchased the following reagents from the indicated suppliers: HT-29 cells (the American Type Culture Collection, Rockville, MD, USA); Dulbecco’s Modified Eagle’s Medium/Ham’s F-12 nutrient mixture (DMEM/F12), essentially fatty acid-free, bovine serum albumin (BSA), ascorbic acid, α-tocopherol phosphate, and 3-[4,5-dimethylthiazol-2-yl]-2,5-diphenyltetrazolium bromide (MTT) [Sigma Chemical Co., St. Louis, MO, USA]; fetal bovine serum (FBS) and transferrin (Gibco BRL, Gaithersburg, MD); rainbow molecular weight markers, [methyl-3H]thymidine (5 Ci/mmol), horseradish peroxidase (HRP)-conjugated anti-rabbit and anti-mouse Ig, protein A-Sepharose beads (Amersham, Arlington Heights, IL, USA); c9t11 and t10c12 (Cayman Chemical Company, Ann Arbor, MI, USA); anti-PI3K p85 antibody (Upstate Biotechnology, Inc., Charlottesville, VA, USA); [γ-32P]ATP (PerkinElmer Life and Analytical Sciences, Inc., Boston, MA, USA); anti-phosphotyrosine-RC20 antibody linked to HRP (PY20-HRP; Transduction Laboratories, San Diego, CA, USA); recombinant human HRG-β EGF domain (R & D Systems, Minneapolis, MN, USA); antibodies against Akt (29752), phospho-Akt (p-Akt, 473), extracellular signal-regulated kinase (ERK-1/2), and phospho-ERK-1/2 (p-ERK-1/2, Thr202/Tyr203) [New England Biolabs, Beverly, MA, USA]; antibodies against ErbB1 (1005), ErbB2 (C-18), ErbB3 (C-17), and HRG (C-20) [Santa Cruz Biotechnology, Inc., Santa Cruz, CA, USA].
Cell culture
We used HT-29 cells between the 135th and 145th passage for these experiments. The complete medium for cell maintenance consisted of DMEM/F12 supplemented with 10% FBS, 100 U/mL penicillin, and 100 μg/mL streptomycin. To examine the effects of the CLA isomers and HRG-β, cells in the monolayer culture were serum starved in DMEM/F12 supplemented with 5 μg/mL transferrin, 5 ng/mL selenium, 0.1 mg/mL BSA, 50 ng/mL ascorbic acid, and 20 ng/mL α-tocopherol phosphate (serum-free medium). After serum starvation, cells were incubated in serum-free medium in the presence or absence of 4 μmol/L t10c12 or c9t11 and/or 20 ng/mL HRG-β. Fatty acids were complexed to essentially fatty acid-free BSA, with the molar ratio of fatty acid to BSA being 4:1, as described previously[33]. Media were changed every 2 d. Viable cell numbers were estimated by the MTT assay[34]. To examine DNA synthesis, [3H]thymidine incorporation assay was performed as previously described[35].
Fluorescence-activated cell sorting (FACS) analysis
The cells were plated in 24-well plates, serum starved, and incubated for 3 d in the absence or presence of 4 μmol/L t10c12 or c9t11 with or without 20 ng/mL HRG-β as described above. To estimate apoptotic cell number, the cells were trypsinized and incubated with phycoerythrin (PE)-conjugated Annexin V (Annexin V-PE) and 7-amino-actinomycin D (7-AAD) (BD Pharmingen, Franklin Lakes, NJ, USA) for 15 min at room temperature in the dark. Apoptotic cells were analyzed by flow cytometry within 1 h utilizing FACScanTM (Becton Dickinson, Franklin Lake, NJ, USA). The data were analyzed using ModFit V.1.2. software.
Immunoprecipitation and immunoblotting analyses
We treated HT-29 cells with various concentrations of t10c12 or c9t11 and/or 20 ng/mL HRG-β. Cell lysates (0.75 mg protein) were prepared and immunoprecipitated by using anti-ErbB3 antibody and protein A-Sepharose beads as previously described[35]. The immunoprecipitates or total cell lysates (50 μg protein) were resolved on a sodium dodecyl sulfate (SDS) - 4-20% polyacrylamide gel and transferred onto polyvinylidene fluoride membrane (Millipore, Bedford, MA, USA). The blots were blocked for 1 h in 1% BSA in TBS-T (20 mmol/L Tris-Cl, pH 7.5, 150 mmol/L NaCl, 0.1% Tween 20) or 5% milk TBS-T and incubated for 1 h with either anti-phospho-Tyr (1:5000), ErbB1 (1:250), ErbB2 (1:500), ErbB3 (1:1000), p85 (1:1000), Akt (1:1000), p-Akt (1:1000), ERK-1/2 (1:1000), p-ERK-1/2 (1:1000), or HRG (1:500) antibody. The blots were then incubated with anti-mouse or anti-rabbit horseradish peroxidase-conjugated antibody. Signals were detected by using the enhanced chemiluminescence method using SuperSignal West Dura Extended Duration Substrate (Pierce, Rockford, IL, USA). Immunoblots were probed with an antibody for β-actin (1:2000) as a control for protein loading. Protein expression levels are normalized to β-actin, and the levels in the untreated samples are always set at 100%.
Reverse transcriptase-polymerase chain reaction (RT-PCR)
HT-29 cells were seeded at the density of 1×10⁶ cells/dish in 100-mm dishes and treated with various concentrations of t10c12 or c9t11 as described above. Total RNA was isolated using the guanidium isothiocyanate-phenol-chloroform method and RT-PCR was performed as previously described[35]. Sequences for PCR primer sets, annealing temperatures, and numbers of cycles used for PCR amplification were previously described[35]. The levels of mRNA were corrected as a ratio to the corresponding β-actin level and the levels in the untreated samples were always set at 100%.
PI3K assay
We estimated PI3K activity as previously described[36]. Seven hundred and fifty micrograms of cell lysate was immuno-precipitated with ErbB3 antibody followed by incubation with protein A-Sepharose beads. The immunoprecipitates were washed twice with 1% NP-40-PBS, twice with 100 mmol/L Tris-HCl (pH 7.5) containing 500 mmol/L LiCl and 1 mmol/L Na3VO3, and twice with 50 mmol/L Tris-HCl (pH 7.2) containing 150 mmol/L NaCl. After the last wash, the beads were resuspended in 20 μL kinase buffer (20 mmol/L Hepes, pH 7.2, 50 mmol/L NaCl, 1 mmol/L EGTA) containing 4 μg of phosphatidylinositol (Sigma), 10 μmol/L ATP, 5 mmol/L MnCl2, and 10 μCi of [γ32]ATP and incubated for 20 min at 30 °C. The resulting 32P-labeled phosphatidylinositol 3-phosphate (PIP) lipids were separated from other reaction products by thin layer chromatography and visualized by autoradiography. The PIP signals were quantitated by densitometry using the Bio-profile Bio-1D application (Vilber-Lourmat, France).
Statistical analysis
For all studies, 3-6 independent experiments were performed with separate batches of cells. We expressed the results as the mean±SE and analyzed by one-way, two-way, or two-factor repeated measurements analysis of variance (ANOVA). Differences between treatment groups were analyzed by Duncan’s multiple range test or t test. Means were considered significantly different at P<0.05. All statistical analyses were done using the SAS System for Windows V8.1 (SAS Institute, Cary, NC, USA).
RESULTS
T10c12 abrogates the growth stimulatory effects of HRG-β in HT-29 cells
Previously, we have observed that t10c12 (0-4 μmol/L) inhibited HT-29 cell growth in a dose-dependent manner, whereas c9t11 had no effect. We observed a 662% decrease in cell number within 96 h after the addition of 4 μmol/L t10c12[7]. In the present study, we first assessed whether HRG-β stimulates HT-29 cell growth and inhibits the growth inhibitory effect of t10c12. We cultured HT-29 cells in the absence or presence of 20 ng/mL HRG-β with or without 4 μmol/L t10c12 or c9t11. HRG-β significantly increased viable HT-29 cell numbers. T10c12 CLA decreased viable cell numbers, which was not prevented by the addition of HRG-β. In fact, viable cell numbers were even lower in the presence of both HRG and t10c12 compared to those in the presence of t10c12 alone (Figure 1A). By contrast c9t11 had no effect on viable cell numbers in either the presence or absence of HRG-β (Figure 1B).
Figure 1 Trans-10,cis-12 (t10c12) CLA abrogates the growth stimulatory effect of heregulin (HRG )-β.
HT-29 cells were plated in 24-well plates at 50000 cells/well in DMEM/F12 supplemented with 10% fetal bovine serum. A day later, the monolayers were serum-starved with serum-free DMEM/F12 supplemented with 5 μg/mL transferrin, 0.1 mg/mL BSA, and 5 ng/mL selenium for 24 h. After serum-starvation, cells were incubated in serum-free medium in the absence or presence of 4 μmol/L t10c12 (A) or c9t11 (B) with or without 20 ng/mL HRG-β. Cell numbers were estimated by the MTT assay. Each bar represents the mean±SE (n = 6). Comparisons between groups that yielded significant differences are indicated by different letters above each bar. For example, aP<0.05 vs 0 μmol/L t10c12, cP<0.05 vs 0 μmol/L t10c12 + HRGβ, eP<0.05 vs 4 μmol/L t10c12.
To examine whether t10c12 inhibits DNA synthesis of HT-29 cells, we treated the cells with 4 μmol/L t10c12 in the absence or presence of HRG-β for 2 d and estimated [3H]thymidine incorporation. As illustrated in Figure 2A, t10c12 decreased the incorporation of [3H]thymidine into DNA of HT-29 cells. HRG-β increased [3H]thymidine incorporation but did not abrogate the effect of the t10c12 isomer. The incorporation of [3H]thymidine further decreased in the presence of both HRG-β and t10c12 compared to that in the presence of t10c12 alone. C9t11 CLA had no effect on [3H]thymidine incorporation (data not shown).
Figure 2 Effect of HRG-β and/or t10c12 on DNA synthesis and apoptosis of HT-29 cells.
HT-29 cells were cultured and treated with 4 μmol/L t10c12 in the absence or presence of 20 ng/mL HRG-β. A: To estimate DNA synthesis, [3H]thymidine incorporation into DNA was measured. B: To measure apoptosis, the cells were stained with 7-amino-actinomycin D (7-AAD) and Annexin V, and then analyzed by flow cytometry. The number of early apoptotic cells is expressed as a percentage of total cell number. Each bar represents the mean±SE from six independent experiments. Comparisons between groups that yielded significant differences are indicated by different letters above each bar. For example, aP<0.05 vs 0 μmol/L t10c12, cP<0.05 vs 0 μmol/L t10c12 + HRGβ, eP<0.05 vs 4 μmol/L t10c12.
To examine whether HRG-β inhibits t10c12-induced apoptosis, we estimated the fractions of HT-29 cells undergoing apoptosis after treatment with t10c12 and/or HRG-β using Annexin-V staining followed by flow cytometry. As shown in Figure 2B, we observed an increase in apoptotic cell numbers after treatment with 4 μmol/L t10c12. HRG-β inhibited apoptosis in the absence and presence of t10c12 but did not completely abrogate t10c12-induced apoptosis. C9t11 did not induce apoptosis (data not shown).
T10c12 CL in italics A isomer inhibits HRG-b-ErbB3 signaling
We previously reported that HT-29 cells express ErbB1, ErbB2, and ErbB3 and ErbB3 was expressed at relatively higher levels than ErbB1 and ErbB2[35]. Because HRG-β increased DNA synthesis but did not abrogate the inhibitory effect of t10c12, we next wished to examine whether t10c12 inhibited ErbB3 signaling. We immunoblotted total cell lysates with antibodies specific for ErbB1, ErbB2, and ErbB3 to investigate whether t10c12 influences ErbB receptor expression in HT-29 cells. Treatment of HT-29 cells with increasing concentrations of t10c12 led to decreased ErbB1, ErbB2, and ErbB3 levels (Figure 3), whereas c9t11 had no effect (Figure 4). Neither t10c12 nor c9t11 affected levels of HRG or the p85 regulatory subunit of PI3K (Figures 3 and 4).
Figure 3 Effect of t10c12 on the protein expression of ErbB1, ErbB2, ErbB3, HRG, and the p85 subunit of PI3K.
HT-29 cells were treated with various concentrations of t10c12 for 3 d. Cell lysates were subjected to immunoblotting with an antibody against ErbB1, ErbB2, ErbB3, p85 subunit of PI3K, HRG, or β-actin. A: Photographs of chemiluminescent detection of the blots, which were representative of three independent experiments, are shown; B: Quantitative analysis of immunoblots. The relative abundance of each band was estimated by densitometric scanning of the exposed films. Each bar represents the mean±SE (n = 3). Comparisons between groups that yielded significant differences are indicated by different letters above each bar. For example, aP<0.05 vs 0 μmol/L t10c12, cP<0.05 vs 1 μmol/L t10c12, eP<0.05 vs 2 μmol/L t10c12.
Figure 4 Effect of c9t11 on the protein expression of ErbB1, ErbB2, ErbB3, HRG, and the p85 subunit of PI3K.
HT-29 cells were treated with various concentrations of c9t11 for 3 d. Cell lysates were subjected to immunoblotting with an antibody against ErbB1, ErbB2, ErbB3, p85 subunit of PI3K, HRG, or β-actin. A: Photographs of chemiluminescent detection of the blots, which were representative of three independent experiments, are shown. B: Quantitative analysis of immunoblots. The relative abundance of each band was estimated by densitometric scanning of the exposed films. Each bar represents the mean±SE (n = 3).
To determine whether t10c12 regulates the expression of ErbB1, ErbB2, and ErbB3 at an mRNA level, we similarly treated cells with the CLA isomer, isolated total RNA and determined mRNA levels using RT-PCR analysis. As shown in Figure 5, t10c12 decreased ErbB1, ErbB2, and ErbB3 transcripts in a concentration-dependent manner, whereas the same concentrations of c9t11 did not alter ErbB transcripts (Figure 6).
Figure 5 Effect of t10c12 on ErbB1, ErbB2, and ErbB3 transcripts.
HT-29 cells were treated with various concentrations of t10c12 for 3 d. Total RNA was isolated and RT-PCR was performed as described in Materials and methods. A: Photographs of the ethidium bromide-stained gel, which were representative of three independent experiments, are shown; B: Quantitative analysis of mRNAs. The relative abundance of each band was estimated by densitometric scanning of the exposed films. Each bar represents the mean±SE (n = 3). Comparisons between groups that yielded significant differences are indicated by different letters above each bar. For example, aP<0.05 vs 0 μmol/L t10c12, cP<0.05 vs 1 μmol/L t10c12, eP<0.05 vs 2 μmol/L t10c12.
Figure 6 Effect of c9t11 on ErbB1, ErbB2, and ErbB3 transcripts.
HT-29 cells were treated with various concentrations of c9t11. Total RNA was isolated and RT-PCR was performed as described in Materials and methods. A: Photographs of the ethidium bromide-stained gel, which were representative of three independent experiments, are shown; B: Quantitative analysis of mRNAs. The relative abundance of each band was estimated by densitometric scanning of the exposed films. Each bar represents the mean±SE (n = 3).
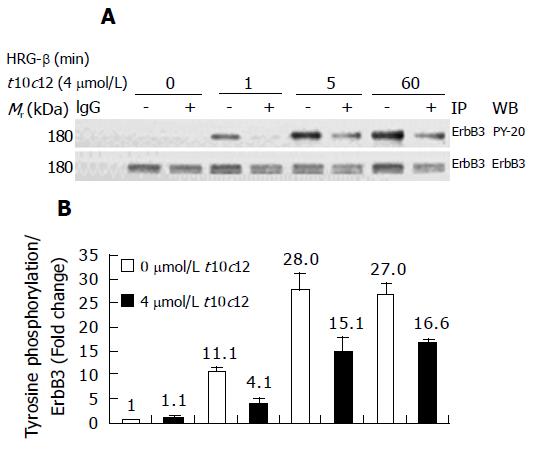
The tyrosine kinase subunits of the ErbB3 intracellular domain become tyrosine phosphorylated following activation by HRG-β. To determine whether t10c12 inhibits ErbB3 tyrosine phosphorylation, we treated cells with or without 4 μmol/L t10c12 for 3 d and prepared lysates after 0, 1, 5, or 60 min of stimulation with HRG-β. Using immunoprecipitation followed by immunoblotting, we measured levels of ErbB3 receptor expression and phosphorylation. Following the addition of HRG-β alone, ErbB3 levels remained invariable and increased ErbB3 phosphorylation was detected at 1 and 5 min, indicating that the receptor was being stimulated by the ligand (Figure 7A). Tyrosine phosphorylation of ErbB3 was drastically decreased and ErbB3 protein levels were decreased by approximately 35% in cells treated with 4 μmol/L t10c12. The phosphotyrosine levels of ErbB3 were normalized to corresponding ErbB3 protein levels to distinguish whether the reduced tyrosine phosphorylation is a result of decreased ErbB3 protein levels or inhibition of phosphorylation of the signaling protein. After normalization, the reduced phosphorylation after t10c12 is still obvious (Figure 7B) indicating that the reduction is a result of both decreased ErbB3 levels and the inhibition of phosphorylation. These results are consistent with the finding that t10c12 prevented the effect of exogenous HRG-β on HT-29 cell growth.
Figure 7 Effect of t10c12 on HRG-β-induced tyrosine phosphorylation of ErbB3 in HT-29 cells.
Cells were treated in the absence or presence of 4 μmol/L t10c12 for 3 d and lysed without stimulation (0) or after 1, 5, or 60 min of stimulation with HRG-β. Cell lysates were incubated with an anti-ErbB3 antibody and the immune complexes were precipitated with protein A-Sepharose. The immunoprecipitated proteins were analyzed by Western blotting with antibodies against phosphotyrosine or ErbB3. A: Photographs of chemiluminescent detection of the blots, which were representative of three independent experiments, are shown; B: The relative abundance of each band was estimated by densitometric scanning of the exposed films. Each bar represents the mean±SE (n = 3).
T10 in italics c12 inhibits HRG-β-induced activation of PI3K and Akt
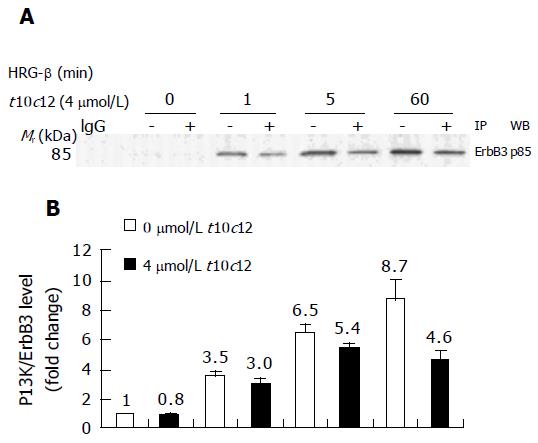
Activation of ErbB3 receptor signaling leads to activation of PI3K. We examined the expression of the p85 regulatory subunit of PI3K in HT-29 cells treated with increasing amounts of t10c12 using Western blot analysis. We detected decreased levels of ErbB receptors without any change in p85 expression after the addition of t10c12 (Figure 3). We investigated whether t10c12 influences HRG-β-induced association of ErbB3 and p85. We performed immunop-recipitation with an anti-ErbB3 antibody followed by Western blotting with the p85 antibody. HRG-β stimulated association of p85 with ErbB3, and the association was reduced in t10c12-treated cells (Figure 8A). The levels of p85 associated with ErbB3 was normalized to ErbB3 expression levels to differentiate whether the reduced association after t10c12 treatment is a result of decreased ErbB3 levels or that of an inhibition of p85 recruitment. After normalization, the differences in p85 association between control and t10c12 are significant at 5 and 60 min after HRG-β addition (Figure 8B) indicating that both decreased ErbB3 levels and an inhibition of p85 recruitment are responsible for the decreased p85 association to ErbB3.
Figure 8 Effect of t10c12 on HRG-β-induced recruitment of the p85 subunit of PI3K to ErbB3 in HT-29 cells.
Immunoprecipitation was performed with an anti-ErbB3 antibody and protein A-Sepharose as described above. The immunoprecipitated proteins were analyzed by Western blotting with an antibody against the p85 PI3K subunit. A: A photograph of chemiluminescent detection of the blot, which was representative of three independent experiments, is shown. B: The relative fold change in p85 to its own ErbB3 band on Western blots. Each bar represents the mean±SE (n = 3).
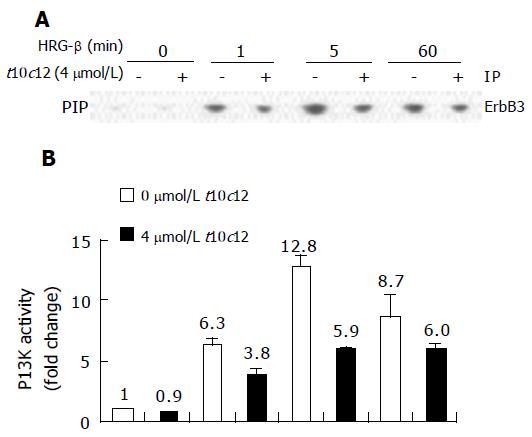
We analyzed PI3K activity in the anti-ErbB3 immuno-precipitates by in vitro kinase assays, wherein the PIP product was separated by thin layer chromatography. The spots of 32P-labeled PIP on thin-layer chromatography plates are shown in Figure 9A with their activities plotted in Figure 9B. Similar to p85 Western blot analysis (Figure 8A), HT-29 cells incubated with HRG-β showed time-dependent changes in PI3K activity of their anti-ErbB3 immunoprecipitates. The PI3K activities increased 6-fold at 1 min after the HRG-β treatment and further increased at 5 min, and 4 μmol/L t10c12 decreased these changes.
Figure 9 Effect of t10c12 and/or HRG-β on ErbB3-associated PI3K activity.
Cells were treated, and lysates were prepared and immunoprecipitated with an anti-ErbB3 antibody as described in Figure 8. The immune complexes were incubated with phosphatidylinositol and [g-32P]ATP. Phosphatidylinositol 3-phosphate (PIP) generated by immunoprecipitated PI3K was separated by thin-layer chromatography (TLC). A: An autoradiograph of the TLC plate, which was representative of three independent experiments, is shown; B: Relative fold changes in PIP. The radioactive PIP signals were quantitated by densitometry. Each bar represents the mean±SE (n = 3).
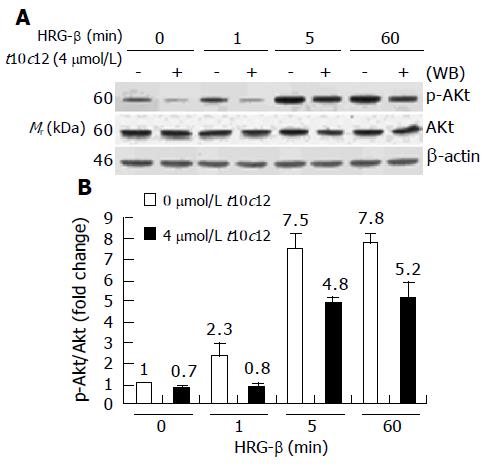
It is well known that ErbB3 receptor activation of PI3K leads to movement of Akt to the membrane and its subsequent activation[20,37]. We immunoblotted total cell lysates using anti-p-Akt and whole Akt protein antibodies and quantitated the relative fold change in p-Akt to its own total Akt signal by densitometry. The time-dependent increase in Akt phosphorylation (p-Akt) by HRG-β is depicted in Figure 10. HRG-β induced phosphorylation of AKT within 5 min, and the increase in p-Akt after HRG-β treatment was coherent with the increase in PI3K activity and ErbB3-associated p85 protein levels seen at 5 min after HRG-β treatment. We observed no changes in Akt protein levels during the 60-min HRG-β stimulation. However, p-Akt levels were substantially decreased in cells treated with t10c12, whereas the total Akt protein levels were only slightly decreased by t10c12 treatment. C9t11 did not cause any changes in HRG-β-induced Akt activation in HT-29 cells (data not shown).
Figure 10 Effect of t10c12 on HRG-β-induced Akt activation.
Similar protein samples as those in Figure 8 were analyzed by immunoblotting with anti-phospho-Ser473 Akt (p-Akt) or whole Akt protein antibodies. A: Photographs of chemiluminescent detection of the blots, which were representative of three independent experiments, are shown; B: Quantitative analysis of immunoblots. The relative fold change in p-Akt to its own Akt control band on Western blots was quantitated by densitometric analysis. Each bar represents the mean±SE (n = 3).
T10c12 does not inhibit HRG-β-induced activation of ERK-1/2
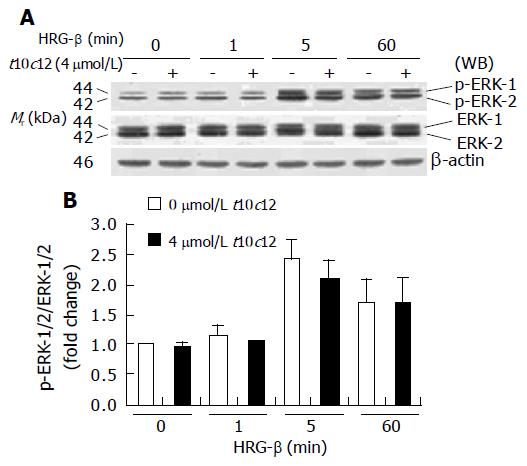
Activation of ERK-1/2 has also been implicated in mitogenic signaling by the HRG-induced activation of ErbB3[38]. To examine the effect of t10c12 on HRG-β-induced activation of ERK-1/2, we performed Western blotting using antibodies raised against ERK-1/2 and p-ERK-1/2. HRG-β activation of ErbB3 receptor signaling resulted in an increase in phosphorylation of ERK-1/2 in HT-29 cells. Phosphorylated ERK-1/2 levels were increased at 5 min after HRG-β stimulation but HRG-induced ERK-1/2 phosphorylation was not changed by 4 μmol/L t10c12. Total ERK-1/2 levels did not change after t10c12 treatment (Figure 11). Neither phosphorylated nor total ERK-1/2 levels were altered by treatment with the same concentration of c9t10 (data not shown).
Figure 11 Effect of t10c12 on HRG-β-induced ERK-1/2 activation in HT-29 cells.
Similar protein samples as those in Figure 8 were analyzed by immunoblotting with p-ERK-1/2 or whole ERK-1/2 antibodies. A: Photographs of chemiluminescent detection of the blots, which were representative of three independent experiments, are shown; B: Quantitative analysis of immunoblots. The relative fold change in p-ERK-1/2 to its own ERK-1/2 control band on Western blots was quantitated by densitometric analysis. Each bar represents the mean±SE (n = 3).
DISCUSSION
We previously reported that the t10c12, not the c9t11, isomer of CLA inhibited HT-29 colon cancer cell growth[7]. In the present study, the t10c12 isomer, which decreased viable HT-29 cell numbers, decreased the protein levels of ErbB1, ErbB2, and ErbB3. However, the c9t11 isomer, which did not alter viable HT-29 cell number, had no effect on ErbB protein levels. In addition, exogenous HRG-β stimulated cell growth in the absence of t10c12 but did not mitigate the growth inhibitory effect of t10c12. These results indicate that the decreased ErbB levels by the t10c12 isomer may be, at least in part, responsible for the decreased cell growth in HT-29 cells.
It has been observed in numerous types of cancers that cell proliferation and survival increased when control of the ErbB pathways is lost, leading to the malignant phenotype[39]. HRG is a potent mitogen for colon cancer cells and autocrine HRG generates growth factor independence and prevents apoptosis[30,40]. In order to study the mechanisms by which t10c12 decreases colon cancer cell growth, the present study examined the influence of t10c12 on ErbB3 signaling. In the present study, we provide the first evidence that t10c12 reduces ErbB2 and ErbB3 protein expression and ErbB3-mediated signaling. When HT-29 cells were incubated with HRG-β in serum-free medium, the cells reacted to HRG-β by increasing cell number. However, HRG-β was unable to increase the viable cell number in the presence of t10c12 suggesting that t10c12 downregulates the HRG-receptor signaling pathway. In fact, we observed decreased levels of the HRG receptor ErbB3 at 72 h after treatment with t10c12. However, the expression of HRG in HT-29 cells was not affected by t10c12. Previous studies have reported that HRG is expressed in gastrointestinal tissues[32,41] and human colon cancer samples, and is an autocrine growth regulator of GEO human colon cancer cells[30]. Because HT-29 cells express HRG and its receptor ErbB3, HRG may also be an autocrine growth regulator of HT-29 cells. Our present results indicate that t10c12 decreases cell’s ability to respond to HRG without altering the production of this growth factor in HT-29 cells.
The present results indicate that the decrease in ErbB levels by t10c12 treatment was due to at least in part, to the decrease in mRNA expression. In this study, we did not examine the mechanisms by which the t10c12 isomer regulates ErbB genes. CLA has been reported to be an activator of the peroxisomal proliferators-activated receptor (PPAR) γ[42]. Ligands for PPARγ induce apoptosis and exert antiproliferative effects on several carcinoma cell lines[43,44]. Houseknecht et al[45], have shown that mRNA levels of aP2, a PPAR responsive gene in the adipose tissue of fatty Zucker diabetic rats, were increased as a result of PPARγ activation by CLA. Other studies utilizing MCF-7 breast cancer cells have shown that the activation of PPARγ through the 15-deoxy-△-12,14-prostaglandin J2 ligand causes a dramatic inhibition of ErbB2 and ErbB3 tyrosine phosphorylation induced by HRG-α and HRG-β[46]. We speculate that t10c12 or its metabolites may activate the PPAR transcription factor family. It remains to be determined whether t10c12 inhibits ErbB gene expression by activating PPARγ and/or by other mechanisms.
Activation of tyrosine kinase receptors requires tyrosine phosphorylation of their intracellular subunits. T10c12 decreases HRG-β-induced tyrosine phosphorylation of ErbB3 when the data was normalized with ErbB3 protein levels indicating that t10c12 inhibits activation of this receptor in addition to decreasing the receptor protein levels. ErbB3 has been described as a key mediator of HRG-dependent activation of the PI3K pathway[47,48]. ErbB3 is especially well suited to mediate PI3K signaling because it contains six YXXM consensus-binding sites for p85[49]. We observed that HRG-β stimulated the recruitment of p85 to ErbB3 in HT-29 cells, and t10c12 decreased ErbB3-associated p85 protein levels and PI3K activities. These decreases do not appear to be due to changes in the p85 protein expression, but to the decrease in ErbB3 protein levels.
PKB/Akt is a downstream target of PI3K and plays a central role in PI3K-mediated protection against apoptosis[50]. The present results show that t10c12 inhibited HRG-β-induced activation of Akt, which could be attributed to both decreased ErbB3 levels and decreased ErbB3 activation. We speculate that t10c12 inhibits DNA synthesis and induces apoptosis of HT-29 cells by inhibiting the Akt signaling pathway. Increased expression and/or activity of ErbB receptors and downstream signaling proteins such as Akt are frequent events in cancer. Future studies are needed to study the effect of Akt on HT-29 cell growth.
The ERK/MAP kinase family of serine/threonine kinases comprises a cascade of three kinases; ERK-1/2, c-jun N-terminus kinase (JNK), and p38 MAP kinase. It is generally accepted that the balance between growth-factor-activated ERK-1/2 and stress-activated JNK and p38 pathways determines whether the cell lives or dies[51]. In the present experiment, t10c12 had no effect on either basal or HRG-β-induced phosphorylation of ERK-/2. It remains to be determined whether t10c12 alters stress activated JNK and p38 pathways in cancer cells.
In summary, t10c12 decreases viable HT-29 cell numbers, which was due to decreased DNA synthesis and induction of apoptosis. However, c9t11 had no effect on apoptosis or DNA synthesis. HRG-β stimulates DNA synthesis and inhibits apoptosis but did not abrogate the effects of the t10c12 isomer. In addition, the t10c12 isomer negatively regulates levels of ErbB receptors and subsequent activation of Akt but not activation of ERK-1/2 in HT-29 cells. These results suggest that the growth inhibitory effects of the t10c12 isomer may, at least in part, be mediated by decreasing HRG/ErbB3 signaling and the PI3K/Akt pathway. The ability of the t10c12 isomer to inhibit the PI3K/Akt pathway is especially important because aberrant activation of ErbB receptors and Akt signaling play a role in the development of many types of cancer. To date much attention has been focused on developing inhibitors of Akt for cancer therapy. However, in view of the recent study reporting that the t10c12 isomer increased the size of the adenoma in the small intestine of Min mouse[10], further animal studies are necessary to determine the effects of the t10c12 isomer on colon carcinogenesis.


