Published online May 1, 2004. doi: 10.3748/wjg.v10.i9.1365
Revised: September 20, 2003
Accepted: October 12, 2003
Published online: May 1, 2004
AIM: To establish a high P-glycoprotein (P-gp) expressing cell line as a model for studying drug absorption and distribution, and to explore the preliminary application of this screening model.
METHODS: A full-length MDR1 cDNA fragment in plasmid pMDRA1 was first subcloned into plasmid pET28a(+), then MDR1 cDNA was cut from the recombinant plasmid with double-digestion and ligated into the mammalian expression vector pcDNA3.1(+). The recombinant plasmid pcDNA3.1(+)/MDR1 was transfected into breast cancer cell line Bcap37 using the Superfect transfection reagent. Several stably transfected clones were obtained after selection with G418. Real-time fluorescent quantitative RT- PCR and Western blot methods were used to detect the expression of P-gp, and the cellular location of the expressed protein was determined by immunohistochemical staining. Drug sensitivity assay was used to evaluate the biological function of expressed P-gp. Concentration of quercetin in cells was determined by high-performance liquid chromatography (HPLC).
RESULTS: The recombinant plasmid was confirmed to be inserted in the correct orientation by restrictive enzyme digestion and DNA sequencing. Real-time fluorescent quantitative RT-PCR showed a higher level of P-gp mRNA in transfected cells compared to that in the control cells, and the Western blot result also indicated that P-gp expression in transfected cells was higher than that in control cells. The immunohistochemical staining showed that the expressed P-gp was localized on cell membranes. Drug sensitivity assay showed that the IC50 for adriamycin and colchicine of the transfected cells was higher than that of the control cells. The concentration of quercetin in model cells was lower than that in control cells by HPLC. After P-gp inhibitor verapamil was administered, the concentration of quercetin in model cells was increased.
CONCLUSION: A high P-gp expressing cell line can be established, which could provide a suitable in vitro model system for studying drug intestinal absorption mechanism, predicting the drug permeability characteristics and screening new multi-drug resistance reversing agents. With this model, quercetin can be found to be transported by P-gp, and it is a P-gp substrate.
- Citation: Wang Y, Cao J, Zeng S. Establishment of a P-glycoprotein substrate screening model and its preliminary application. World J Gastroenterol 2004; 10(9): 1365-1368
- URL: https://www.wjgnet.com/1007-9327/full/v10/i9/1365.htm
- DOI: https://dx.doi.org/10.3748/wjg.v10.i9.1365
P-glycoprotein (P-gp), a product of the multidrug resistance (MDR) gene, is widely distributed in normal tissues of the body, including intestinal mucosa, proximal tubule of the kidneys, placenta, testes, and blood-brain barrier[1]. It is an ATP-dependent efflux transporter that affects the absorption, distribution, and excretion of a number of clinically important drugs[2]. For example, in intestinal mucosa, P-gp serves as a biochemical barrier to drug delivery. Drugs or drug candidates are bound to P-gp and transported back to the apical surface of the tissue, thereby restricting the overall permeability of drugs and drug candidates.
Due to in vivo disposition and pharmacokinetics of drug efflux transporters, identification of compounds as P-gp substrates can aid the optimization and screening of new drug candidates. A variety of in vitro assays have been used to classify compounds as P-gp substrates[3]. These assays can be classified into three groups. One is transport across polarized cell monolayers expressing P-gp on the apical membrane, the other is drug uptake into cells over-expressing P-gp, the third is direct binding to P-gp using inside-outside membrane vesicles or reconstituted P-gp.
Quercetin, a flavonoid and phytoestrogen, is present in a wide variety of fruits and vegetables [4]. Quercetin is also a potent antioxidant in vivo and in vitro, and thus quercetin and other flavonoids have been considered as therapeutic agents for a wide range of diseases, including cancer, viral infection, inflammation/allergy, hypertension and atherosclerosis[5-7].
In this study we constructed a P-gp expressing plasmid, established a P-gp high-expression cell model, and identified quercetin as a P-gp substrate with this cell model.
Breast cancer cell line Bcap37 (maintained by the Cancer Institute of Zhejiang University) was cultured in RPMI 1640 medium (Hyclone, United States) containing 100 ml/L heat-inactivated newborn calf serum (GIBCO), 100 U/mL penicillin and 100 μg/mL streptomycin. The cells were incubated at 37 °C in a humidified atmosphere with 50 mL/L CO2 in air.
Plasmid pMDRA1 containing a full-length MDR1 cDNA was kindly provided by Professor Kazumitsu Ueda[8]. The plasmid was digested with SacI and XhoI, and the MDR1 cDNA fragment was ligated into pET28a(+) which was pre-cut with SacI and XhoI. The recombinant plasmid was digested with BamHI and XhoI, and the insert was purified by 0.8% agarose gel electrophoresis and ligated into the mammalian expression vector pcDNA3.1(+) pre-cut with BamHI and XhoI. The resulting pcDNA3.1(+)/MDR1 was digested with EcoRI to check the orientation of the insert and DNA sequencing was used to verify the inserted sequence.
Bcap37 cells were transfected with the recombinant expression vector pcDNA3.1(+)/MDR1 using Superfect transfection reagent according to the manufacturer’s instructions (QIAGEN). After 48 h of transfection, stable transfectants were isolated by selection with 800 μg/mL G418 for 10 d. G418-resistant stable clones were picked for further characterization. The transfectants were maintained in RPMI 1640 containing 100 mL/L newborn calf serum and 400 μg/mL G418. Bcap37 cells were also transfected with pcDNA3.1(+) vector as the control.
Total RNAs in Bcap37/MDR1 cells and control cells were extracted using TRIzol™ reagent (GIBcoBRL, Life Technologies) according to the user’s guide. Real-time fluorescent quantitative RT-PCR was done with the MDR1 mRNA quantification kit (designed by the Cancer Institute of Zhejiang University and manufactured by Shanghai Jiusheng Medical Instrument Company) according to the manufacturer’s instructions[9].
Total proteins in Bcap37/MDR1 and control cells were extracted with 1 g/L Triton X-100 and protein concentration was determined with a Bio-Rad protein assay kit and standardized with bovine serum albumin. The samples were electrophoresed (SDS-PAGE, 80 g/L) and electroblotted onto PVDF membrane (BioRad). The membrane was blocked in buffer with 50 mL/L fat free dry milk, detected with anti P-gp antibody (monoclonal F4, Sigma).
Bcap37/MDR1 cells and control cells were harvested by centrifugation at 2000 r/min for 5 min, washed twice with PBS, and mounted onto the slides. Immunohistochemical staining was doned with the UltraSensitive™ S-P mouse kit (Fuzhou Maxim Biotech, Inc). The protocol was accorded to the user guide. Primary antibody was monoclonal anti-human P-glycoprotein antibody purchased from Fuzhou Maxim Biotech (monoclonal number C494).
Sensitivity of cells to anticancer drugs was examined by a colorimetric assay using MTT method. Cells (6 × 10³ cells/well) were seeded on 96-well plates, and cultured in a humidified atmosphere with 50 mL/L CO2 at 37 °C. Twenty- four hours later, drugs were added at various concentrations. Control wells were included for each drug that consisted of the respective solvents. Forty-eight hours later, 50 μL of 1 mg/mL MTT(in PBS ) [3-[4,5-dimethylthiazol-2-yl]-2,5-diphenyltetrazolium bromide] was added to each well and incubated in a humidified atmosphere with for 4 h at 37 °C 50 mL/L CO2. The supernatants were aspirated, and 200 μL /well of dimethyl sulfoxide was added to dissolve formazan crystals. Color intensity was measured at 570 nm using an ELISA reader. The 50% inhibitory concentration for a particular agent was defined as the drug concentration which resulted in a 50% reduction in cell number at 48 h relative to the control. Each experiment was performed in triplicate.
Bcap37 and Bcap37/MDR1 cells were seeded at the density of 7.5 × 10⁵ to a 35 mm i.d. tissue culture well. After twenty-four hours, the culture medium was aspirated, and replaced by the medium containing 25 μmol/L quercetin. After 10 and 20 min, the medium was aspirated and the cells were washed 3 times with ice-cold PBS (pH7.4) to stop further uptake. A 1 mL of 1 g/L Triton X-100 was added to each well to lyse the cells. Drug concentration in lysis solution was determined by reverse-phase HPLC, and normalized with cellular protein content[10].
Bcap37/MDR1 and control cells were seeded at the density of 7.5 × 10⁵ to a 35 mm i.d. tissue culture well. After twenty-four hours, the culture medium was aspirated, and replaced by the medium containing 25 μmol/L quercetin with/without 6.6 μmol/L verapamil. After 30 min, the media were aspirated and the cells were washed 3 times with ice-cold PBS (pH7.4) to stop further uptake. A 1 mL of 1 g/L Triton X-100 was added to each well to lyse the cells. Drug concentration in lysis solution was determined by reverse- phase HPLC, and normalized with cellular protein content.
The HPLC system used was Agilent 1100 system (Agilent Technologies). Separation was done on a conLichrospher ODS-C18 (4.6 mm i.d. × 250 mm) column. The mobile phase consisted of pH2.0 phosphate buffer-tetrahydrofuran-methanol-isopropanol (65:15:10:20, v:v:v:v) at a flow rate of 0.5 mL/min, and the wavelength of UV detector was 380 nm. Morin was used as internal standard. Cell protein was quantitated by Bio-Rad DC protein assay kit.
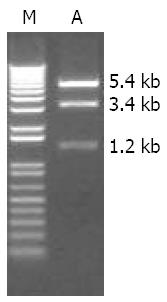
After digestion with EcoRI, the recombinant plasmid pcDNA3.1(+)/MDR1 showed three DNA fragments about 1.2 kb, 3.4 kb and 5.4 kb as expected (Figure 1). DNA sequencing result further confirmed the correct construction of this P-gp expression vector.
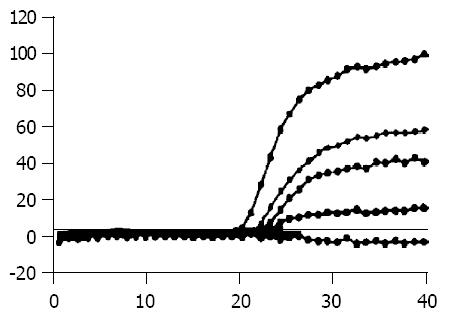
The CT of Bcap37/MDR1 and control cells was 19 and 40 cycles (Figure 2). It showed a significant increase of MDR1 mRNA levels in Bcap37/MDR1 than in control cells.
The Bcap37/MDR1 cells showed significantly higher level of P-gp at 170 ku compared with control cells (Figure 3).
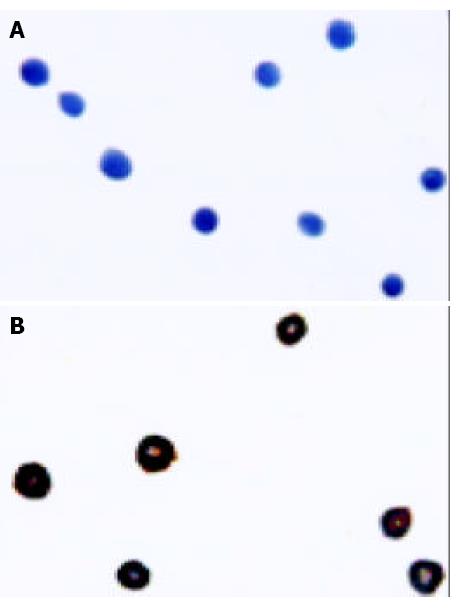
The nuclei and plasma of control cells were stained blue (Figure 4A), demonstrating that the cells did not express P-gp. The Bcap37/MDR1 cells showed brown staining on cell membrane (Figure 4B). This indicated that P-gp was expressed on the transfected cell membrane.
The cells were stained using a human anti-Pgp primary antibody, biotinylated anti-rabbit IgG secondary antibody, followed by the avidin and horseradish containing Vector ABCD reagent. The sections were then stained with 3,3-diaminobenzidine (DAB) and counterstained with hematoxylin. The brown color represented Pgp expression and the blue color was the non-specific counterstaining.
Resistance to anticancer drugs was determined using MTT assay.Bcap/MDR1 exhibited multidrug resistant phenotypes characterized by cross-resistance to two unrelated antitumor agents (Table 1) including adriamycin and colchicine. The results confirmed the expressed Pgp in transfected cells played a role as an efflux pump.
| Cell line | IC50 (μg/mL) | |
| Adriamycin | Colchicine | |
| Bcap37 | 0.047 | 0.028 |
| Bcap37/MDR1 | 2.203 | 0.391 |
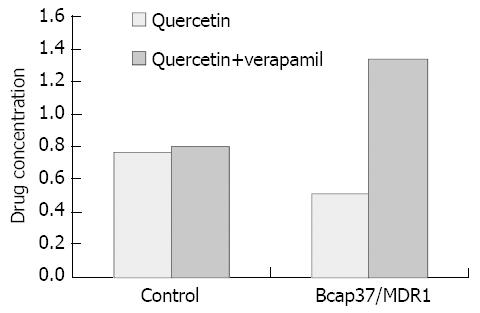
Quercetin was incubated with Bcap37/MDR1 and Bcap37 for 10 min and 20 min, and the drug accumulation in cells is listed in Table 2. After P-gp inhibitor verapamil was administered the concentration of quercetin in model cells was increased (Figure 5). All values were normalized with protein content. The results demonstrated that quercetin was accumulated in Bcap37 much more than in Bcap37/MDR1 (P < 0.05).
The amount of quercetin accumulation in cells was determined by reverse phase HPLC through a standard curve, and the values were normalized with cellular protein content. There was a significantly higher concentration of quercetin accumulated in MDR1 transgenic cells (P < 0.05).
In recent years, it has become apparent that transport proteins play a major role in controlling the distribution, elimination and potentially the metabolism of some drugs, including organic cation transporters, organic anion transporters, MRP related transporters, and P-glycoprotein. P-gp has received considerable attention in recent years both as a barrier to drug absorption and distribution, and as a potential source for variability in drug pharmacokinetics and pharmacodynamics. In the intestine, P-gp could actively transport drugs counter-current to the absorptive transport of drugs, thus posing a barrier to absorption of exogenous compounds[11]. This activity has been proposed to act in concert with intestinal cytochrome P-450 3A4 to increase pre-systemic metabolism of drugs, further minimizing systemic exposure to other drugs and xenobiotics[12,13]. For example, Pgp limited intestinal absorption of digoxin, talinolol, and cyclosporine after oral dosing, limited the central nervous system penetration of human immunodeficiency virus protease inhibitors, and helped excrete paclitaxel into intestine[14-18].
A P-gp over-expressing cell line was established and characterized by Western blot, drug sensitivity assay and flow cytometry (data not shown). The results showed that the P-gp over-expressing cell line had biological functions.
In cellular drug accumulation assays, drug accumulation in P-gp expressing cells was compared with accumulation in cells from the parental cell line. Since the accumulation of P-gp substrates in P-gp over-expressing cells was restricted by P-gp mediated efflux of the compound back into the extracellular fluid, P-gp substrates showed less accumulation in P-gp expressing cells than in P-gp deficient cells. Similarly, drug accumulation was increased under conditions when P-gp was inhibited. In our experiment, quercetin showed less accumulation in Bcap37/MDR1 than in Bcap37. After P-gp inhibitor verapamil was administered, the concentration of this flavonoid in model cells increased. This implied the compound was a P-gp substrate. The result was similar to that of Walgren et al[19].
A high P-gp expressing cell line can be established which provides a suitable in vitro model system for studying drug intestinal absorption mechanism, predicting the drug permeability characteristics and screening new multi-drug resistant reversing agents.
Edited by Zhu LH, Wang XL Proofread by Xu FM
| 1. | Hugger ED, Novak BL, Burton PS, Audus KL, Borchardt RT. A comparison of commonly used polyethoxylated pharmaceutical excipients on their ability to inhibit P-glycoprotein activity in vitro. J Pharm Sci. 2002;91:1991-2002. |
| 2. | Schinkel AH. P-Glycoprotein, a gatekeeper in the blood-brain barrier. Adv Drug Deliv Rev. 1999;36:179-194. |
| 3. | Hochman JH, Yamazaki M, Ohe T, Lin JH. Evaluation of drug interactions with P-glycoprotein in drug discovery: in vitro assessment of the potential for drug-drug interactions with P-glycoprotein. Curr Drug Metab. 2002;3:257-273. |
| 4. | Jovanovic SV, Simic MG. Antioxidants in nutrition. Ann N Y Acad Sci. 2000;899:326-334. |
| 5. | Wiseman H. The bioavailability of non-nutrient plant factors: dietary flavonoids and phyto-oestrogens. Proc Nutr Soc. 1999;58:139-146. |
| 6. | Graefe EU, Derendorf H, Veit M. Pharmacokinetics and bioavailability of the flavonol quercetin in humans. Int J Clin Pharmacol Ther. 1999;37:219-233. |
| 7. | Lamson DW, Brignall MS. Antioxidants and cancer, part 3: quercetin. Altern Med Rev. 2000;5:196-208. |
| 8. | Kioka N, Tsubota J, Kakehi Y, Komano T, Gottesman MM, Pastan I, Ueda K. P-glycoprotein gene (MDR1) cDNA from human adrenal: normal P-glycoprotein carries Gly185 with an altered pattern of multidrug resistance. Biochem Biophys Res Commun. 1989;162:224-231. |
| 9. | Becker K, Pan D, Whitley CB. Real-time quantitative polymerase chain reaction to assess gene transfer. Hum Gene Ther. 1999;10:2559-2566. |
| 10. | Takara K, Tanigawara Y, Komada F, Nishiguchi K, Sakaeda T, Okumura K. Cellular pharmacokinetic aspects of reversal effect of itraconazole on P-glycoprotein-mediated resistance of anticancer drugs. Biol Pharm Bull. 1999;22:1355-1359. |
| 11. | Lown KS, Mayo RR, Leichtman AB, Hsiao HL, Turgeon DK, Schmiedlin-Ren P, Brown MB, Guo W, Rossi SJ, Benet LZ. Role of intestinal P-glycoprotein (mdr1) in interpatient variation in the oral bioavailability of cyclosporine. Clin Pharmacol Ther. 1997;62:248-260. |
| 12. | Shapiro AB, Ling V. Stoichiometry of coupling of rhodamine 123 transport to ATP hydrolysis by P-glycoprotein. Eur J Biochem. 1998;254:189-193. |
| 13. | Ambudkar SV, Dey S, Hrycyna CA, Ramachandra M, Pastan I, Gottesman MM. Biochemical, cellular, and pharmacological aspects of the multidrug transporter. Annu Rev Pharmacol Toxicol. 1999;39:361-398. |
| 14. | Sparreboom A, van Asperen J, Mayer U, Schinkel AH, Smit JW, Meijer DK, Borst P, Nooijen WJ, Beijnen JH, van Tellingen O. Limited oral bioavailability and active epithelial excretion of paclitaxel (Taxol) caused by P-glycoprotein in the intestine. Proc Natl Acad Sci USA. 1997;94:2031-2035. |
| 15. | Kim RB, Fromm MF, Wandel C, Leake B, Wood AJ, Roden DM, Wilkinson GR. The drug transporter P-glycoprotein limits oral absorption and brain entry of HIV-1 protease inhibitors. J Clin Invest. 1998;101:289-294. |
| 16. | Polli JW, Jarrett JL, Studenberg SD, Humphreys JE, Dennis SW, Brouwer KR, Woolley JL. Role of P-glycoprotein on the CNS disposition of amprenavir (141W94), an HIV protease inhibitor. Pharm Res. 1999;16:1206-1212. |
| 17. | Verschraagen M, Koks CH, Schellens JH, Beijnen JH. P-glycoprotein system as a determinant of drug interactions: the case of digoxin-verapamil. Pharmacol Res. 1999;40:301-306. |
| 18. | Schwarz UI, Gramatté T, Krappweis J, Oertel R, Kirch W. P-glycoprotein inhibitor erythromycin increases oral bioavailability of talinolol in humans. Int J Clin Pharmacol Ther. 2000;38:161-167. |
| 19. | Walgren RA, Walle UK, Walle T. Transport of quercetin and its glucosides across human intestinal epithelial Caco-2 cells. Biochem Pharmacol. 1998;55:1721-1727. |


