INTRODUCTION
In recent years, liver related stem cells have become a hot spot of research. One of the important findings is that liver stem cells might be derived from bone marrow. Petersen et al[1] first identified this phenomenon in rat model of liver injury. Later many researchers have reported similar in vivo and in vitro findings[2-8]. Bone marrow cells have been hypothesized as the third recruitment source in liver regeneration besides hepatocytes and endogenous liver stem cells[9].
Among bone marrow cells, there are two subsets, hemat-opoietic stem cells (HSCs) and mesenchymal stem cells (MSCs). Hepatic oval cells[10], well known endogenous liver stem cells, can express CD34[11], c-kit[12,13], Thy-1[14] and flt-3 receptor mRNA[15], all of which are markers of HSCs. So HSCs are regarded as the exact source of hepatocytes. However, some studies have found that non-hematopoietic subsets (CD45-subsets) also play such a role[7]. In this paper, we isolated two subsets of stem cells from rat bone marrow. One was MSCs, isolated and cultured by standard methods, the other was Thy-1.1+ cells, isolated and purified by magnetic activated cell sorting (MACS), which were recognized as HSCs of rats. We imitated the circumstances of liver development to define the different capacities of hepatic differentiation of the two subsets in vitro.
MATERIALS AND METHODS
Animals
Male Sprague-Dawley (SD) rats at 6-7 wk of age were obtained from Charles River China. All animal experiments were performed in accordance with the animal guidelines of Peking University Health Science Center.
Isolation and culture of MSCs from rat bone marrow
Rat bone marrow was harvested from rat femurs and tibias, and collected into Dulbecco’s modified Eagle’s medium (DMEM), filtered (40 µm), and centrifuged at 300 r/min to pellet cells. After rinsed in PBS, bone marrow cells were loaded onto 5 mL 57% Percoll (1.073 g/mL in 0.01 mol/L PBS) and centrifuged at 400 r/min for 30 min. Mononuclear cells were collected at the Percoll interface, rinsed twice in PBS, and seeded at 2 × 10 5/cm2 in 600 g/L low glucose DMEM (DMEM-LG, Sigma-Aldrich), 400 g/L MCDB-201 (Sigma-Aldrich), with 100 mL/L fetal bovine serum (FBS; Hyclone, USA) and 1000 U/mL rat leukemia inhibitory factor (rLIF; Chemicon, USA). Non-adherent cells were removed after 24 h and culture media were replaced every 3 d. After about 7 d, isolated colonies of MSCs were apparent. Then the cells were trypsinized and replated at 8000/cm2, and the cells from passage 3 were used for differentiation protocol.
Differentiation protocols
MSCs from passage 3 were seeded at 2 × 10 4/cm2 on 10 ng/mL fibronectin (FN, Sigma-Aldrich, USA) in culture medium as above. After 12 h, media were removed and cells were cultured in 600 g/L DMEM-LG, 400 g/L MCDB-201 supplemented with 50 mL/L FBS, 10-6 mol/L dexamethasone (Dex, Sigma-Aldrich, USA), 10 ng/mL epithelial growth factor (EGF, R&D, USA), 1 × insulin/transferrin/selenium (ITS, Sigma-Aldrich, USA). In some experiments, inducing growth factors were added into culture medium (20 ng/mL acid fibroblast growth factors, aFGF; 10 ng/mL basic fibroblast growth factors, bFGF; and 20 ng/mL hepatocyte growth factor, HGF). aFGF, bFGF, and HGF were all from R&D System Inc, USA.
Isolation, culture and differentiation of Thy-1.1+ stem cells from rat marrow
After Percoll gradient centrifugation, bone marrow mononuclear cells were collected, then incubated with mouse anti-rat Thy-1.1 monoclonal antibody (Serotech, UK) at 4 °C for 30 min. Unbound antibodies were removed by washing twice. Secondary marking was done by incubation with rat-anti-mouse IgG bound magnetic microbeads (MiltenyiBiotec, Germany). The positive cells were absorbed in magnetic field by Mini-MACS columns (MiltenyiBiotec, Germany). The column was removed from the magnetic field and the Thy-1.1+ cells were washed out.
Thy-1.1+ cells were cultured in differentiation media, 600 g/L DMEM-LG, 400 g/L MCDB-201 supplemented with 150 mL/L FBS, 10-6 mol/L Dex, 10 ng/mL EGF, 1 × ITS, 20 ng/mL aFGF, 10 ng/mL bFGF, and 20 ng/mL HGF. After about 7-10 d, apparent colonies of Thy-1.1+ cells appeared.
Flow cytometry determination of cell-surface antigen
The cells were resuspended in washing buffer (10 mL/L bovine serum, 2 g/L sodium azide in PBS), and stained on ice according to the manufacturer’s recommendations with the monoclonal antibodies as follows: R-PE conjugated mouse anti-rat-Thy1.1 (Pharmingen, USA), FITC conjugated mouse anti-rat-CD45 (HarlanSera-Lab, UK), PE conjugated mouse anti-rat-CD34 (Santa Cruz, USA). After washed three times with washing buffer, the stained cells were resuspended in 300 µL fixation buffer (20 g/L formaldehyde in PBS) and run on a flow cytometer (FACS Calibur, BectonDi-ckinson, USA). The results were analyzed by CellQuest software (BD, USA).
Reverse transcription-polymerase chain reaction (RT-PCR)
Total RNA was extracted by using TRIzol (Invitrogen, USA) according to the manufacturer’s instructions and quantified by UV spectroscopy. To prepare RNA for PCR analysis, 2 µg total RNA was converted to the cDNA using SuperScript II reverse transcriptase (Invitrogen, USA) with oligo (dT) (Promega, USA) and random hexamer primers (Promega, USA). PCR was performed by using Taq DNA polymerase (Gibco BRL, USA). For each gene, the DNA primers were originated from different exons to ensure that the PCR products represented the specific mRNA species and not genomic DNA. All PCR experiments were performed using a GeneAmp PCR system 2400 (Perkin-Elmer, USA).
The following specific oligonucleotide primers were used: albumin (5’-AAGGCACCCCGATTACTCCG-3’ (sense), 5’-TGCGAAGTCACCCATCACCG-3’ (antisense)), AFP (5’ - AGGCTGTACTCATCATTAAACT-3’ (sense), 5’-ATATTGTCC TGGCATTTCG-3’ (antisense)), CK18 (5’-GGACCTCAGCAAG ATCATGGC-3’(sense),5’-CCACGATCTTACGGGTAGTTG-3’ (antisense)), β-actin (5’-AGAGGGAAATCGTGCGTGAC-3’ (sense), 5’-AGGAGCCAGGGCAGTAATC-3’ (anti-sense)).
Amplification reactions were carried out for 35 cycles (25 cycles for β-actin) at 94 °C for 1 min, 58 °C for 1 min, and at 72 for 1 min for albumin; at 94 °C for 45 s, at 51 °C for 45 s and at 72 for 45 s for AFP; at 94 °C for 1 min, at 60 °C for 1 min and at 72 for 1 min for CK18 and at 94 °C for 30 s, at 55 °C for 45 s, and at 72 °C for 45 s for β-actin. The reaction products were subjected to 12 g/L agarose gel electrophoresis and visualized by ethidium bromide staining. The reaction products were 649 bp (albumin), 484 bp (AFP), 515 bp (CK18), and 353 bp (β-actin), respectively. Housekeeping gene β-actin was used as an internal control. Adult liver tissue or newborn rat liver tissue was used as a positive control.
Immunocytochemistry
Cell cultures were washed with PBS twice and fixed with 95% alcohol/acetic acid (99:1) for 10 min at room temperature, then permeabilized with 2 g/L Triton X-100 for 10 min. After washed, cells were incubated overnight at 4 °C with primary antibodies, including mouse anti-human CK18 (Sigma, USA), mouse anti-human albumin (Dako, Denmark) and goat anti-human AFP (SantaCruz, USA). Subsequently, the cells were washed with PBS three times and incubated with fluorescence labeled second antibody, FITC labeled goat anti-mouse IgG1 and rhodamine labeled donkey anti-goat IgG at 37 °C for 1 h. After washed with PBS, cells were mounted with glycerol-PBS (9:1). The cells were visualized and photomicrographed by a fluorescence microscope (Olympus Provis AX80, Japan).
RESULTS
Cell yield and shape of MSC and Thy-1.1+ cells before and after differentiation
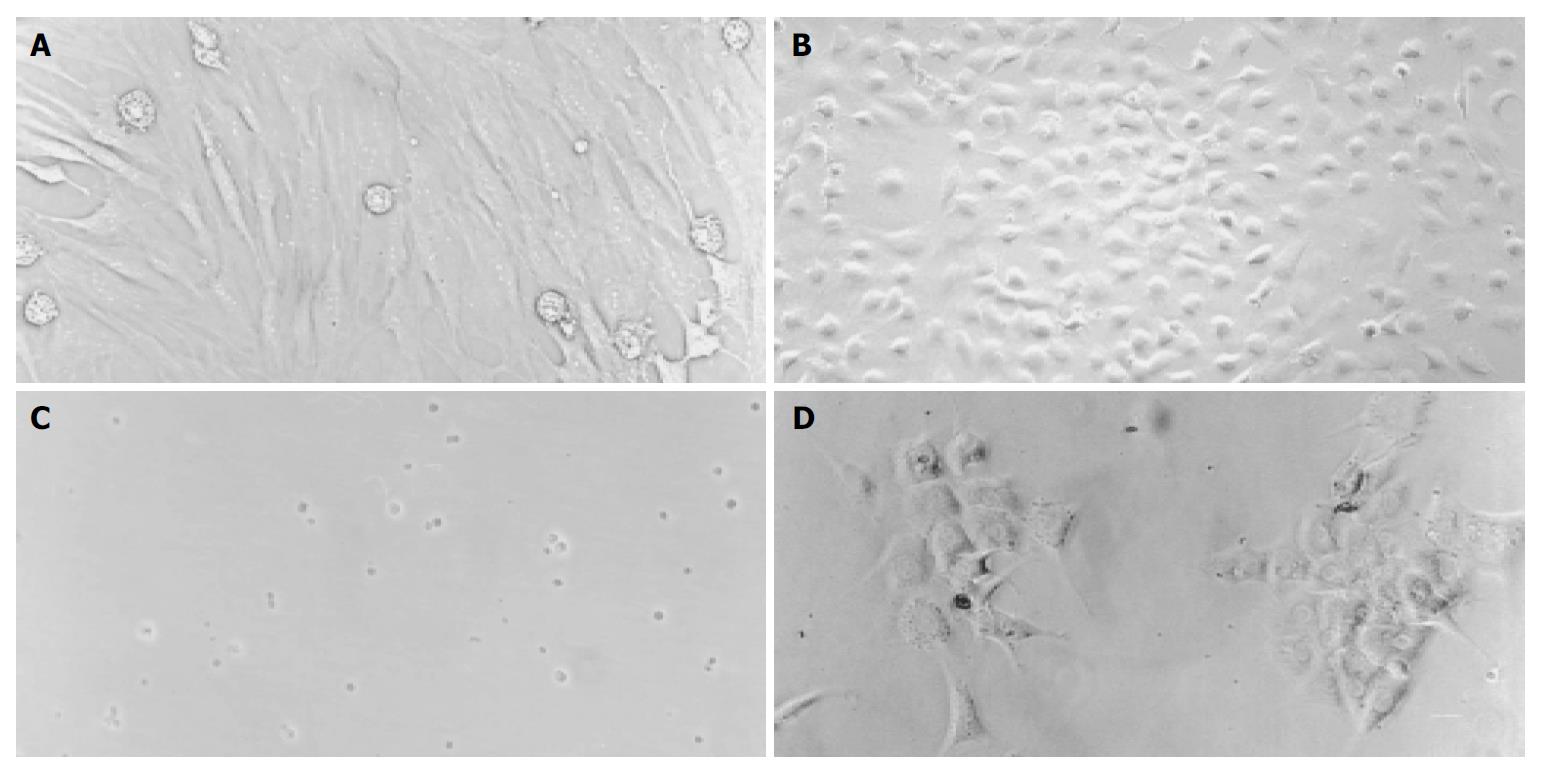
The number of mononuclear cells by 57% Percoll gradient centrifugation was about 6.44 × 10⁷ per rat. After MACS purification, the number of Thy1.1+ cells was about 2.36 × 10⁷. The recovery rate of Thy1.1+ cells from mononuclear bone marrow cells was 64.65%. Before differentiation, MSCs exhibited a fibroblastic morphology with spindle cell bodies (Figure 1 A), while after differentiation, the cells contracted obviously and were inclined to be round in shape (Figure 1 B). This change occurred early on d 4 after MSC differentiation protocol. Thy1.1+ cells were small and round in shape when freshly isolated (Figure 1 C), and became typical polygonal, much bigger in size after cultured in differentiation media (Figure 1 D).
Figure 1 A-D Cell morphology before and after differentiation (Original magnification, 200 ×).
A: Fibroblast-like MSC before differentiation, B: Round MSC after differentiation, C: Freshly isolated Thy1.1+ cells, D: Thy1.1+ cells 10 d after differentiation.
Quantitative analysis of cell-surface antigen expression
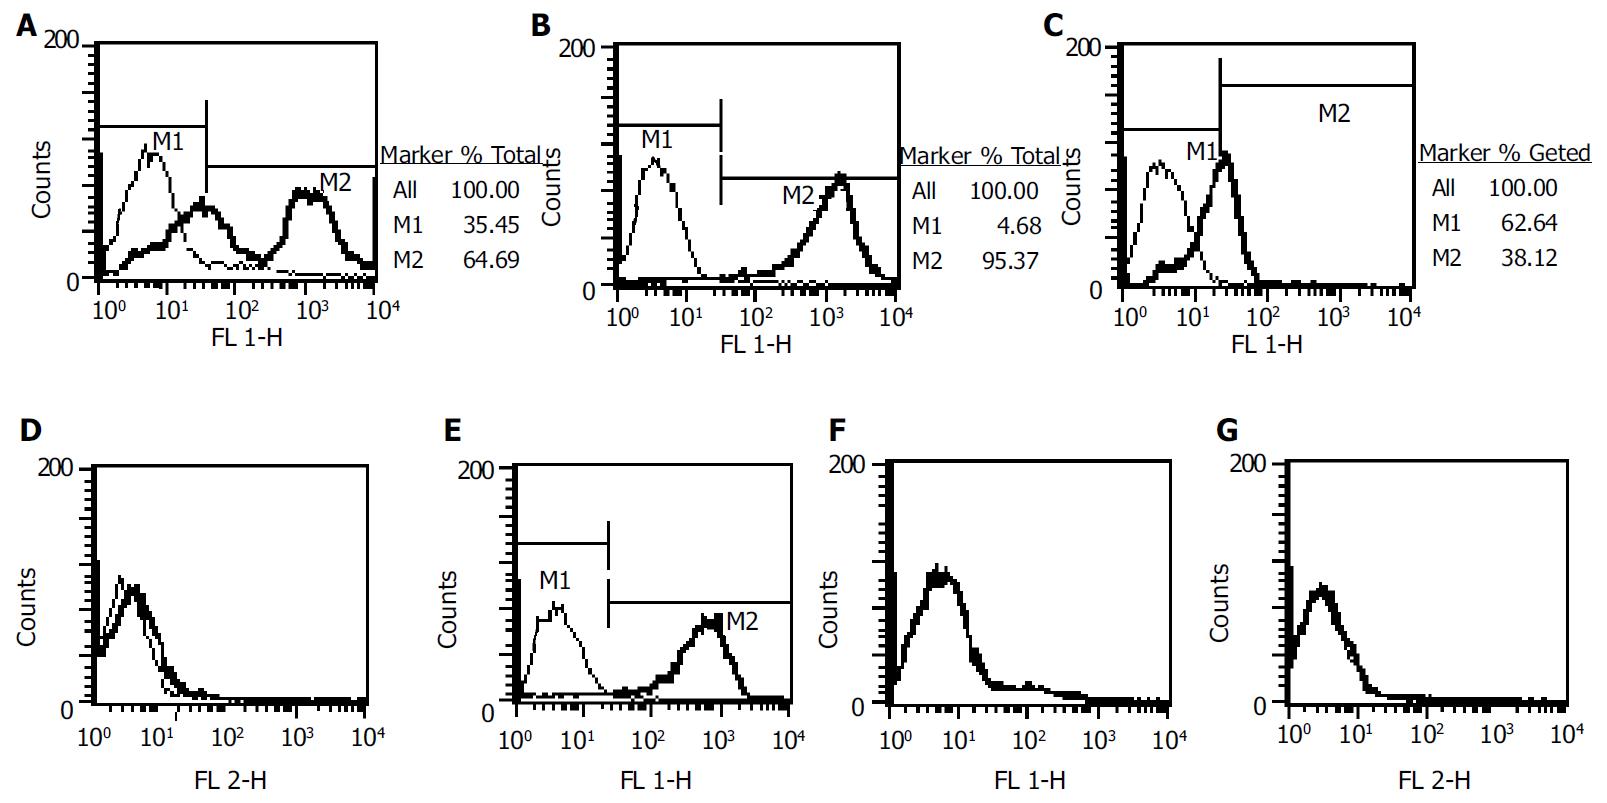
The percentage of Thy-1.1+ of rat bone marrow mononuclear cells was 56.65%. After MACS, this percentage was 93.45% in positive subset (Figure 2 A, B). Thy-1.1+ subset was CD34-, and partial CD45+ (Figure 2 C, D). The percentage of CD45 positivity in Thy-1.1+ subset was 36.68%. As displayed in Figure 2E-2G, MSC was Thy-1.1+, CD45-, CD34-.
Figure 2 Phenotype analysis of MSCs and Thy-1.
1+ cells. A: Thy-1.1 of mononuclear bone marrow cells before MACS; B, C, D: Thy-1.1, CD45, CD34 after MACS purification; E, F, G: Thy-1.1, CD45, CD34 of MSCs.
RT-PCR analysis of hepatic gene expression of CK18, albumin, and AFP
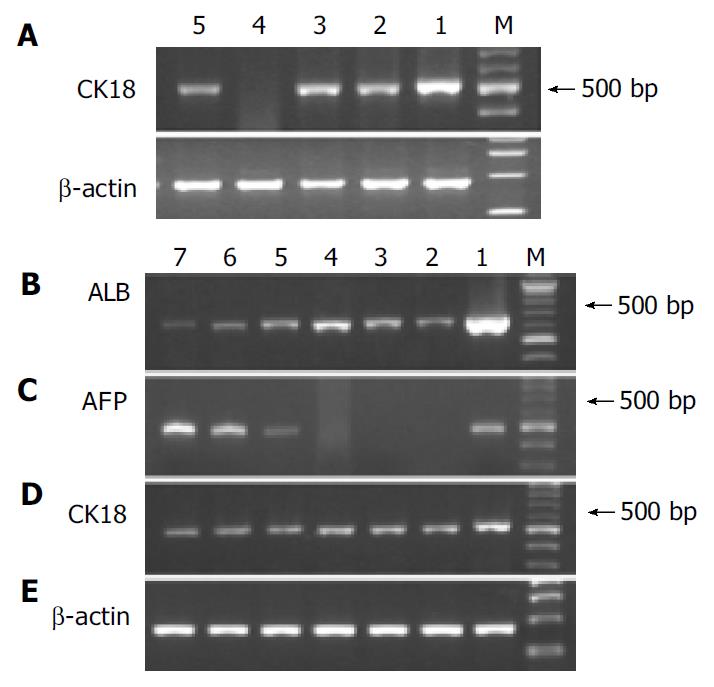
We analyzed hepatic gene expression of the cells before and after differentiation protocol. Adult rat liver or newborn rat liver tissue was used as positive control. Before differentiation, Thy-1.1+ cells showed a CK18 signal, so did MSCs. However, Thy-1.1-cells did not express CK18 (Figure 3 A). After differentiation, Thy-1.1+ cells were AFP mRNA positive and had decreased signals of albumin, while MSCs expressed albumin only and the signals of albumin increased with the extension of differentiation time (Figure 3 B, C). Both cells had a continuous CK18 expression during the process of induction (Figure 3 D).
Figure 3 RT-PCR analysis of hepatic gene expression before and after differentiation.
A: Analysis of CK18 mRNA before differentiation, lane 1: Adult liver, lane 2: Mononuclear BM cells.
Immunocytochemical analysis
MSCs showed positive staining for albumin (Figure 4 A), and Thy1. 1+ cells showed CK18 and AFP positive staining (Figure 4 B, C).
Figure 4 Immunocytofluorescence.
A: MSCs-albumin, B: Thy1.1+ cells-CK18, C: Thy1.1+ cells-AFP.
DISCUSSION
As stromal cells of bone marrow, MSCs could differentiate into cells of all mesodermal origin, including adipocytes, osteocytes, chondrocytes and myocytes[16-19], etc. Besides these, MSCs are also capable of “transdifferentiation” into ectodermal cells, such as neural cells[20,21]. So MSCs are multipotential adult stem cells. Regarding hepatic differentiation of MSCs, there has been no specific report yet. Schwartz et al[7] isolated a non-hematopoietic stem cell subset (CD45-GlyA- in humans or CD45-Ter119- in mice) from bone marrow, termed multipotent adult progenitor cells (MAPCs). MAPCs should be ascribed to MSCs, since they were copurified with MSCs at the same time[22]. Under serial conditions, Schwartz et al[7] induced MAPCs into cells with morphological, phenotypic, and functional characteristics of hepatocytes in vitro. In our study, we tried to induce standard MSCs into hepatocytes, and found hepatic specific gene CK18 was already expressed by MSCs without differentiation protocol. After induction, MSCs also expressed albumin besides CK18. Albumin mRNA appeared early on d 4 after differentiation (data not shown), coinciding with the change of morphology. Albumin signals had a gradual increase with the extension of differentiation time. Immunocytochemical staining confirmed the results of the PCR analysis at protein-level. There were no early markers of hepatocytes before or during differentiation protocol. Morphologic change of MSCs was apparent. Cell shape changed from spindle and fibroblast-like to round and epithelia-like.
HSCs are another subset of stem cells from bone marrow. A large number of papers demonstrated that HSCs could differentiate into hepatocytes or hepatocyte-like cells. Among the papers, CD34, the most general marker of HSCs in humans and mice, was used. Theise et al[2] reported 200 CD34+ marrow cells produced the same degree of hepatic engraftment as 20000 unfractionated bone marrow cells in gender mismatch bone marrow transplantation model of mice. Human investigations with G-CSF mobilized CD34+ stem cells have shown that these cells were also able to transdifferentiate into hepatocytes[23]. Thy1.1 antigen has been a well-accepted marker of rat HSCs since 1978[24]. Recently, Avital et al[25] identified a population of bone marrow-derived hepatocyte stem cells in rats, which were beta 2 microglobulin-negative and Thy-1-positive (β2m-/Thy-1+). Moreover, according to Petersen et al[26], Thy-1 is a new marker for identification of hepatic oval cells. Using Thy-1 would facilitate both in vivo and in vitro studies of hepatic oval cells. There was no colony-formation in Thy-1.1- bone marrow cells in our studies (data not shown). Thy-1.1- cells did not express CK18 mRNA when freshly isolated, while Thy-1.1+ cells had a strong CK18 expression. During hepatic differentiation, Thy-1.1+ cells expressed AFP mRNA and had a weak albumin signal. Expression of CK18 of Thy-1.1+ cells continued. The cells were polygonal in shape, exhibiting epithelial morphology.
HSCs and MSCs are two separate stem cell subsets of bone marrow. They have different functions in hematopoiesis. Previous studies have explored the ability of hepatic differentiation of different subsets from bone marrow. However, what relationship they have or what similarity or difference exists among the two subsets is unknown. Our study combined two subsets for the first time, and investigated their different abilities of hepatic differentiation simultaneously. Our results indicated that both of them had hepatic differentiation ability, however, they were different. MSCs could differentiate into mature hepatocyte-like cells, not expressing early hepatic specific genes. Under a similar induction condition, Thy-1.1+ cells were inclined to become hepatic stem cell-like cells, with a continuous AFP expression and weak albumin signal. To our interest, CK18 mRNA was positive in Thy-1.1+ cells and MSCs, negative in Thy-1.1- cells. It seemed that CK18 had some relationship with Thy-1.1 antigen, and it would be an indicative marker of hepatic differentiation ability.
Hepatic stem cells, especially bone marrow-derived hepatic stem cells may be therapeutically useful for treating a variety of diseases that affect the liver. This has been proved in some animal models[3,27]. Compared with other liver-related stem cells, such as embryonic stem cells[28], pancreatic stem cells[29], and neural stem cells, bone marrow-derived stem cells provide several advantages: (1) Bone marrow can be obtained from living donors or recipients themselves using a moderately invasive procedure. There is no problem of limited donors, which restrict liver transplantation and hepatocyte transplantation greatly. (2) Based on its ability of high self-renewal, the amplification of bone marrow stem cells could be obtained. (3) Utilizing patients’ own bone marrow or repopulation of both bone marrow and hepatic system from the same donor could avoid or reduce immunological rejection, which usually affects recipients for a life-long time.


