INTRODUCTION
Pancreatic cancer is one of the most enigmatic and aggressive malignant diseases[1-4]. It is now the fourth leading cause of cancer death in both men and women in the USA and the incidence of this disease shows no sign of decline[1-3,5]. Pancreatic cancer is characterized by a poor prognosis and lack of effective response to conventional therapy[6]. The 5-year survival rate is less than 4% and the median survival period after diagnosis is less than 6 months[7,8]. At present, surgical resection is still the only effective treatment option, but only about 15% of carcinomas of the head of pancreas are resectable and there are few long-term survivors even after apparent curative resection[7,8]. On the other hand, chemotherapy or radiation therapy provide only limited palliation, without meaningful improvement of survival in patients with non-resectable pancreatic cancer[7-9]. Only new therapeutic strategies can improve this dismal situation[10,11] .
A series of prospective and case-control studies have shown an association between higher fish intake and reduced cancer incidence, and other benefits including inhibition of cancer cell proliferation, induction of apoptosis[12-22]. Recent studies indicate that diets containing a high proportion of long-chain n-3 polyunsaturated fatty acids was associated with inhibition of growth and metastasis of human cancer including pancreatic cancer[12,14,23,24]. Diets rich in linoleic acid (LA), an n-6 fatty acid, stimulate the progression of human cancer cell in athymic nude mice, whereas supplement of fish oil components, docosahexaenoic acid (DHA) and eicosapentaenoic acid (EPA) exerts suppressive effects. Fish oil has been shown to reduce the induction of different cancer in animal models by a mechanism which may involve suppression of mitosis, increase apoptosis through long-chain n-3 polyunsaturated fatty acid EPA[12,14,25-27]. In parallel, dietary supplementation with DHA is accompanied by reduced levels of 12- and 15-hydroxyeicosatetraenoic acids (12- and 15-HETE), suggesting that changes in eicosanoid biosynthesis may have been responsible for the observed decrease in tumor growth[14,16,28,29]. Previous studies also have shown that the anti-cancer effect of fish oil is accompanied by a decreased production of cyclooxygenase and lipoxygenase metabolites[10,30,31]. The efficacy of fish oil which we have found exhibits particularly potent anticancer effects that appear to be related to its content of lipoxygenase inhibitors rather than its EPA or DHA contents. Red oil A5 is lipid isolates from the epithelial layer of the echinoderm. This oil is non-toxic and exerts a marked anti-inflammatory effect in laboratory animals. Red oil A5 almost totally inhibits pancreatic cancer cell proliferation at dilutions of up to 1:32 000. The inhibition of proliferation induced by this fish oil is accompanied by marked induction of apoptosis. To date, no information is available regarding the effects of red oil A5 in pancreatic cancer. In the present study, the effects of red oil A5 on proliferation, apoptosis and cell cycle distribution were investigated in pancreatic cancer cells.
MATERIALS AND METHODS
Pancreatic cancer cell lines
The human pancreatic cancer cell lines (AsPC-1, MiaPaCa-2 and S2013) were purchased from the American Type Culture Collection (Rockville, MD, USA). These cell lines span the types of differentiation in human pancreatic adenocarcinomas. AsPC-1 and MiaPaCa-2 are poorly- differentiated, whereas S2013 is well-differentiated but heterogenous.
The cells were cultured in Dulbecco’s Modified Eagle’s Medium (DMEM) (obtained from Sigma, St. Louis, MO) supplemented with penicillin G (100 U/mL), streptomycin (100 U/mL) and 10% Fetal Bovine Serum (FBS) (purchased from Atlanta Biologicals, Atlanta, GA) in humidified air with 5% CO2 at 37 °C. The cells were harvested by incubation in trypsin-EDTA (obtained from Sigma, St. Louis, MO) solution for 10-15 minutes. Then the cells were centrifuged at × 300 g for 5 minutes and the cell pellets suspended in fresh culture medium prior to seeding into culture flasks or plates.
Red oil A5
Red oil A5 (Coastside Research Chemical Co.) was dissolved in 1:2 DMEM as a stock solution. The stock solution was diluted to the appropriate concentrations with serum-free medium prior to the experiments.
Cell proliferation assay
Cell proliferation was analyzed by the 3H-methyl thymidine (from Amersham Inc., Arlington Heights, IL) incorporation and cell counting. Following treatment of pancreatic cancer cells with a series of concentrations of red oil A5 from 1:64 000 to 1:4 000 for 24 hours, and following treatment of pancreatic cancer cells with 1:32 000 red oil A5 for 6, 12 and 24 hours, cellular DNA synthesis was assayed by adding 3H-methyl thymidine 0.5 μCi/well. After a 2 hour incubation, the cells were washed twice with PBS, precipitated with 10% TCA for two hours and solublized from each well with 0.5 ml of 0.4 N sodium hydroxide. Incorporation of 3H-methyl thymidine into DNA was measured by adding scintillation cocktail and counting in a scintillation counter (LSC1414 WinSpectral, Wallac, Turku, Finland). For cell counting, the cells were seeded in 12-well plates and cultured in serum-free medium for 24 hours prior to red oil A5 treatment and then switched to serum-free medium with or without 1:32 000 red oil A5 for the respective treatment times (24, 48, 72 and 96 hours). The cells were removed from the plates by trypsinization to produce a single cell suspension for cell counting. The cells were counted using Z1-Coulter Counter (Luton, UK).
Analysis of cellular DNA content by flow cytometry
The cells were grown at 50%-60% confluence in T75 flasks, serum-starved for 24 hours and then treated with 1:32 000 red oil A5 for 24 hours. At the end of the treatment, the cells were harvested with trypsin-EDTA solution to produce a single cell suspension. The cells were then pelleted by centrifugation and washed twice with PBS. Then the cell pellets were suspended in 0.5 ml PBS and fixed in 5 mL ice-cold 70 % ethanol at 4 °C. The fixed cells were centrifuged at 300 × g for 10 minutes and the pellets were washed with PBS. After resuspension with 1 ml PBS, the cells were incubated with 10 μL of RNase I (10 mg/mL) and 100 μL of propidium iodide (400 μg/mL; Sigma) and shaken for 1 hour at 37 °C in the dark. Samples were analyzed by flow cytometry. The red fluorescence of single events was recorded using a laser beam at 488 nm excitation λ with 610 nm as emission λ, to measure the DNA index.
Terminal deoxynucleotidyl transferase-mediated deoxyuridine triphosphate nick-end labeling (TUNEL) assay
TUNEL assay kits were purchased from Pharmingen and PARP antibody from BioMol. The assay was carried out for terminal incorporation of fluorescein 12-dUTP by terminal deoxynucleotidyl transferase into fragmented DNA, in pancreatic cells. Cells grown in T75 flasks were cultured in serum-free conditions for 24 hours and then treated with or without 1:32 000 red oil A5 for 24 hours. The cells were then trypsinized and fixed in 1% ethanol-free formaldehyde-PBS for 15 minutes. The cells were incubated with the enzyme substrate mixture with the addition of 20 mM EDTA and then counterstained with 5 μg/mL propidium iodide in PBS containing 0.5 mg/mL DNase-free RNase A, in the dark for 30 minutes. Laser flow cytometry was used to quantify the green fluorescence of fluorescein-12-dUDP incorporated against the red fluorescence of propidium iodide.
Preparation of cytosolic and mitochondrial extraction
Mitochondria/Cytosol Fractionation Kit was purchased from BioVision (Mountain View, CA94043, USA). Cells (5 × 10⁷) were collected by centrifugation at 600 × g for 5 minutes at 4 °Cfrom control and red oil A5-treated AsPC-1, MiaPaCa-2 and S2013 cells. Wash the cells with ice-cold PBS twice. Centrifuge at 600 × g for 5 minutes at 4 °C. Remove the supernatant and resuspend the cells with 1.0 mL of 1 × Cytosol Extraction Buffer Mix containing DTT and Protease Inhibitors. Incubate on ice for 10 minutes. Homogenize the cells in an ice-cold dounce tissue grinder (45 strokes) until 70%-80% of the nuclei do not have the shiny ring. Transfer the homogenate to a 1.5 mL microcentrifuge tube, and centrifuge at 700 × g for 10 minutes at 4 °C. Transfer the supernatant to a fresh 1.5 mL tube, and centrifuge at 10 000 × g for 30 minutes at 4 °C. Collect the supernatant as cytosolic fraction. Resuspend the pellet in 0.1 mL Mitochondrial Extraction Buffer Mix containing DTT and Protease inhibitors, vertex for 10 seconds and save as Mitochondrial Fraction. Both cytosolic fraction and mitochondrial fraction were stored at -80 °C until ready for Western blot.
Western blot
Cells were seeded into flasks and grown to 50% to 60% confluence for 24 hours. The cells were then placed in serum-free medium with or without 1:32 000 red oil A5 for a period of 24 hours. In the end, the attached cells and floating cells were extracted in lysis buffer [20 mM Tris-HCl (pH 7.4), 2 mM sodium vanadate, 1.0 mM sodium fluoride, 100 mM NaCl, 2.0 mM phosphate substrate, 1% NP40, 0.5% sodium deoxycholate, 20 μg/mL each aprotinin and leupeptin, 25.0 μg/mL pepstatin, and 2.0 mM each EDTA and EGTA] for further analysis. Protein concentrations were determined using the bicinchoninic acid assay with BSA as standard. Western blot was carried out using standard techniques. Briefly, equal amounts of proteins in each sample were resolved in 10% sodium dodecyl sulfate polyacrylamide gel electrophoresis (SDS-PAGE) and the proteins transferred onto nitrocellulose membranes. After blocking with non-fat dried milk, the membranes were incubated with the appropriate dilution of primary antibody (Santa Cruz Biotech, Santa Cruz, CA, USA). The membranes were then incubated with a horseradish peroxidase-conjugated secondary antibody. The proteins were detected by an enhanced chemiluminescence detection system (Santa Cruz Biotech), and light emission was captured on Kodak X-ray films (Eastman Kodak Company, Rochester, NY). The rabbit polyclonal antibody against cytochrome c and caspase-3, and the mouse monoclonal antibody against PARP were also purchased from Santa Cruz Biotech.
Statistical analysis
The data was analyzed by analysis of variance (ANOVA) with Bonferonni’s or Dunnet’s multiple comparison post-test for significance between each two groups. This analysis was performed with the Prism software package (GraphPad, San Giego, CA, USA). The data were expressed as mean ± SEM and represented at least 3 different experiments.
RESULTS
Effect of red oil A5 on thymidine incorporation in pancreatic cancer cells
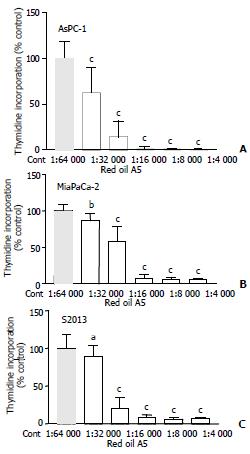
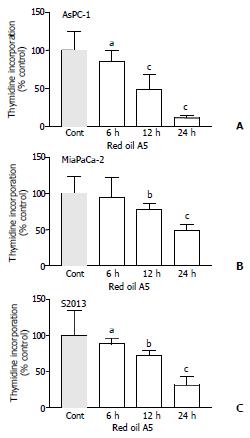
Red oil A5 caused marked, concentration-dependent inhibition of thymidine incorporation in AsPC-1, MiaPaCa-2 and S2013 cells, at concentrations ranging from 1:64 000 to 1:4 000 (ANVOA, AsPC-1: F(5,23) = 86.99, P < 0.0001; MiaPaCa-2: F(5,23) = 92.63, P < 0.0001; S2013: F(5, 23) = 94.94, P < 0.0001 (Figure 1). The red oil A5-induced inhibition of proliferation was also time-dependent (ANOVA, AsPC-1: F(3,11) = 89.88, P < 0.0001; MiaPaCa-2: F(3,11) = 53.64, P < 0.0001; S2013: F (3,11) = 80.06, P < 0.0001 (Figure 2).
Figure 1 (A,B,C) Effect of different concentrations of red oil A5 on proliferation of three pancreatic cancer cell lines, AsPC-1, MiaPaCa-2 and S2013, as measured by 3H-methyl thymidine incorporation.
Results are expressed as % of control from three separate experiments. aP < 0.05, bP < 0.01, cP < 0.001 vs control.
Figure 2 (A,B,C) Time-dependent effects of 1:32 000 red oil A5 on proliferation of three pancreatic cancer cell lines, AsPC-1, MiaPaCa-2 and S2013, as measured by 3H-methyl thymidine incorporation at 6, 12 and 24 hours.
The results are expressed as % of control from three separate experiments. aP < 0.05, bP < 0.01, cP < 0.001 vs control.
Effect of red oil A5 on pancreatic cancer cell proliferation measured by cell counting
Red oil A5 induced significant time dependent inhibition of pancreatic cancer cell growth, as measured by the cell number in AsPC-1, MiaPaCa-2 and S2013 cells (two-way ANOVA, AsPC-1: F(4,29) = 49.54, P < 0.0001; MiaPaCa-2: F(4,29) = 43.48, P < 0.0001; S2013: F(4,29) = 39.25, P < 0.0001. During the first 24 hours, no obvious effects were seen compared to controls. At 48, 72, and 96 hours, red oil A5 resulted in a marked and progressive decrease in cell number compared to control (Figure 3).
Figure 3 (A,B,C) Time-course effects of 1:32 000 red oil A5 on cell number in AsPC-1, MiaPaCa-2 and S2013 cells from 24 to 96 hours.
The data represent mean ± SEM of three separate experiments. aP < 0.05, bP < 0.01, cP < 0.001 vs control.
Effect of red oil A5 on cell cycle phase distribution
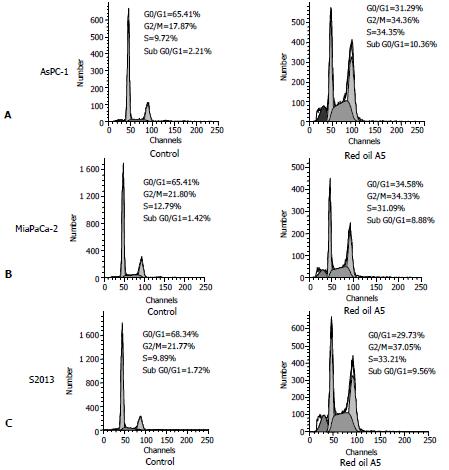
To understand the mechanism of inhibition of cell proliferation, the distribution of cell cycle phases was analyzed following treatment with 1:32 000 red oil A5 for 24 hours. The cells were accumulated in the G2/M-phase in AsPC-1, MiaPaCa-2 and S2013 cell lines. The number of the cells in S-phase was increased also in all three cell lines when compared to control. A peak of the sub-G0/G1 cell population, a hallmark of apoptosis, was seen following 24 hours, exposure in all three cell lines (Figure 4).
Figure 4 (A,B,C) Flow-cytometric analysis of cellular DNA content in control and red oil A5 treated AsPC-1, MiaPaCa-2 and S2013 cells, stained with propidium iodide.
The cells were treated with 1:32000 red oil A5 in serum-free conditions for 24 hours. The distribution of cell cycle phases is expressed as % of total cells. Results were representative of three separate experiments.
Apoptosis of pancreatic cancer cells induced by red oil A5
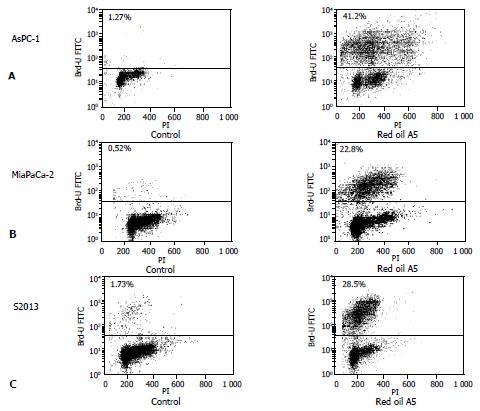
To characterize the observed apoptosis, analysis of DNA fragmentation was carried out using the TUNEL assay. TUNEL staining of pancreatic cancer cells was markedly increased by 1:32 000 red oil A5 treatment for 24 hours (Figure 5).
Figure 5 (A,B,C) TUNEL assay of red oil A5-induced pancreatic cancer cell apoptosis.
Dot plot shows TdT-mediated dUTP nick-end labeling of control cells and cells treated with 1:32 000 red oil A5 which is expressed as % of total cells. The increases in fluorescence events in the upper panels are due to UTP labeling of fragmented DNA. The results are representative of three different experiments.
Red oil A5 induced cytochrome C release
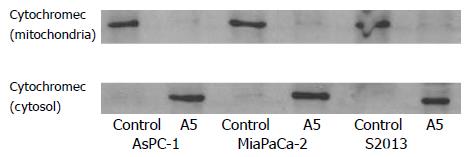
Cytochrome c is a mitochondrial protein that is released from the mitochondria to cytosol during apoptosis when mitochondrial membrane permeability is disrupted. An increase in the amount of cytochrome c in the cytosolic fraction was seen in all three cell lines, AsPC-1, MiaPaCa-2 and S2013 after red oil A5 treatment. Meanwhile, a decrease in the amount of cytochrome c in the mitochondrial fraction was seen in all three cell lines after red oil A5 treatment (Figure 6).
Figure 6 Western blot of the cytochrome c protein in AsPC-1, MiaPaCa-2 and S2013 cells treated with 1:32 000 red oil A5 for 24 hours.
Proteins in cytosolic fraction and in mitochondrial fraction are extracted. Proteins extracted from each sample are electrophoresed on an SDS-PAGE gel and then are transferred to nitrocellulose membranes. Cytochrome c is identified using a monoclonal cytochrome c antibody. The results are repre-sentative of three different experiments.
Effect of red oil A5 on activation of caspase-3 and cleavage of PARP
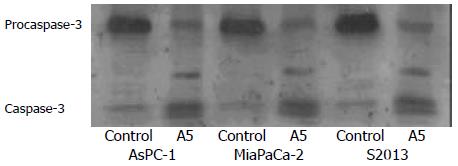
The expression and activation of caspase-3 by cleavage as well as the specific cleavage of its downstream substrate, PARP during apoptosis were observed by Western blotting. The 32 kDa procaspase-3 was cleaved into products of lower molecular weight, including a band corresponding to the 17 kDa active form. The uncleaved 116 kDa proform of PARP and its active 85 kDa cleaved fragment were detected. Both caspase-3 activation and PARP cleavage were induced and coincident with the induction of apoptosis (Figure 7,Figure 8).
Figure 7 Western blot of the caspase-3 protein in AsPC-1, MiaPaCa-2 and S2013 cells are treated with 1:32 000 red oil A5 for 24 hours.
Proteins in the whole cellular lysates are electro-phoresed on an SDS-PAGE gel and then transferred to nitro-cellulose membranes. Caspase-3 is identified using a specific antibody. The results are representative of three different experiments.
Figure 8 Western blot of poly-ADP ribose polymerase (PARP) protein in AsPC-1, MiaPaCa-2 and S2013 cells are treated with 1:32 000 red oil A5 for 24 hours.
Proteins in whole cellular lysates are separated by electrophoresis on SDS-PAGE gels and then are transferred to nitrocellulose membranes. PARP is iden-tified using a monoclonal antibody. The results are represen-tative of three different experiments.
DISCUSSION
Because of its significant medical properties, fish oil has been used for many years. The experimental results in the present study indicate that red oil A5 inhibits proliferation and induces apoptosis in pancreatic cancer cells.
In preliminary experiments, we tested a series of concentrations of red oil A5 ranging from 1:64 000 to 1:4 000. At low concentrations, red oil A5 inhibited growth and induced apoptosis in a concentration-dependent and time-dependent manner in all three cell lines tested. Because 1:32 000 red oil A5 inhibited 3H-methyl thymidine incorporation into DNA by about 30%-50% in 24 hours, we tested this concentration on cell proliferation by cell counting over a longer time period (24 to 96 hours). The results revealed profound inhibition that was time-dependent.
To better understand the effect of red oil A5 on the proliferation of pancreatic cancer cells, flow cytometric analysis of propidium iodide-stained cells and TUNEL assay were carried out. Cytometric analysis showed that cells were accumulated in the G2/M-phase and S-phase in all three cell lines at 24 hours, compared to control. These cell cycle changes suggested that pancreatic cancer cells underwent an oxidative stress response to red oil A5, with DNA damage leading to apoptosis. Because the effects of red oil A5 persisted throughout the course of cell proliferation, cells with DNA damage increased progressively and developed apoptosis successively. Therefore, the sub-G0/G1 cell population typical of apoptosis was observed after 24-hour treatment with red oil A5. At the late stages of apoptosis, genomic DNA was cleaved in fragments following activation of endonucleases. The TUNEL assay used attachment of a fluorescent indicator to identify DNA fragments in apoptotic cells. The TUNEL assay results showed marked apoptosis in all the cell lines tested.
Red oil A5 induces cytochrome c release from the mitochondria to cytosol. Caspases are cysteine proteases produced as inactive forms and activated during apoptosis. Apoptosis in pancreatic cancer cells is mitochondria dependent as evidenced by release of cytochrome c into the cytosol[32]. Caspases induce cytochrome c release from mitochondria by activating cytosolic factors[33]. Once cytochrome c is released from the mitochondria, it complexes with apoptosis, apoptotic protease-activating factor 1 to activate caspase-3[34-37]. Casepase-3 is the most important executer in the apoptotic process. Caspase-3 plays an important role in the apoptotic program of cells[38-44]. The present experiment shows that caspase-3 is activated by cleavage of procaspase during apoptosis of pancrestic cancer cells induced by red oil A5. Furthermore red oil A5 also causes specific activation by cleavage of the caspase-3 substrate, PARP provides further evidence of apoptosis. PARP, a nuclear protein implicated in DNA repair, is one of the earliest proteins targeted for a specific cleavage to the signature 85-kDa fragment during apoptosis. PARP cleavage can serve as a sensitive parameter for identification of early apoptosis[45,46].
Induction of cancer cell apoptosis, without affecting healthy cells or producing side-effects, is a major goal for development of new therapeutic agents. Our findings indicate that red oil A5 has a potent anti-proliferative effect on human pancreatic cancer cells with induction of apoptosis.


