Copyright
©The Author(s) 2003.
World J Gastroenterol. Jun 15, 2003; 9(6): 1342-1346
Published online Jun 15, 2003. doi: 10.3748/wjg.v9.i6.1342
Published online Jun 15, 2003. doi: 10.3748/wjg.v9.i6.1342
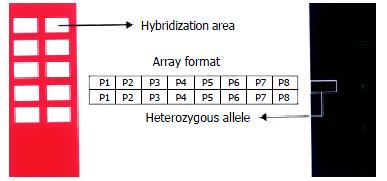
Figure 3 Array format and microarray hybridization result of 10 samples.
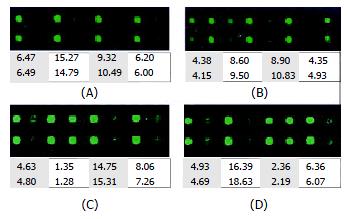
Figure 1 The TIF image of hybridization results of (A) wildtype template, (B) mutant template, (C) heterozygous template of CYP2C9*1/CYP2C9*3, and (D) heterozygous template of CYP2C9*1/CYP2C9*4.
The discriminating power of a pair of probes was represented by the ratio of match to mismatch listed below.
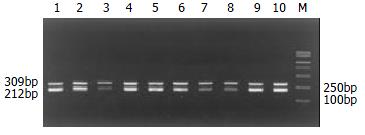
Figure 2 2% agarose gel electrophoresis of the PCR products of 10 samples.
1-10: PCR products of 10 DNA samples, M: DGL2000 marker.
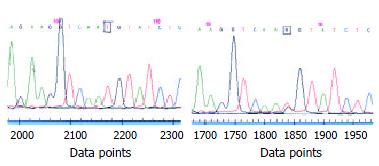
Figure 4 Part of the sequencing results.
The letters in square indicate wildtype and heterozygous of CYP2C9*1/CYP2C9*3(1075A-C) in two samples.
- Citation: Wen SY, Wang H, Sun OJ, Wang SQ. Rapid detection of the known SNPs of CYP2C9 using oligonucleotide microarray. World J Gastroenterol 2003; 9(6): 1342-1346
- URL: https://www.wjgnet.com/1007-9327/full/v9/i6/1342.htm
- DOI: https://dx.doi.org/10.3748/wjg.v9.i6.1342


