Copyright
©The Author(s) 2003.
World J Gastroenterol. Jun 15, 2003; 9(6): 1220-1226
Published online Jun 15, 2003. doi: 10.3748/wjg.v9.i6.1220
Published online Jun 15, 2003. doi: 10.3748/wjg.v9.i6.1220
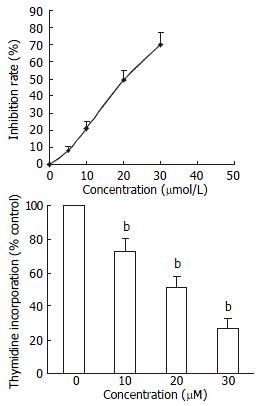
Figure 1 Effect of TGZ on growth of HepG2 cells.
HepG2 cells were incubated with various concentrations of TGZ for 48 h: (A) MTT assay; (B) [3H] thymidine uptake assay. The value was represented as mean ± SEM (n = 3). bP < 0.01 versus corresponding control group.
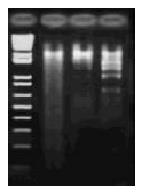
Figure 2 DNA ladder pattern formation in HepG2 cells after treatment with TGZ.
Cells were treated with TGZ for 48 h and the formation of oligonucleosomal fragments was determined by 1.5% agarose gel electrophoresis: M) DNA markers; 1) control; 2) 10 μM TGZ; 3) 30 μM TGZ.
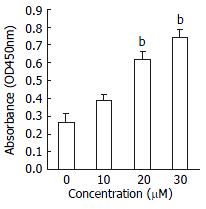
Figure 3 DNA fragmentation by ELISA assay, as measured by absorbance (OD 450 values).
HepG2 cells cultured for 48 h in the presence of TGZ resulted in dose dependent DNA fragmentation. aP < 0.05, bP < 0.01 compared to respective control.
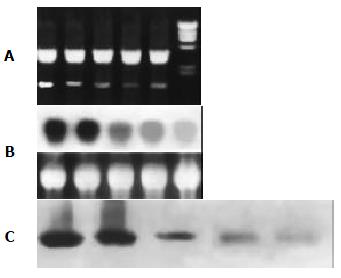
Figure 4 Effect of TGZ on the expression of COX-2 mRNA and protein in human liver cancer cell line HepG2 cells: (A) RT-PCR; (B) Northern blot; (C): Western blot.
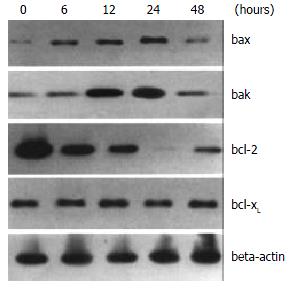
Figure 5 Effects of TGZ on the levels of bcl-2, bcl-xL, bax and bak proteins in HepG2 cells at indicated time.
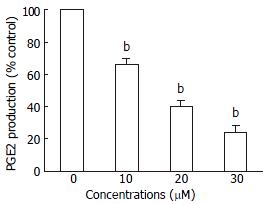
Figure 6 Effect of TGZ on the production of PGE2.
The value was represented as mean ± SEM (n = 3). bP < 0.01 compared to respective control.
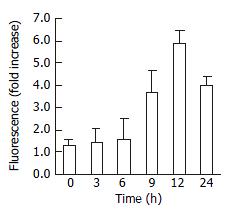
Figure 7 Effect of TGZ on the activity of caspase-3.
The value was represented as mean ± SEM (n = 3).
- Citation: Li MY, Deng H, Zhao JM, Dai D, Tan XY. PPARγ pathway activation results in apoptosis and COX-2 inhibition in HepG2 cells. World J Gastroenterol 2003; 9(6): 1220-1226
- URL: https://www.wjgnet.com/1007-9327/full/v9/i6/1220.htm
- DOI: https://dx.doi.org/10.3748/wjg.v9.i6.1220


