Copyright
©The Author(s) 2003.
World J Gastroenterol. Mar 15, 2003; 9(3): 584-589
Published online Mar 15, 2003. doi: 10.3748/wjg.v9.i3.584
Published online Mar 15, 2003. doi: 10.3748/wjg.v9.i3.584
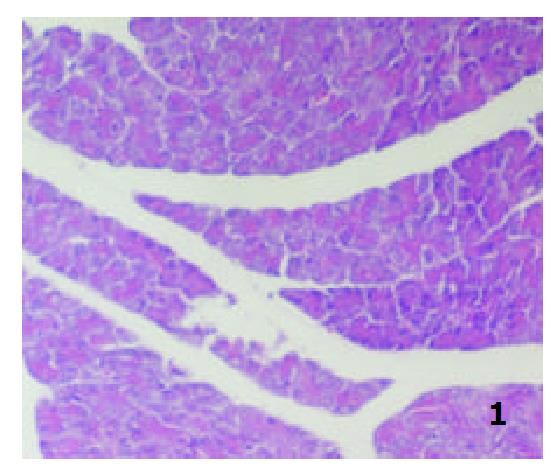
Figure 1 In the LPS group, the pancreas was slightly edemamous.
×100.
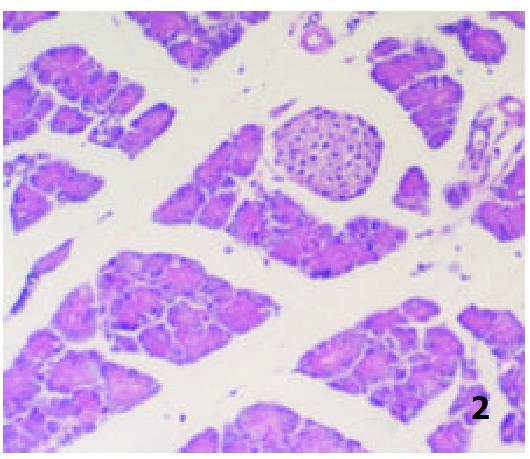
Figure 2 Microscopic section of the pancreas from the Cn group, showing the features of acute edematous pancreatitis notably interstitial edema.
×100.
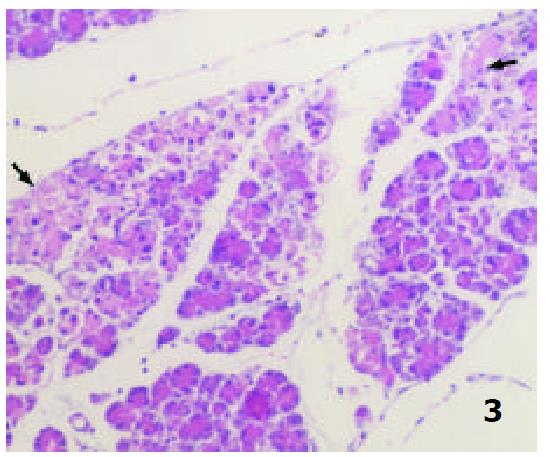
Figure 3 In the Cn+LPS group, more diffuse focal areas of nonviable pancreatic parenchyma appeared obviously.
×100.
Figure 4 The histological change of the exo-pancreatic organs in the Cn+LPS group.
A: Renal cells were swollen; ×100; B: The vacuoliza-tion of liver cells; ×400; C: A lot of erythrocyte and inflammatory cells also infiltrated in the cavity of pulmonary alveolus. ×100.
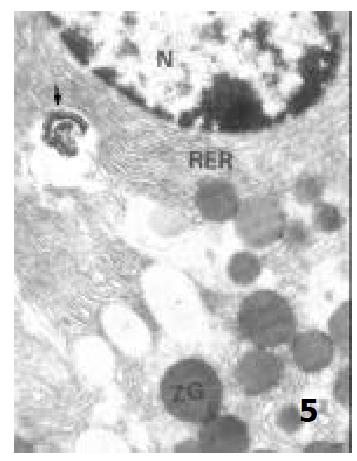
Figure 5 A few cytoplastic vacuoles formed in acinar cells in the LPS group.
× 10000.
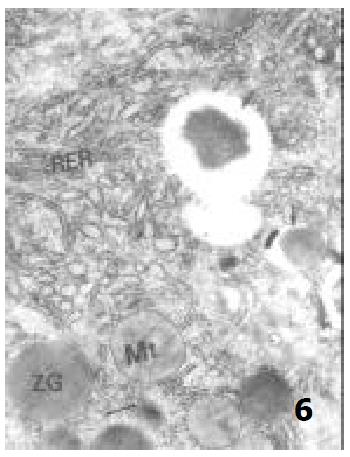
Figure 6 In the Cn group, a few cytoplastic vacuoles in acinar cell appeared, and ZGs were decreased in number.
The RER and the mitochondria was slightly swollen. × 10000.
Figure 7 The ultrastructure change of the pancreatic acinus in the Cn+LPS group.
A: Chromatin margination of nuclei was present, the swollen mitochondria appeared; × 7000; B: the number of vacuoles greatly increased and their volume also greatly increased; × 7000; C: the endoplasmic reticulum exhibited whorls; × 14000; D: The crista of mitochondria was decreased or disappeared. × 20000.
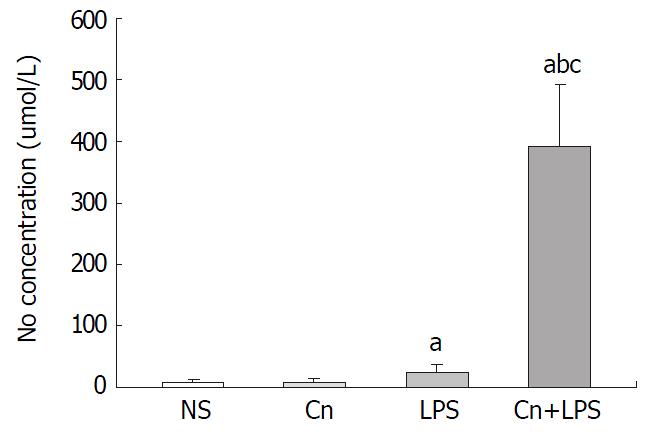
Figure 8 Comparison of NO concentration between groups(-x±s) (n = 8).
aP < 0.01, vs NS group; bP < 0.01, vs LPS group; cP < 0.05,vs Cn group.
- Citation: Ding SP, Li JC, Jin C. A mouse model of severe acute pancreatitis induced with caerulein and lipopolysaccharide. World J Gastroenterol 2003; 9(3): 584-589
- URL: https://www.wjgnet.com/1007-9327/full/v9/i3/584.htm
- DOI: https://dx.doi.org/10.3748/wjg.v9.i3.584


