Copyright
©The Author(s) 2003.
World J Gastroenterol. Mar 15, 2003; 9(3): 485-490
Published online Mar 15, 2003. doi: 10.3748/wjg.v9.i3.485
Published online Mar 15, 2003. doi: 10.3748/wjg.v9.i3.485
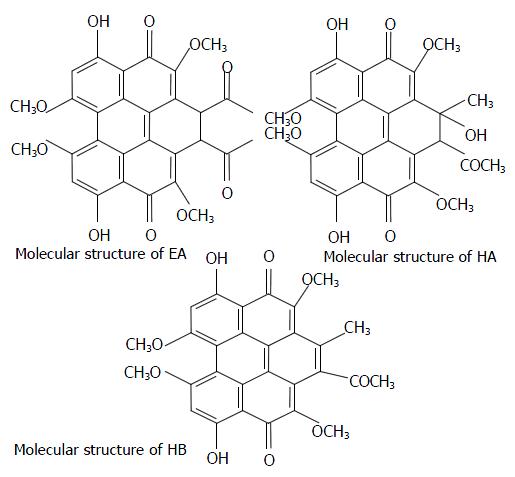
Figure 1 Structures of the three perylenequinones for photodynamic activity.
Figure 2 Photodependent cytotoxic effects of EA on R366.
4 ES cells at various concentrations: (1) 10-7 Mol/L, (2) 10-6 Mol/L, (3) 10-5 Mol/L, (4) 10-4 Mol/L, (5) 10-3 Mol/L respectively. Results are means ± SD of three independent experiments.
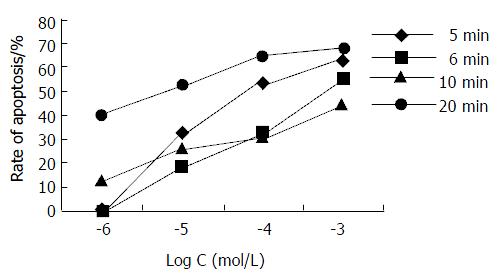
Figure 3 Dose-dependent relationship between EA doses and rate of Hce-8693 cell apoptosis.
Cells were incubated for 2 h with 1 × 10⁻⁶ Mol/L, 1 × 10⁻⁵ Mol/L, 1 × 10⁻⁴ Mol/L, 1 × 10⁻³ Mol/L EA photosensitizer respectively and then irradiated. Results are means ± SD of three independent experiments.
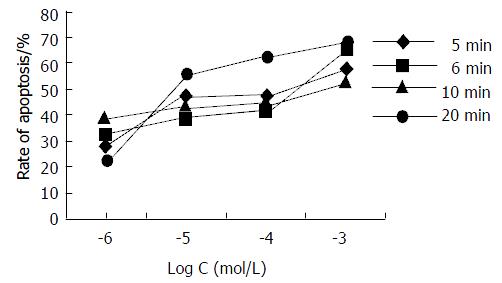
Figure 4 Dose-dependent relationship between HA doses and rate of Hce-8693 cell apoptosis.
Cells were incubated for 2 h with 1 × 10⁻⁶ Mol/L, 1 × 10⁻⁵ Mol/L, 1 × 10⁻⁴ Mol/L, 1 × 10⁻³ Mol/L HA photosensitizer respectively and then irradiated. Results are means ± SD of three independent experiments.
Figure 5 Dose-dependent relationship between HB doses and rate of Hce-8693 cell apoptosis.
Cells were incubated for 2 h with 1 × 10⁻⁶ Mol/L, 1 × 10⁻⁵ Mol/L, 1 × 10⁻⁴ Mol/L, 1 × 10⁻³ Mol/L HB photosensitizer respectively and then irradiated. Results were means ± SD of three independent experiments.
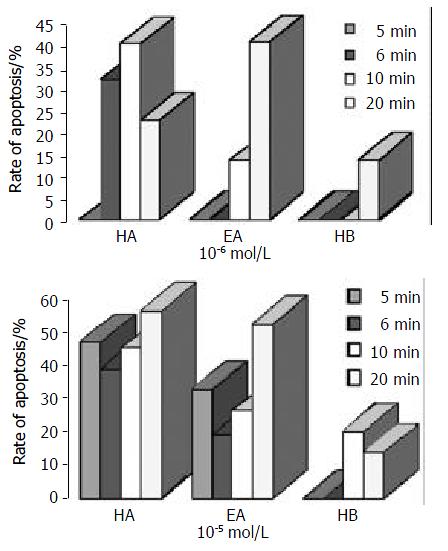
Figure 6 (a)-(b) illustrated the different antiproliferative effects of photoactivated HA, EA and HB on human Hce-8693 cells.
- Citation: Ma L, Hong T, Li C, Zhang Y, Wang ZH, Ji WZ. Photodynamic inhibitory effects of three perylenequinones on human colorectal carcinoma cell line and primate embryonic stem cell line. World J Gastroenterol 2003; 9(3): 485-490
- URL: https://www.wjgnet.com/1007-9327/full/v9/i3/485.htm
- DOI: https://dx.doi.org/10.3748/wjg.v9.i3.485


