Copyright
©The Author(s) 2003.
World J Gastroenterol. Mar 15, 2003; 9(3): 392-398
Published online Mar 15, 2003. doi: 10.3748/wjg.v9.i3.392
Published online Mar 15, 2003. doi: 10.3748/wjg.v9.i3.392
Figure 1 Different expression of EMP-1 detected in matched pairs of esophageal cancer tissue.
The upper band represents EMP-1 (702 bp); the lower band represents GAPDH (452 bp). The expression of EMP-1 is higher in normal (N) tissue than its cancer(C) tissue. RT-PCR for GAPDH was used as equal loading control.
Figure 2 Different expression of EMP-1 cell clones transfected with pcDNA3.
1-EMP-1-myc-his (-) C vector and the parental vector without cDNA insert pcDNA3.1myc-his (-) C cells as negative control. Clones 1, 2, 3, 4, 5, 6, 8 and 10 showed the increased expression of EMP-1. RT-PCR for GAPDH was used as equal loading control. B represents the parental vector as negative control.
Figure 3 Western blotting check the expression of EMP-1 after transfected into the EC9706 cell with anti-HIS monoclonal antibody.
His peptide has been expressed successfully in host cell clones (C1, C2, C3, C5, C 6 and C8,). Control represents the negative control.
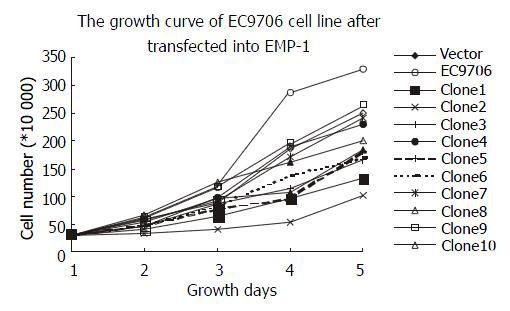
Figure 4 The growth curve of EC9706 cell line after transfected into EMP-1.
The clones 1, 2, 3, 5, 6, 8 and 10 slow down obviously, and the clones 4, 7 and 9 are close to the vector control. Vector represents the negative control.
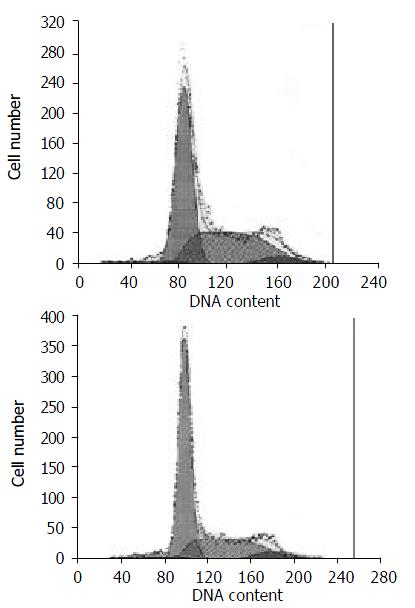
Figure 5 Flow cytometric analysis of cell cycle of negative con-trol (left) and cell clone 2 (right).
The percentages of negative cells and the clone 2 cells in G1, G2 and S phase are 52.2%, 6.2%, 41.7%; 64%, 5.8% and 30.2%, respectively
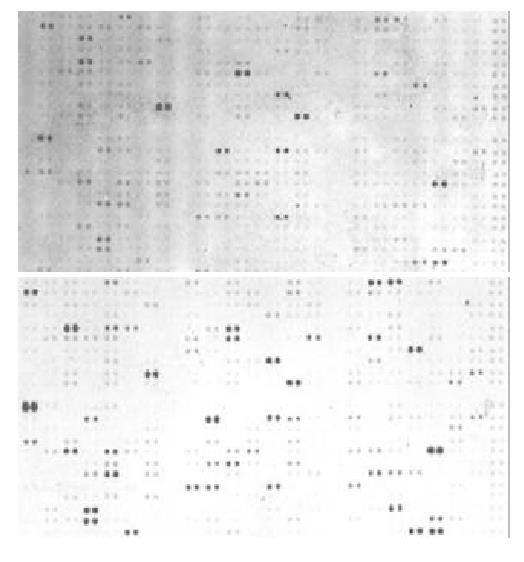
Figure 6 cDNA microarray analysis of parental negative con-trol expression (left) and the EMP-1 transfected cell clone 2 (Right).
35 genes show an over 2.0-fold change in expression level after transfection, with 28 genes being consistently up-regulated and 7 genes being down-regulated.
Figure 7 Verification of up-regulated and down-regulated gene expression in EC9706 induced by overexpression of EMP-1.
Interleukin-6, plasminogen and P19INK4D increased their expression and COL11A1 decreased its expression. Pre represents the sample not transfected with the vector carried with the ORF of EMP-1, and post represents the sample trans-fected with EMP-1. RT-PCR for GAPDH was used as equal loading control.
- Citation: Wang HT, Kong JP, Ding F, Wang XQ, Wang MR, Liu LX, Wu M, Liu ZH. Analysis of gene expression profile induced by EMP-1 in esophageal cancer cells using cDNA Microarray. World J Gastroenterol 2003; 9(3): 392-398
- URL: https://www.wjgnet.com/1007-9327/full/v9/i3/392.htm
- DOI: https://dx.doi.org/10.3748/wjg.v9.i3.392


