Copyright
©The Author(s) 2003.
World J Gastroenterol. Oct 15, 2003; 9(10): 2293-2299
Published online Oct 15, 2003. doi: 10.3748/wjg.v9.i10.2293
Published online Oct 15, 2003. doi: 10.3748/wjg.v9.i10.2293
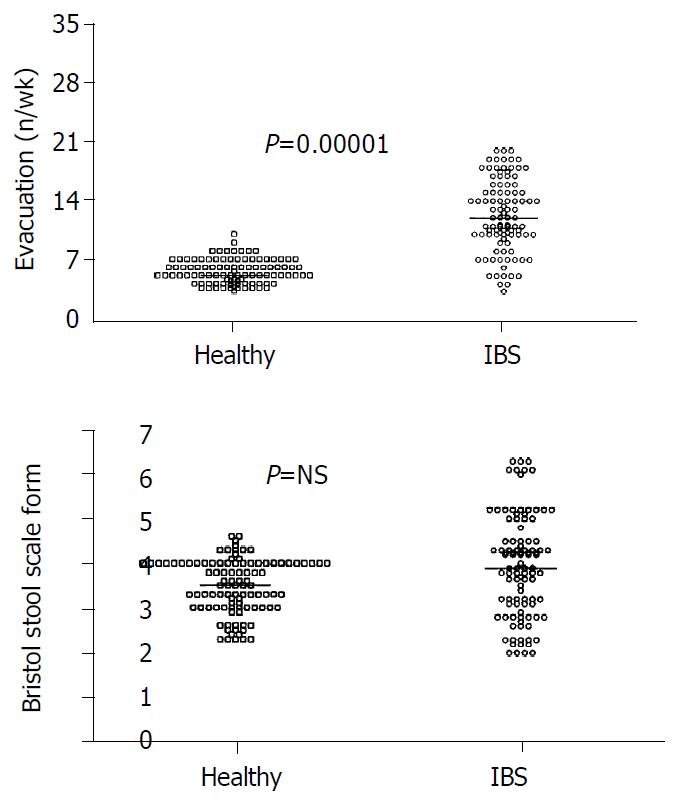
Figure 1 A: Significantly more bowel movements in IBS pa-tients than in healthy subjects.
B: Comparable score for stool form between IBS patients and healthy subjects. Results are expressed as individual data and median (horizontal line).
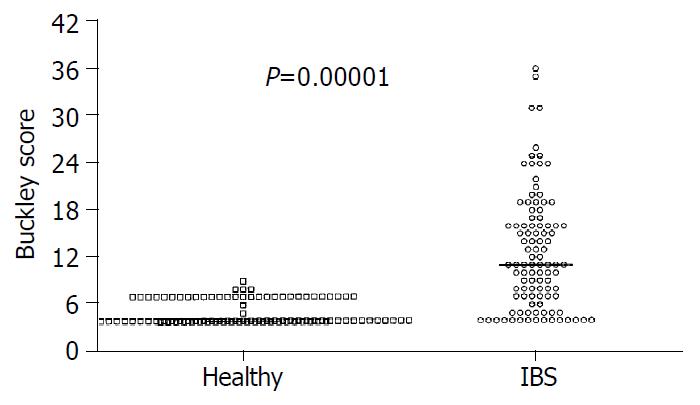
Figure 2 Significant dyspepsia in IBS patients compared with healthy subjects.
Results are expressed as individual data and median.
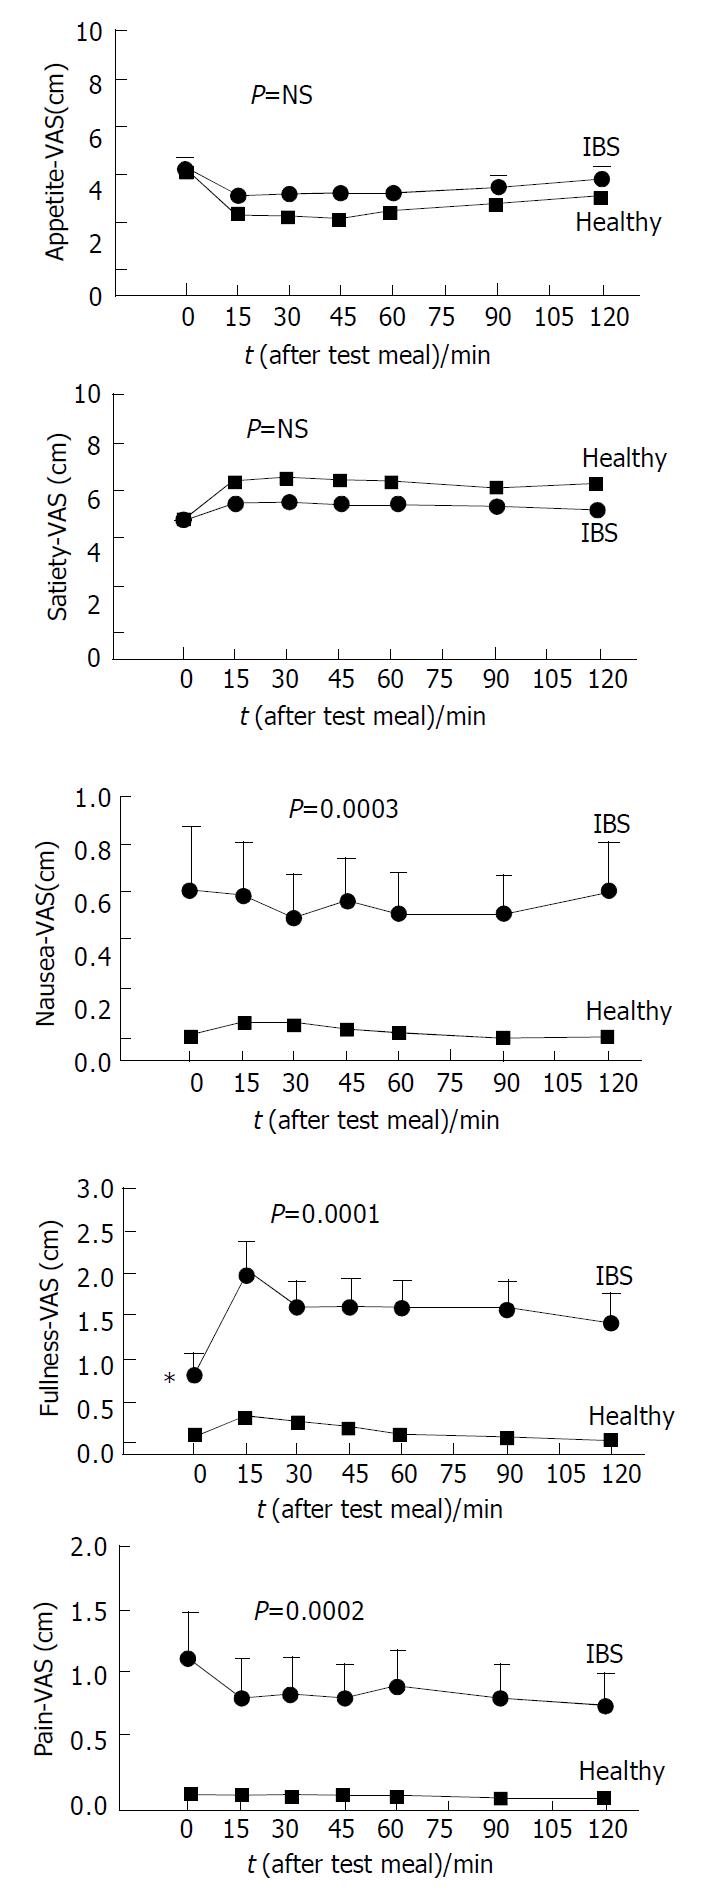
Figure 3 Time-course of visual analogue scale (VAS) for appetite, satiety, nausea, abdominal fullness and epigastric pain (or discomfort) in healthy subjects.
On the X-axis time “0” is before ingestion of test meal. Asterisks indicate significant differences (0.0001 < P < 0.001) of IBS patients vs healthy subjects at baseline. Significant differences for nausea, fullness and epi-gastric pain/discomfort of IBS patients vs healthy subjects (area under curve).
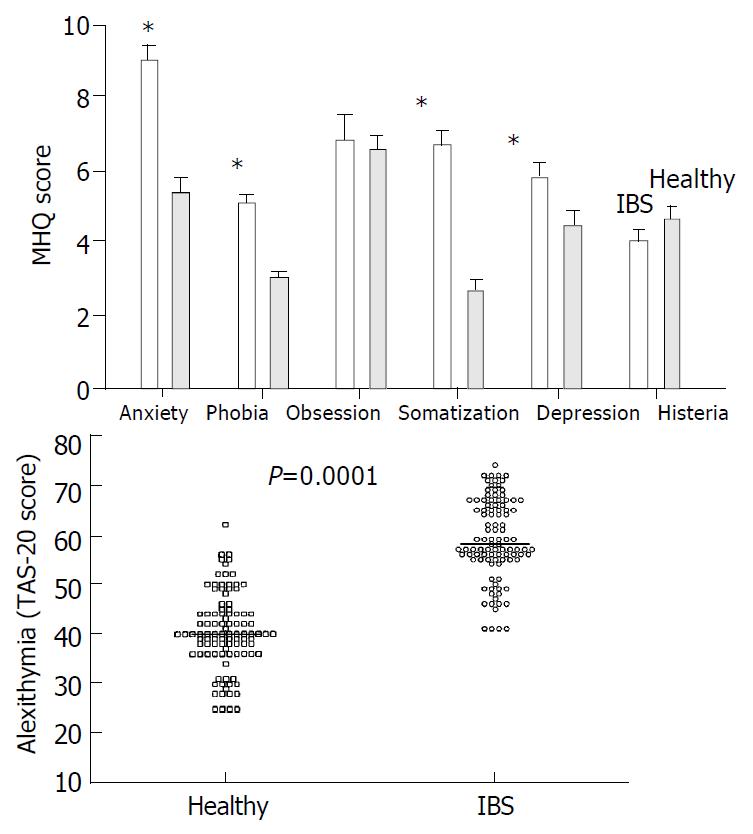
Figure 4 A: Scores of psychological disorders (mean ± SE, *0.
009 < p < 0.04). B: Scores of alexithymia (individual data and median) in IBS patients and healthy subjects.
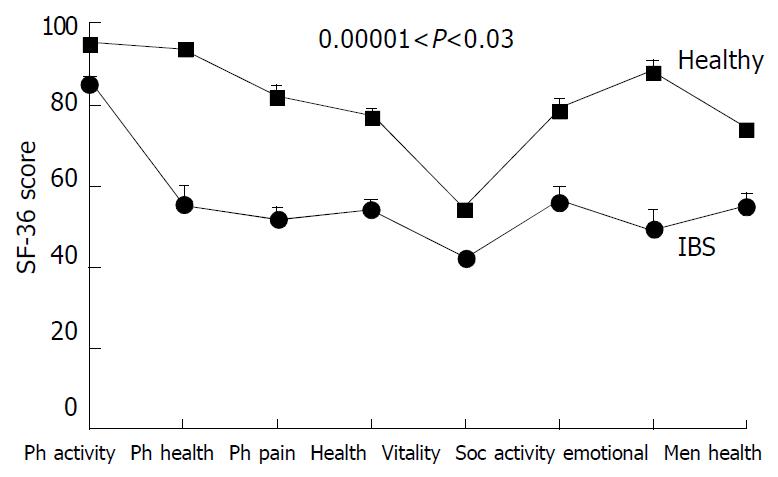
Figure 5 Profiles of health-related quality of life-HRQOL (SF-36 questionnaire) for IBS patients and healthy subjects.
Data are mean ± SE. Significantly poorer HRQOL for all 8 scales in IBS patients compared with healthy subjects. Legend: Ph, physical; soc, social.
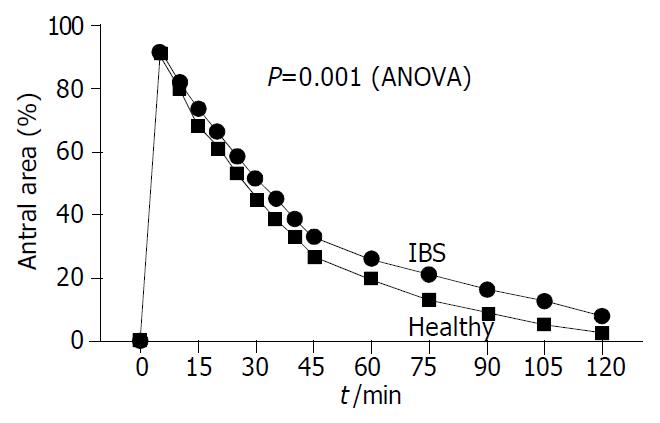
Figure 6 Time-course of gastric emptying in IBS patients and healthy subjects after ingestion of 200 mL of standard liquid meal.
Symbols indicate mean (SE is very small and not visible at each time-point). IBS patients had impaired emptying with larger postprandial antral areas (expressed as% of basal area) than healthy subjects. See also Table 2 for half-emptying time differences.
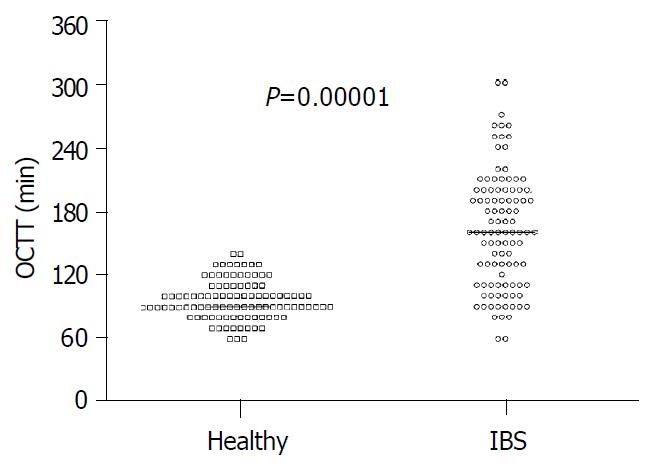
Figure 7 Significant delay of orocaecal transit time (OCTT) in IBS patients compared with healthy subjects.
Results are ex-pressed as individual data and median.
-
Citation: Portincasa P, Moschetta A, Baldassarre G, Altomare DF, Palasciano G. Pan-enteric dysmotility, impaired quality of life and alexithymia in a large group of patients meeting
ROME II criteria for irritable bowel syndrome. World J Gastroenterol 2003; 9(10): 2293-2299 - URL: https://www.wjgnet.com/1007-9327/full/v9/i10/2293.htm
- DOI: https://dx.doi.org/10.3748/wjg.v9.i10.2293


