Copyright
©The Author(s) 2003.
World J Gastroenterol. Oct 15, 2003; 9(10): 2178-2181
Published online Oct 15, 2003. doi: 10.3748/wjg.v9.i10.2178
Published online Oct 15, 2003. doi: 10.3748/wjg.v9.i10.2178
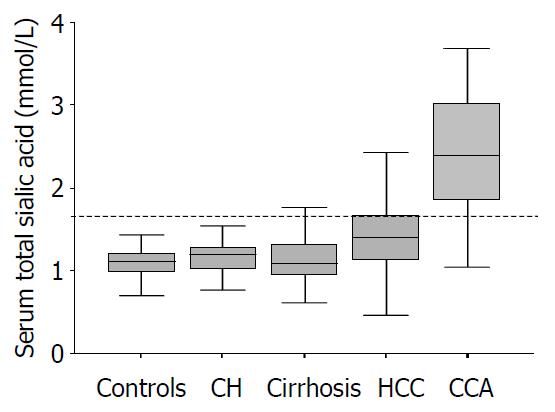
Figure 1 Serum total sialic acid (TSA) concentrations in each group.
Cut-off value of serum TSA as a tumor marker was 1.75 mmol/L.
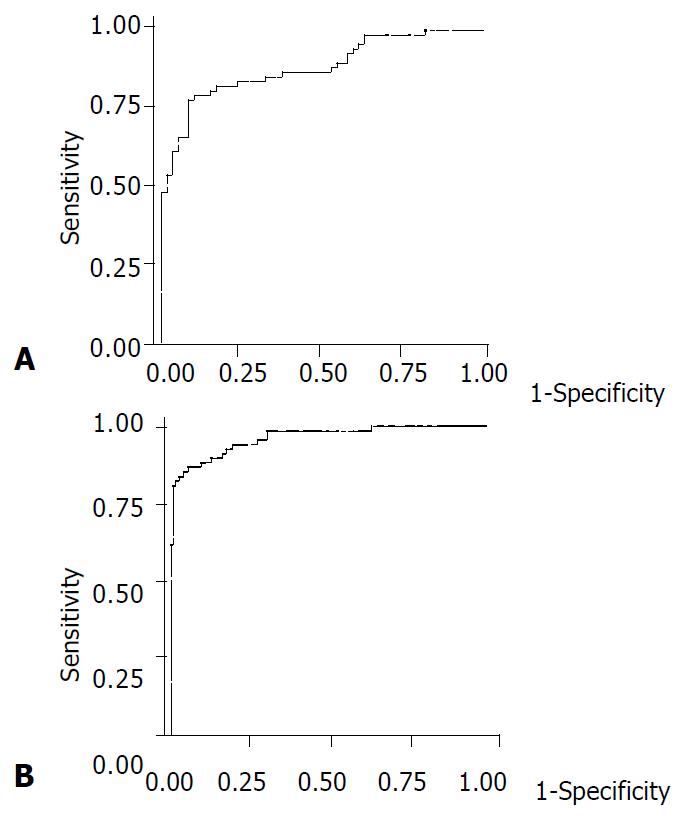
Figure 2 ROC curves of serum TSA in distinguishing CCA from other groups.
A: CCA and HCC (the area under the curve was 0.885), B: CCA and cirrhosis, chronic hepatitis, blood donors (the area under the curve is 0.964).
- Citation: Kongtawelert P, Tangkijvanich P, Ong-Chai S, Poovorawan Y. Role of serum total sialic acid in differentiating cholangiocarcinoma from hepatocellular carcinoma. World J Gastroenterol 2003; 9(10): 2178-2181
- URL: https://www.wjgnet.com/1007-9327/full/v9/i10/2178.htm
- DOI: https://dx.doi.org/10.3748/wjg.v9.i10.2178


