Copyright
©The Author(s) 2003.
World J Gastroenterol. Oct 15, 2003; 9(10): 2143-2148
Published online Oct 15, 2003. doi: 10.3748/wjg.v9.i10.2143
Published online Oct 15, 2003. doi: 10.3748/wjg.v9.i10.2143
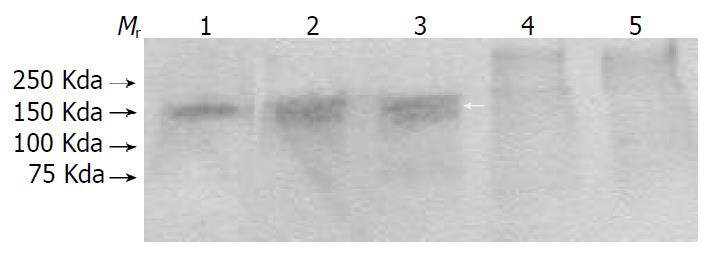
Figure 1 Western blot analysis of DNA topoisomerase IIα.
Lane 1, nuclear matrix fraction of SHEE. Lane 2, total crude nuclear protein fraction of SHEEC. Lane 3, total crude nuclear protein fraction of SHEE. Lane 4, cytoplasmic protein fraction of SHEEC. Lane 5, cytoplasmic protein fraction of SHEE. Mr, molecular weight standard.
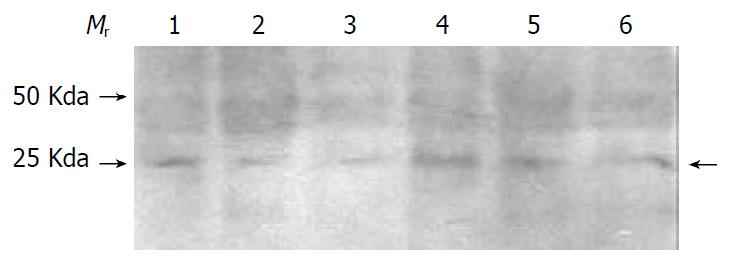
Figure 2 Western blot analysis of PCNA.
Lane 1 to Lane 3, nuclear matrix fraction of SHEEC. Lane 4 to Lane 6, nuclear matrix protein of SHEE. Mr, molecular weight standard.
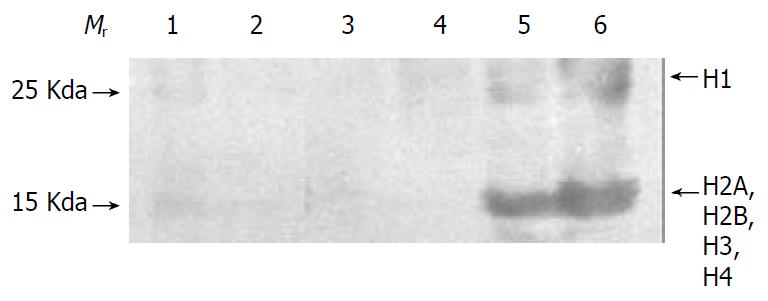
Figure 3 Western blot analysis of histone.
Lane 1, nuclear matrix fraction of SHEEC. Lane 2, nuclear matrix protein of SHEE. Lane 3, cytoplasmic protein fraction of SHEEC. Lane 4, cytoplasmic protein fraction of SHEE. Lane 5, total crude nuclear protein fraction of SHEEC. Lane 6, total crude nuclear protein fraction of SHEE. Mr, molecular weight standard.
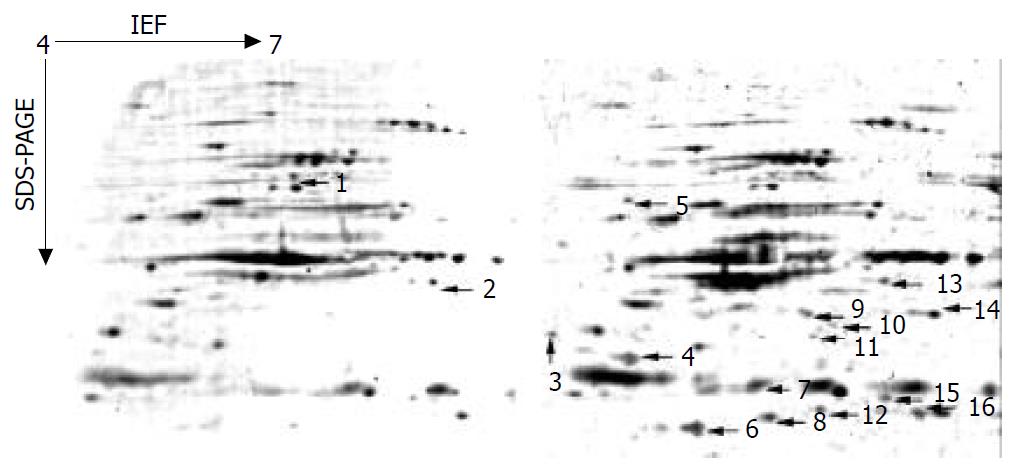
Figure 4 Differentially expressed NMP spots observed in SHEE (left) and SHEEC (right) two-dimensional gels (IPG dry strips: pH4-7, 7 cm).
The arrows show differentially expressed protein spots. Three protein spots (No.4, 14, 16) were selected and analyzed with MALDI-TOF-MS.
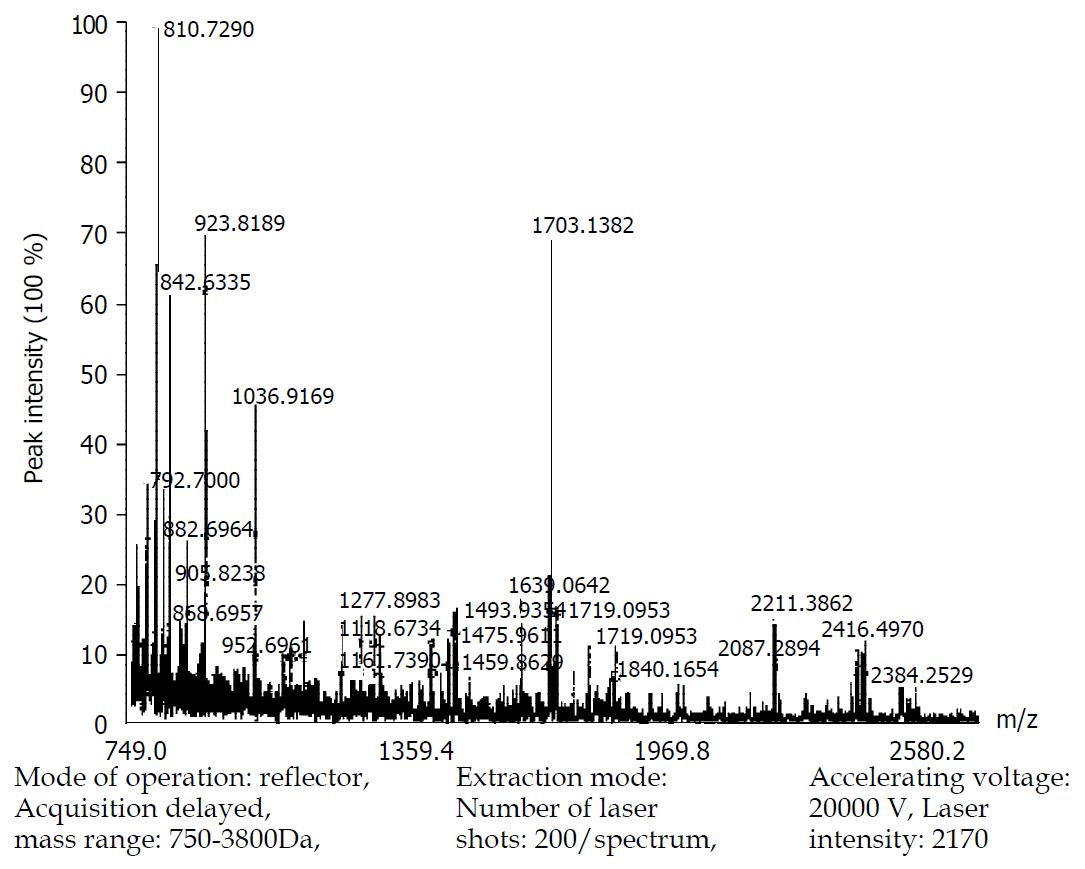
Figure 5 MALDI-TOF mass spectrum map of protein spot 16.
- Citation: Xiong XD, Li EM, Xu LY, Chen HB, Chen L, Cai WJ, Han YL, Shen ZY, Zeng Y. Separation and identification of differentially expressed nuclear matrix proteins between human esophageal immortalized and carcinomatous cell lines. World J Gastroenterol 2003; 9(10): 2143-2148
- URL: https://www.wjgnet.com/1007-9327/full/v9/i10/2143.htm
- DOI: https://dx.doi.org/10.3748/wjg.v9.i10.2143


