Copyright
©The Author(s) 2003.
World J Gastroenterol. Jan 15, 2003; 9(1): 65-68
Published online Jan 15, 2003. doi: 10.3748/wjg.v9.i1.65
Published online Jan 15, 2003. doi: 10.3748/wjg.v9.i1.65
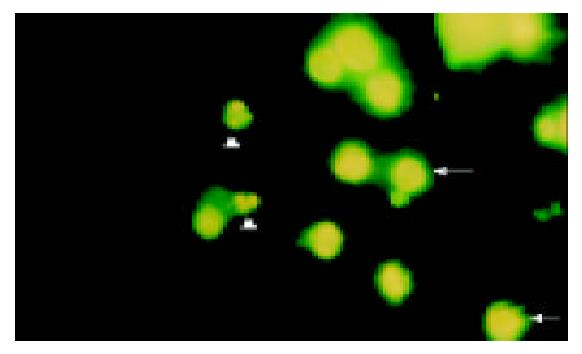
Figure 1 Immunofluorescence staining of Hoechst 3325872 h after 1.
0 µmol/L As2O3 + 1.0 g/L CDA-II administred in HepG2 cells (× 400). →: dispersive fluorescences in normal cells nuclei; △: compact particulate fluorescences in apoptosis cell nuclei
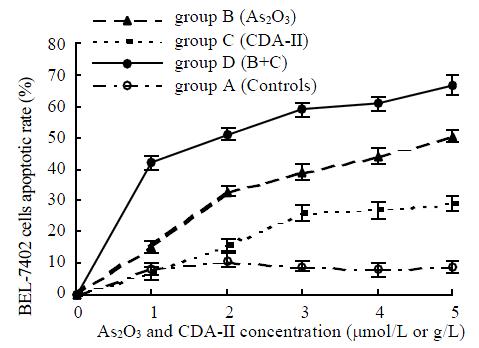
Figure 2 Comparison of different groups on numbers of BEL-7402 cell apoptosis.
A. Main effect (As2O3): F = 0.387, sig. = 0.063, P > 0.05; B. Main effect (CDA-II): F = 0.670, sig. = 0.785, P > 0.05; C. Interaction (As2O3 + CDA-II): F = 22.450, sig. = 0.000, P < 0.05
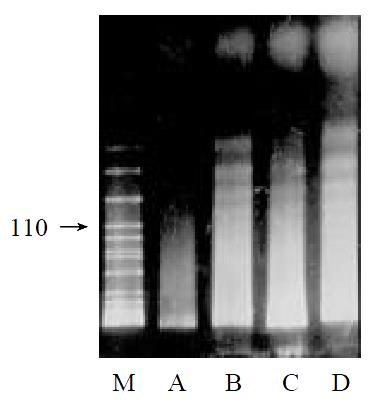
Figure 3 DNA agarose gel electrophore I of hepatoma cell lines treated by As2O3 or CDA-II + As2O3 for 72 h.
M: λ-DNA Marker VII; A (HepG2): controls; B (HepG2): 1.0 µmol·L-1 As2O3 + 1.0 g·L-1 CDA-II; C (BEL-7402): 1.0 µmol·L-1 As2O3 + 1.0 g·L-1 CDA-II; D (HepG2): 5.0 µmol·L-1 As2O3
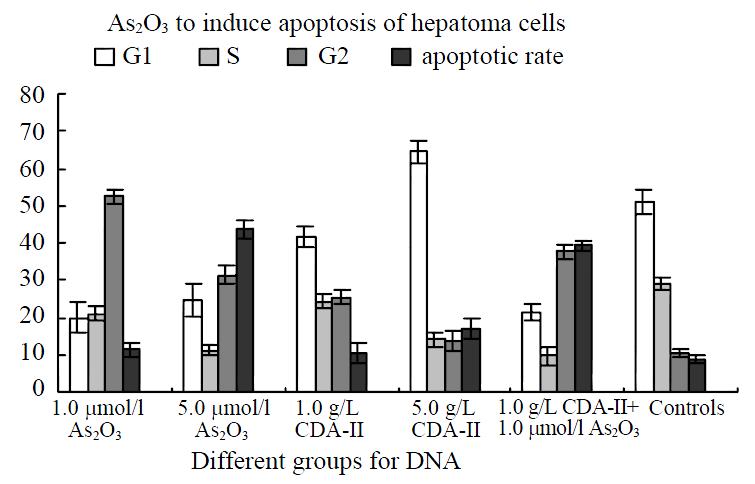
Figure 4 Comparison of DNA in various groups 4 days after medicinal treatment.
P < 0.05 Compared with the controls
Figure 5 Flow cytometry 4 days after medicinal treatment.
(A). 1.0 µmol/L As2O3; (B). 1.0 g/L CDA-II; (C). 1.0 µmol/L As2O3 + 1.0 g/L CDA-II; (D). Control.
- Citation: Liu JW, Tang Y, Shen Y, Zhong XY. Synergistic effect of cell differential agent-II and arsenic trioxide on induction of cell cycle arrest and apoptosis in hepatoma cells. World J Gastroenterol 2003; 9(1): 65-68
- URL: https://www.wjgnet.com/1007-9327/full/v9/i1/65.htm
- DOI: https://dx.doi.org/10.3748/wjg.v9.i1.65


