Copyright
©The Author(s) 2002.
World J Gastroenterol. Dec 15, 2002; 8(6): 999-1004
Published online Dec 15, 2002. doi: 10.3748/wjg.v8.i6.999
Published online Dec 15, 2002. doi: 10.3748/wjg.v8.i6.999
Math 1 Math(A1).
Math 2 Math(A1).
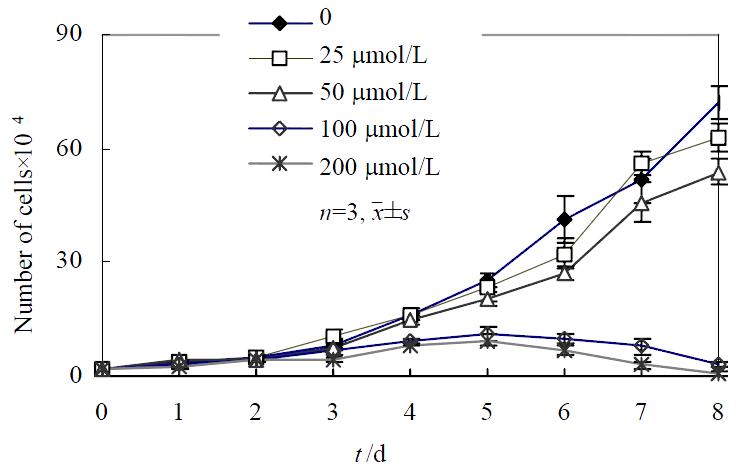
Figure 1 Growth curve of SGC-7901cells cultured in various concentrations of c9,t11-CLA.
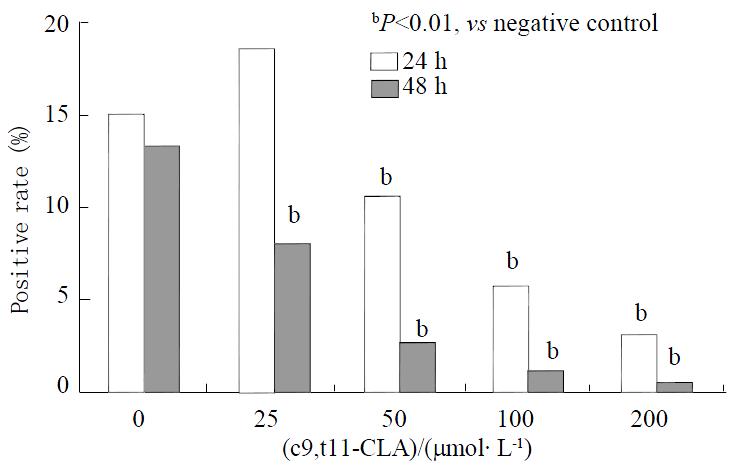
Figure 2 Expression of ki67 on SGC-7901 cells treated with c9, t11-CLA.
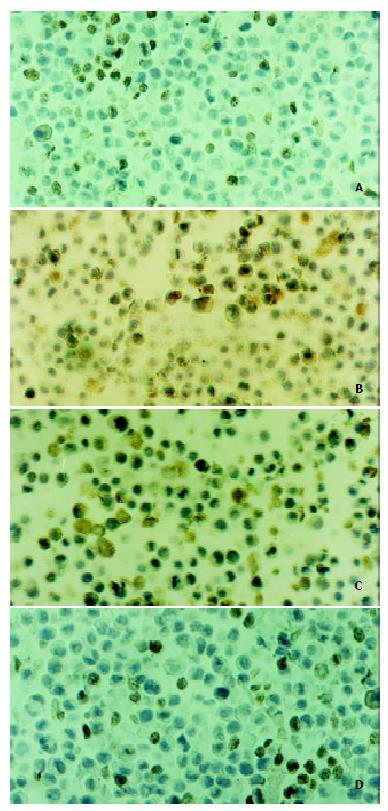
Figure 3 A: The expression of Ki67 on SGC-7901 cells of the negative control.
Immunocytochemistry staining SP method, original magnification, × 400; B: The expression of bcl-2 on SGC-7901 cells of the negative control. Immunocytochemistry staining SP method, original magnification, × 400; C: The ex-pression of Fas on SGC-7901 cells of c9, t11-CLA group (200 μmol·L-1 48 h). Immunocytochemistry staining SP method, original magnification, × 400; D:The expression of c-myc on SGC-7901 cells of the negative control. Immunocytochemistry staining SP method, original magnification, × 400.
-
Citation: Liu JR, Chen BQ, Yang YM, Wang XL, Xue YB, Zheng YM, Liu RH. Effect of apoptosis on gastric adenocarcinoma cell line SGC-7901 induced by
cis -9,trans -11-conjugated linoleic acid. World J Gastroenterol 2002; 8(6): 999-1004 - URL: https://www.wjgnet.com/1007-9327/full/v8/i6/999.htm
- DOI: https://dx.doi.org/10.3748/wjg.v8.i6.999


