Copyright
©The Author(s) 2002.
World J Gastroenterol. Dec 15, 2002; 8(6): 987-993
Published online Dec 15, 2002. doi: 10.3748/wjg.v8.i6.987
Published online Dec 15, 2002. doi: 10.3748/wjg.v8.i6.987
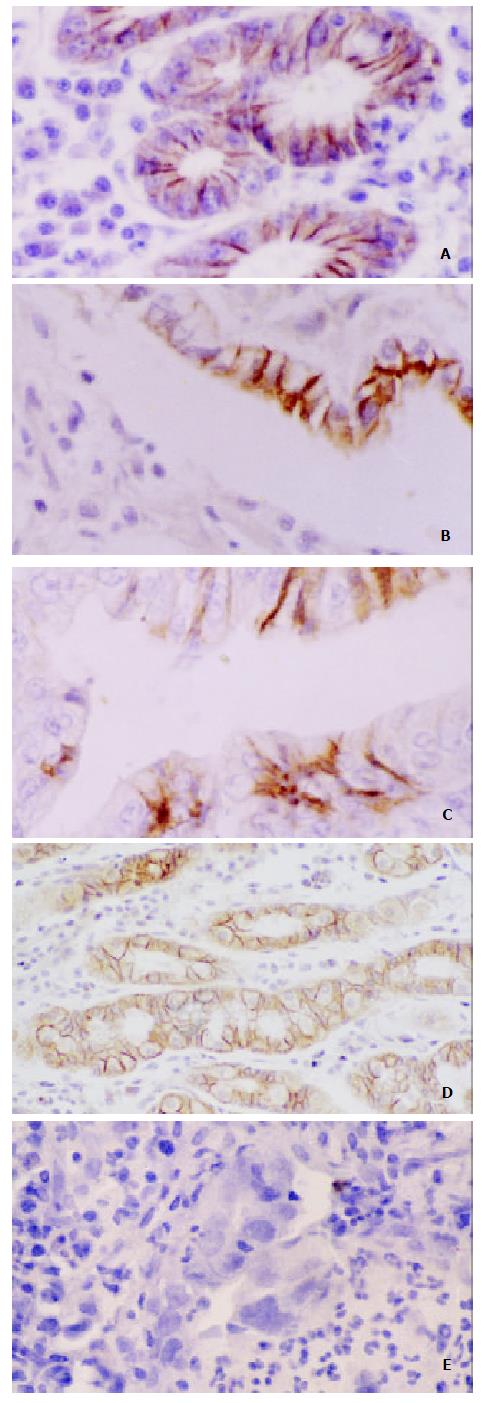
Figure 1 Immunoreactivity of E-cadherin and β-catenin in Gastric Carcinoma.
A. Normal membranous staining pattern of E-cadherin (SP × 200); B. Poorly differentiated tumor with complete loss of membraous staining with E-cadherin in the majority of cells. Membranous staining can be seen in a few cells retaining gastric gland (SP×400); C. Morderately differ-entiated tumor showing cytoplasmic staining with β-catenin, partly nuclear β-catenin expression (SP × 400); D. Staining of E-cadherin showing preserved strong membranous expression in gastric mucosa with intestinal metaplasia (SP × 200); E. Mu-cosal biopsy specimen with dysplasia (high grade) showing loss of membranous expression of E-cadherin.(SP × 400)
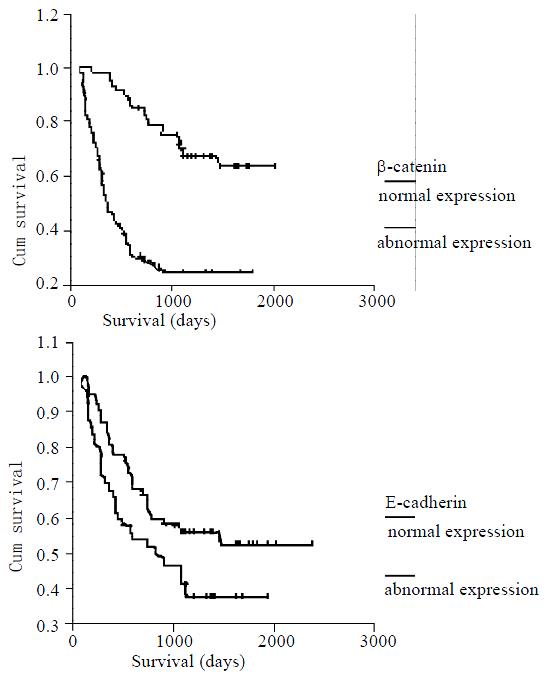
Figure 2 Kaplan-Meier survival curves showing a statistically significant survival advantage found in all tumors with nor-mal membranous expression of β-catenin (B) compared with those with loss of membranous expression (P < 0.
0005). Abnormol E-cadherin (A) staining pattern showed a trend to-ward worse survival, but not statistically significant (P = 0.058).
- Citation: Zhou YN, Xu CP, Han B, Li M, Qiao L, Fang DC, Yang JM. Expression of E-cadherin and β-catenin in gastric carcinoma and its correlation with the clinicopathological features and patient survival. World J Gastroenterol 2002; 8(6): 987-993
- URL: https://www.wjgnet.com/1007-9327/full/v8/i6/987.htm
- DOI: https://dx.doi.org/10.3748/wjg.v8.i6.987


