Copyright
©The Author(s) 2002.
World J Gastroenterol. Dec 15, 2002; 8(6): 1117-1122
Published online Dec 15, 2002. doi: 10.3748/wjg.v8.i6.1117
Published online Dec 15, 2002. doi: 10.3748/wjg.v8.i6.1117
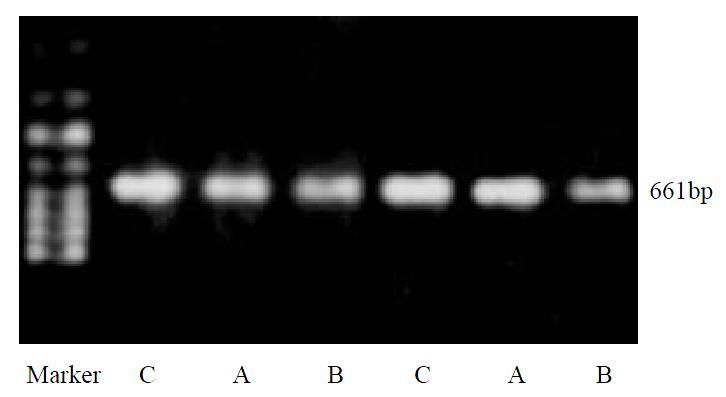
Figure 1 Effects of hydrogen peroxide on expression of hom-ing gene β-actin mRNA.
C: control cells; A: 4 mM H2O2-treated cells (3 h); B: 400 mM H2O2-treated cells (3 h).
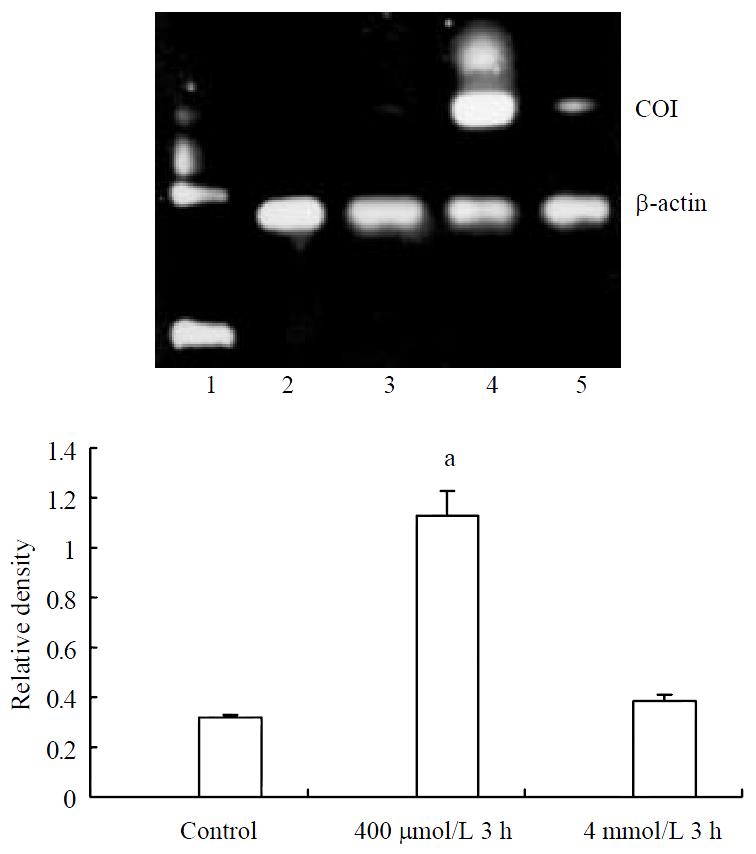
Figure 2 Effects of hydrogen peroxide on expression of COI mRNA (aP < 0.
05, vs. normal control). 1 DNA marker: lDNA/Hind III, 2 positive control, 3 normal control, 4400 μmol/L 3 h, 5 4 mmol/L 3 h.
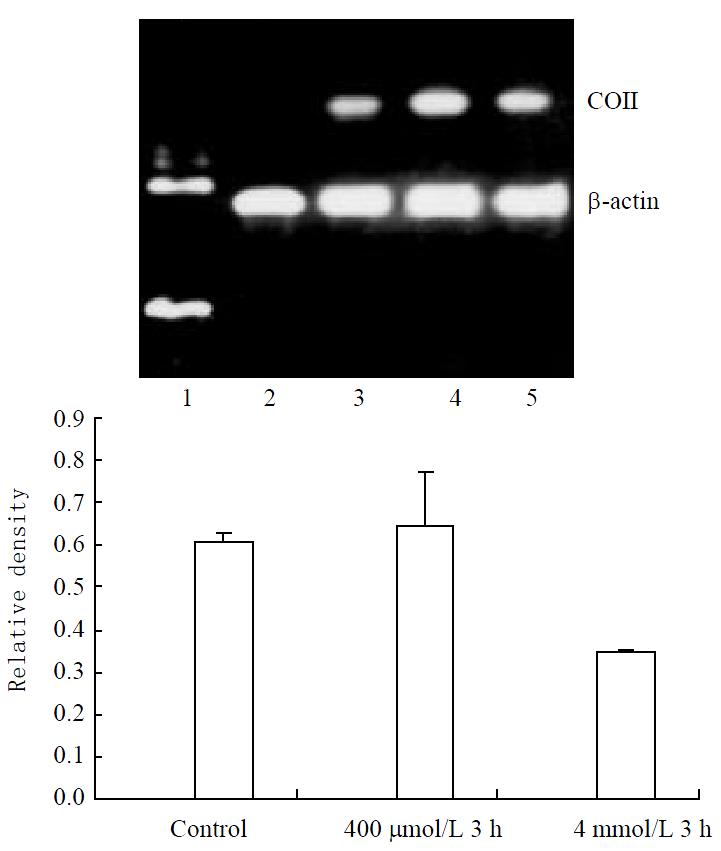
Figure 3 Effects of hydrogen peroxide on expression of COII mRNA (aP < 0.
05, vs normal control). 1 DNA marker; lDNA/Hind III, 2 positive control, 3 normal control, 4400 μmol/L 3 h, 5 4 mmol/L 3 h.
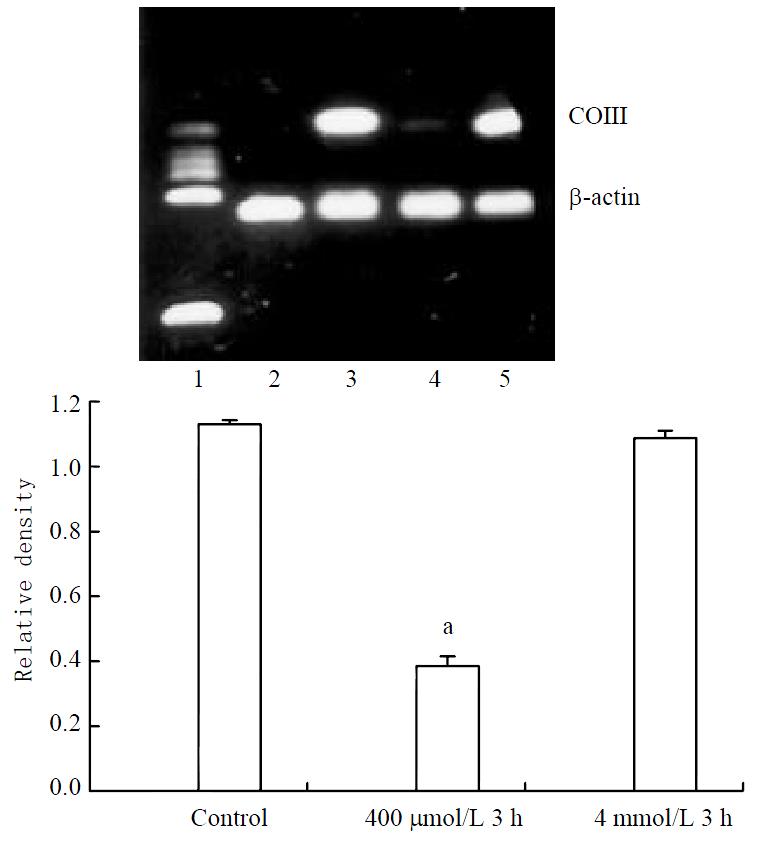
Figure 4 Effects of hydrogen peroxide on expression of COIII mRNA (aP < 0.
05, vs normal control). 1 DNA marker: lDNA/Hind III, 2 positive control, 3 normal control, 4400 μmol/L 3 h, 5 4 mmol/L 3 h.
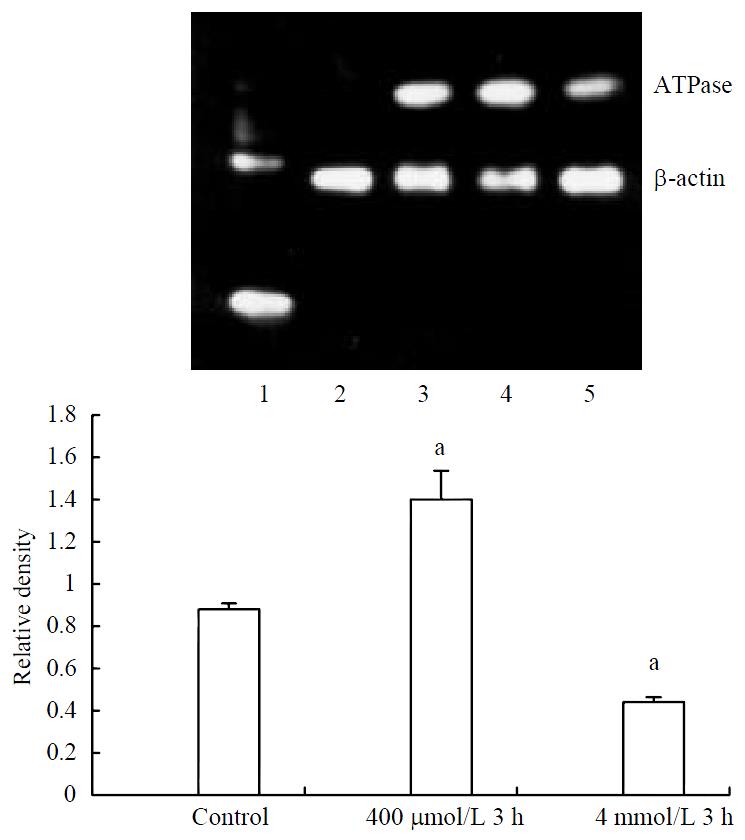
Figure 5 Effects of hydrogen peroxide on expression of AT-Pase6 mRNA (aP < 0.
05, vs normal control). 1 DNA marker: lDNA/Hind III, 2 positive control, 3 normal control, 4400 μmol/L 3 h, 5 4 mmol/L 3 h.
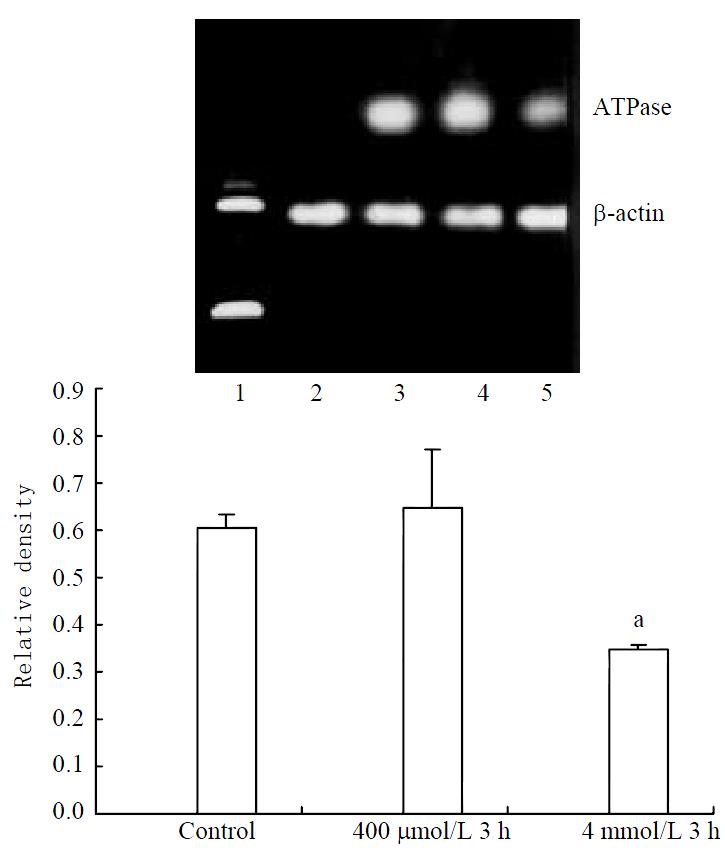
Figure 6 Effects of hydrogen peroxide on expression of AT-Pase8 mRNA (aP < 0.
05, vs. normal control). 1 DNA marker: lDNA/Hind III, 2 positive control, 3 normal control, 4400 μmol/L 3 h, 5 4 mmol/L 3 h.
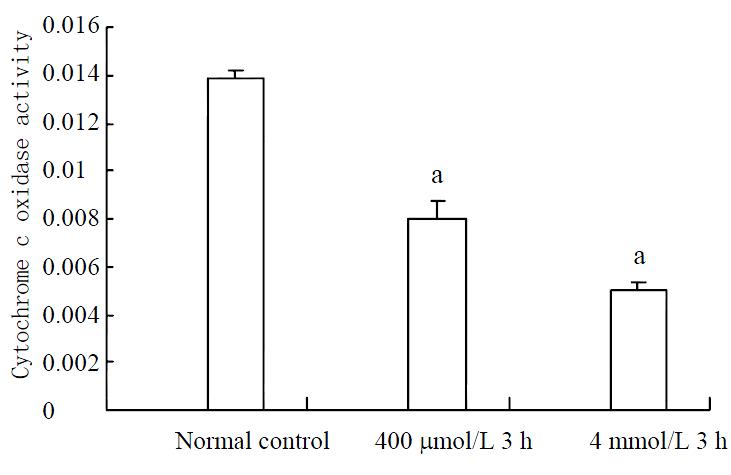
Figure 7 Activity of cytochrome c oxidase in hydrogen peroxide-stimulated SW-480 cells (aP < 0.
05, vs. normal control).
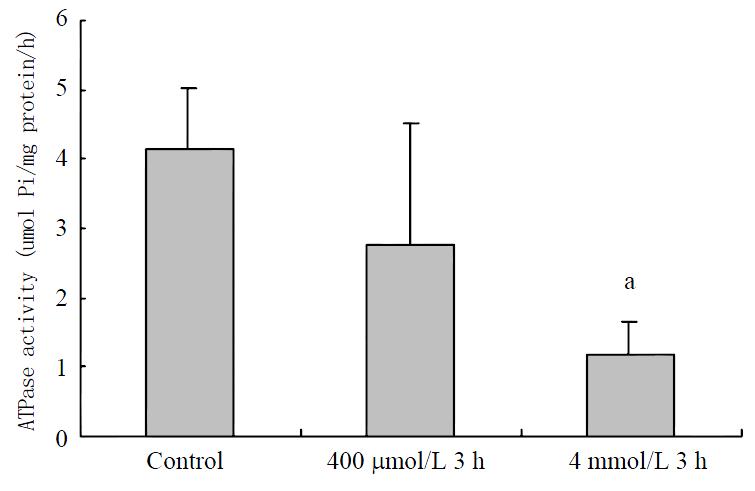
Figure 8 Activity of ATPase in hydrogen peroxide-stimulated SW-480 cells (aP < 0.
05, vs. normal control).
- Citation: Li JM, Cai Q, Zhou H, Xiao GX. Effects of hydrogen peroxide on mitochondrial gene expression of intestinal epithelial cells. World J Gastroenterol 2002; 8(6): 1117-1122
- URL: https://www.wjgnet.com/1007-9327/full/v8/i6/1117.htm
- DOI: https://dx.doi.org/10.3748/wjg.v8.i6.1117


