Copyright
©The Author(s) 2002.
World J Gastroenterol. Jun 15, 2002; 8(3): 505-510
Published online Jun 15, 2002. doi: 10.3748/wjg.v8.i3.505
Published online Jun 15, 2002. doi: 10.3748/wjg.v8.i3.505
Math 1 Math(A1).
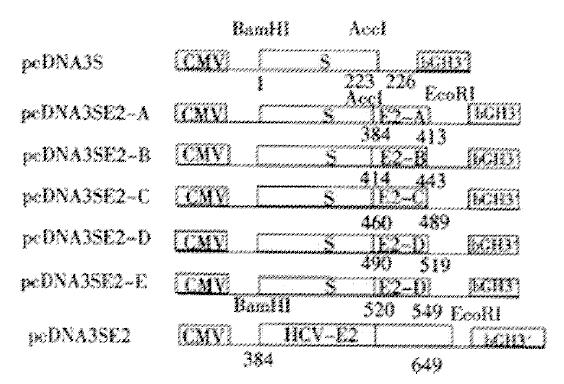
Figure 1 Schematic diagram of the expression plasmids.
The coordinates below the bars refer to the corresponding amino acid residues of HBV surface antigen (HBsAg) and HCV E2 protein. The fusion genes were under the control of CMV immediate early promoter in pcDNA3. Bovine growth hormone (bGH) 3’-untranslated sequences were used as polyadenylation signals.
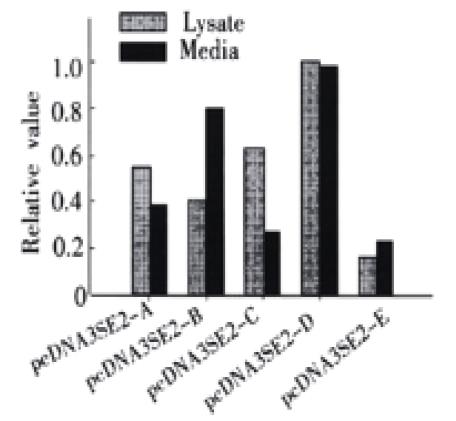
Figure 2 Comparison of the expression and secretion level of fusion proteins in COS cells.
pcDNA3SE2-A, pcDNA3SE2-B, pcDNA3SE2-C, pcDNA3SE2-D, pcDNA3SE2-E are the plasmids expressing HBsAg fused with different HCV E2 fragments. The HBsAg in the culture medium (gray) and cell lysates (black) was measured by a commercial ELISA kit (Sino-American Co., Shanghai, China). Results were presented as means of three independent experiments (see Materials and Methods). The amount of HBsAg expressed by pcDNA3SE2-D in cell lysates was arbitrarily taken as 1.0.
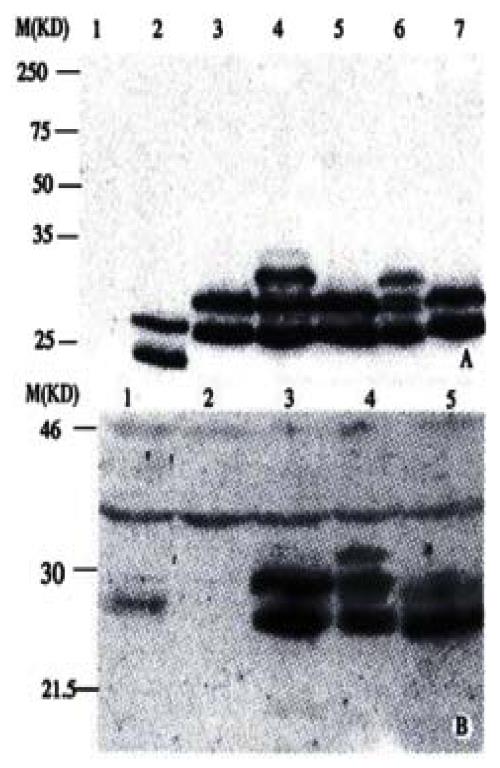
Figure 3 Characterization of the fusion antigens transiently expressed in HeLa cells by Western blotting.
After separation by a 12.5% SDS-PAGE, the proteins were blotted onto a nitro-cellulose membrane and incubated with (A) anti-S McAb (H166, 1:300 diluted), (B) anti-HCV E2 (450-565) polyclonal antiserum RE2-116 (1:500 diluted) respectively. (A) lane 1-7, fusion proteins expressed by pcDNA3, pcDNA3S, pcDNA3SE2-A, pcDNA3SE2-B, pcDNA3SE2-C, pcDNA3SE2-D and pcDNA3SE2-E respectively. (B) lane 1-5, fusion proteins expressed by pcDNA3E2-pcDNA3, pcDNA3SE2-C, pcDNA3SE2-D, pcDNA3SE2-E respectively.
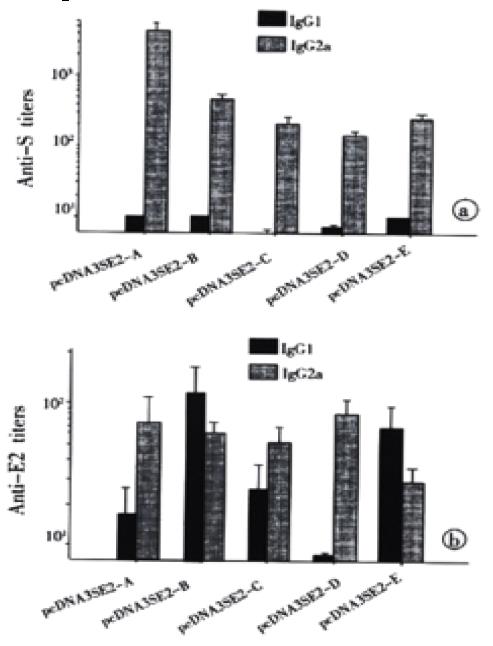
Figure 4 IgG subtypes profile of antibodies against HBsAg and HCV E2.
Sera collected from mice 6 weeks after boosting were assayed for the IgG1 and IgG2a antibodies against HBsAg and HCV E2. For each group of 5 mice, titers of IgG1 and IgG2a antibodies were determined individually by serial two-fold dilution titration methods using HRP-conjugated rabbit anti-mouse IgG1 and IgG2a (Serotec Co., Oxford, UK) for detection. (as described in Materials and Methods). The arithmetic mean ± standard deviation (SD) (n = 5) is shown. (A) Anti-HBs, (B) Anti-HCV E2.
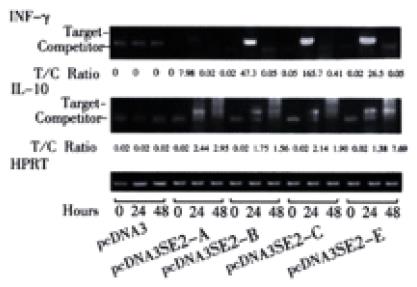
Figure 5 IFN-γ and IL-10 mRNA expression.
mRNA was isolated from splenic cells of immunized mice after stimulation with HBsAg for 0, 24, 48 hours. IFN-γ and IL-10 mRNA expression was determined by semi-quantitative RT-PCR after standardization of the cDNA concentration by amplification of HPRT. Level of expression is indicated as ratio of target to competitor, calculated from densitometric analysis of their PCR products. (High ratio indicates high expression of target mRNA).
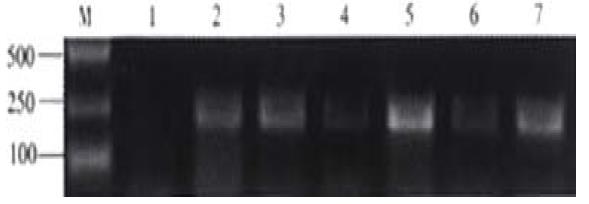
Figure 6 Detection of HCV captured by mouse antisera by nested RT-PCR.
After immuno capture of HCV from hepatitis C patient serum (1.6 × 10⁷ HCV GEq per mL) by antisera from groups of mice immunized with pcDNA3, pcDNA3SE2-A, pcDNA3SE2-B, pcDNA3SE2-C, pcDNA3SE2-D and pcDNA3SE2-E (lane 1 to lane 6), viruses were detect1ed by nested RT-PCR using the HCV RT-PCR testing kit (Sino-America Co., Shanghai, China). Lane 7, the positive control using McAb against HCV E2 to capture HCV. Lane M, molecular markers.
- Citation: Jin J, Yang JY, Liu J, Kong YY, Wang Y, Li GD. DNA immunization with fusion genes encoding different regions of hepatitis C virus E2 fused to the gene for hepatitis B surface antigen elicits immune responses to both HCV and HBV. World J Gastroenterol 2002; 8(3): 505-510
- URL: https://www.wjgnet.com/1007-9327/full/v8/i3/505.htm
- DOI: https://dx.doi.org/10.3748/wjg.v8.i3.505


