Copyright
©The Author(s) 2002.
World J Gastroenterol. Jun 15, 2002; 8(3): 426-430
Published online Jun 15, 2002. doi: 10.3748/wjg.v8.i3.426
Published online Jun 15, 2002. doi: 10.3748/wjg.v8.i3.426
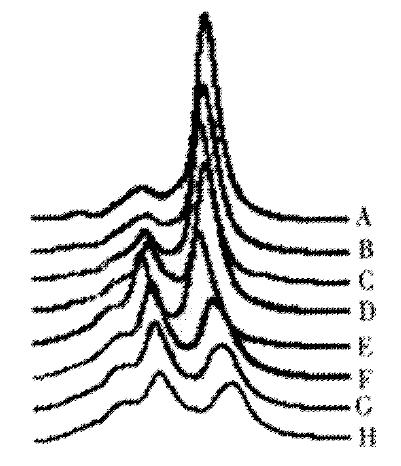
Figure 1 The minimal ratio of hetero-: homoduplex in mixture were identi-fied by DHPLC.
The composition of mutant type in PCR product mixture are 0% (A, wild type), 1% (B), 5% (C), 10% (D), 20% (E), 30% (F), 40% (G) and 50% (H) respectively. Chromatogram B has no difference to chromatogram A. Heteroduplex peak start to change in sample containing 5% variant (C). The heteroduplex can be obviously discerned in sample with 10% variant (D). Chromatogram E to H is almost similar. It indicates that about 5% mutant composition in PCR product mixture can be detected by DHPLC.
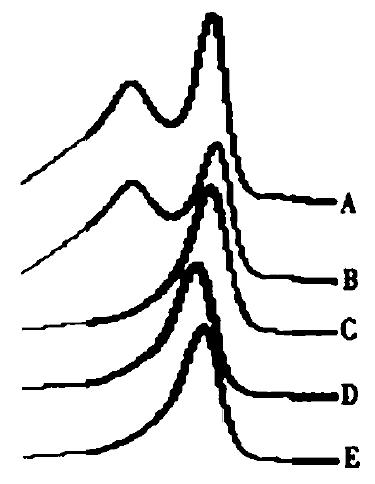
Figure 2 The universality of a broad small peak proceeding the main peak induced by Taq DNA polymerase.
An extra small peak is observed preceding the eluted chromatography profile of A and B but not in chromatogram of C, D and E. Chromatogram A is a representative of products amplified by Taq DNA polymerase. B is typical chromatography profile when Taq DNA polymerase matched with Pfu DNA polymerase buffer in PCR reaction. C and D respectively comes from amplimers amplified by Ampli-Taq Gold and Vent DNA polymerase. E is one of chromatograms coming from PCR amplification by using Pfu DNA polymerase.
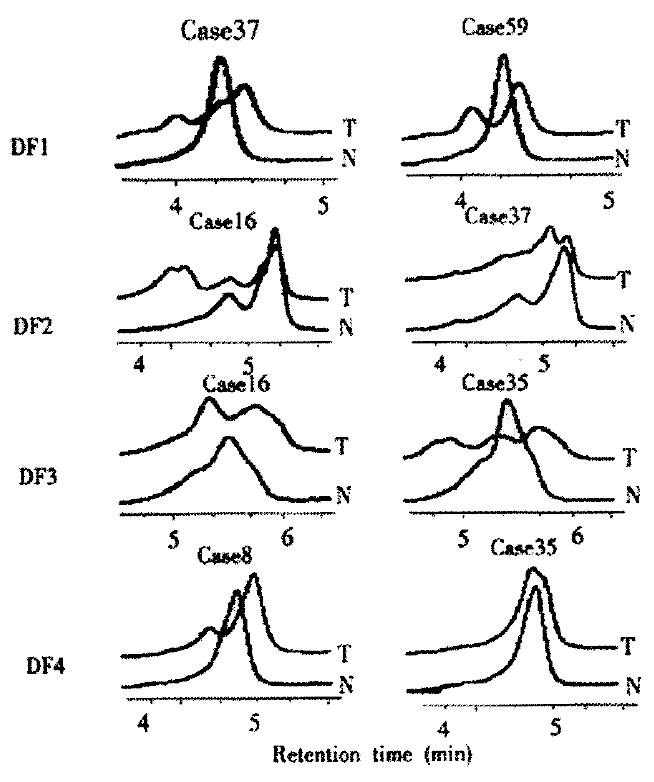
Figure 3 The representative DHPLC chromatograms of variant fragments detected blindly for patients with gastric cancinoma in D-loop of mtDNA.
The chromatogram of tumor tissue is visibly different to that of its counter-part non-tumor tissue. The variant cases are listed on the top of each DHPLC chromatogram. DF1, DF2, DF3 and DF4 represent the tested fragments of D-loop respectively. T: tumor tissues; N: non-tumor tissues.
- Citation: Liu MR, Pan KF, Li ZF, Wang Y, Deng DJ, Zhang L, Lu YY. Rapid screening mitochondrial DNA mutation by using denaturing high-performance liquid chromatography. World J Gastroenterol 2002; 8(3): 426-430
- URL: https://www.wjgnet.com/1007-9327/full/v8/i3/426.htm
- DOI: https://dx.doi.org/10.3748/wjg.v8.i3.426


