Copyright
©The Author(s) 2002.
World J Gastroenterol. Feb 15, 2002; 8(1): 60-63
Published online Feb 15, 2002. doi: 10.3748/wjg.v8.i1.60
Published online Feb 15, 2002. doi: 10.3748/wjg.v8.i1.60
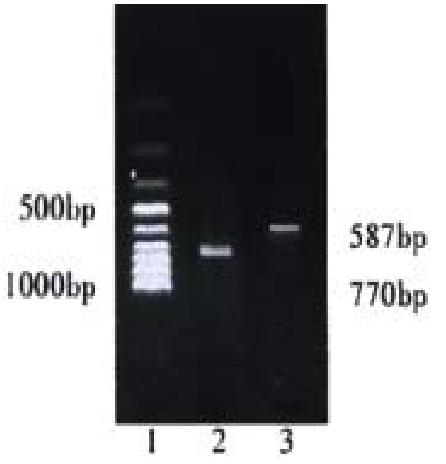
Figure 1 1:cyclin E; 2:PCR marker; 3:β -actin.
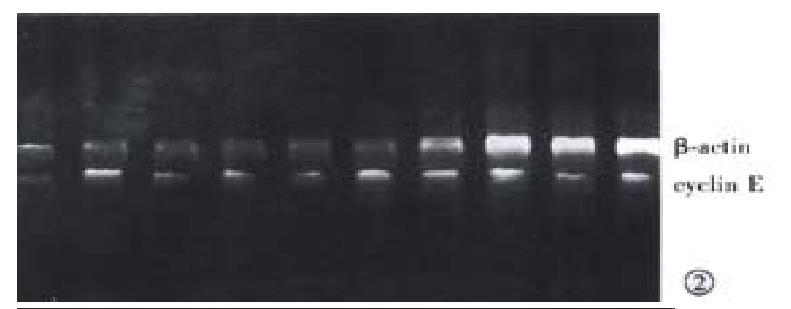
Figure 2 RT-PCR analysis of cyclin E mRNA levels using β -actin as internal control.
Total RNA was first reverse transcribed into cDNA and then amplified by PCR in control.
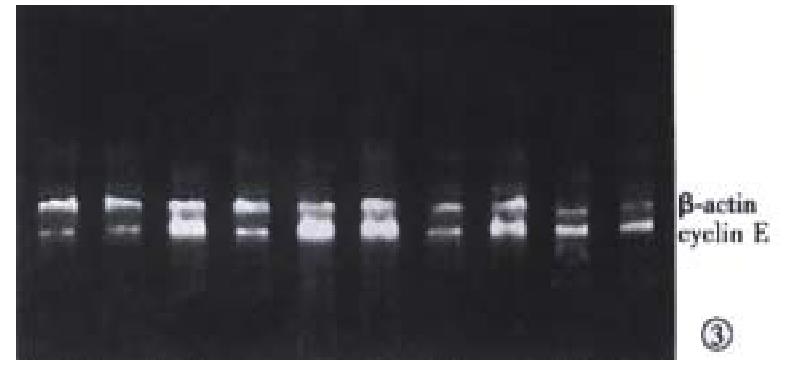
Figure 3 In 25 wk after infection of H.
pylori.
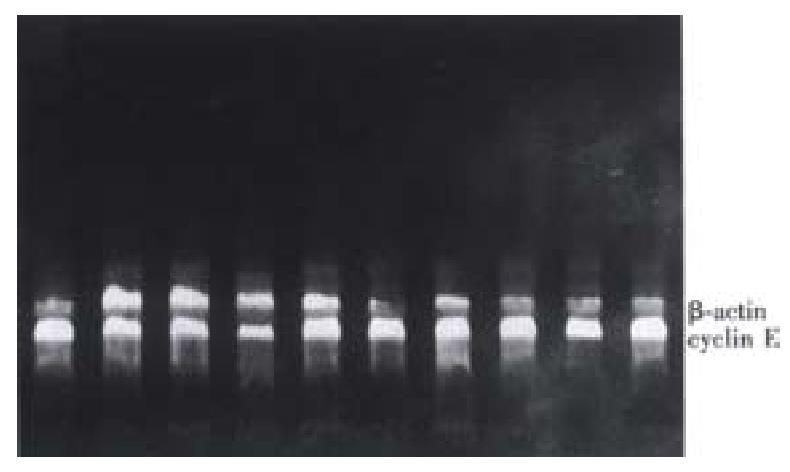
Figure 4 In 45 wk after infection of H.
pylori.
-
Citation: Yao YL, Xu B, Song YG, Zhang WD. Overexpression of cyclin E in Mongolian gerbil with
Helicobacter pylori- induced gastric precancerosis. World J Gastroenterol 2002; 8(1): 60-63 - URL: https://www.wjgnet.com/1007-9327/full/v8/i1/60.htm
- DOI: https://dx.doi.org/10.3748/wjg.v8.i1.60


