Copyright
©The Author(s) 2002.
World J Gastroenterol. Feb 15, 2002; 8(1): 144-149
Published online Feb 15, 2002. doi: 10.3748/wjg.v8.i1.144
Published online Feb 15, 2002. doi: 10.3748/wjg.v8.i1.144
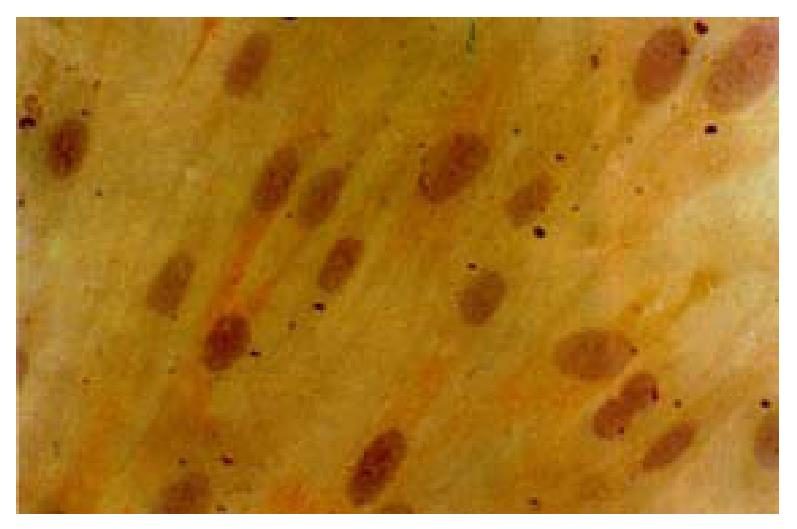
Figure 1 Cultured SO cells characterized with á-SM actin positive staining, filament were demonstrated along the longitudinal axis of the cells.
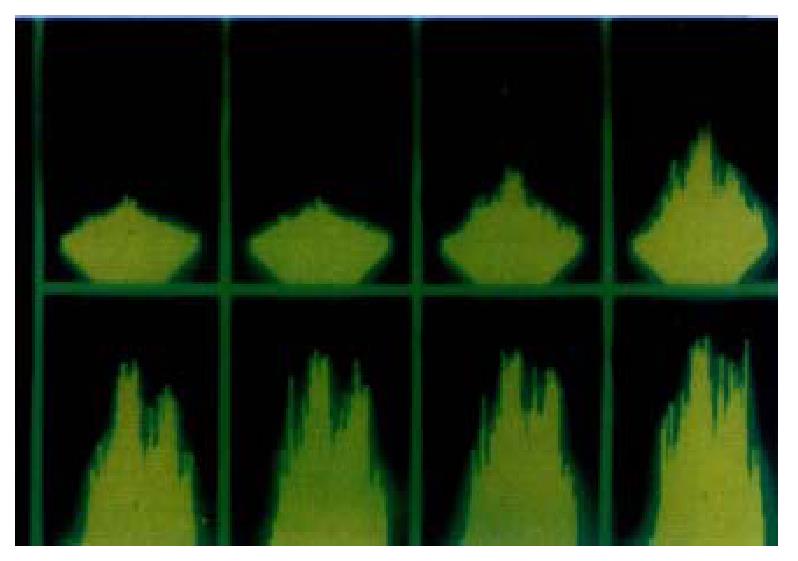
Figure 2 At the presence of extracellular Ca2+, intracellular Ca2+ concentra-tion changed under the LSCM(1 image·s-1) after the addition of agonists, and it shows spatially heterogeneous alteration of fluorescent intensity in SO cells.
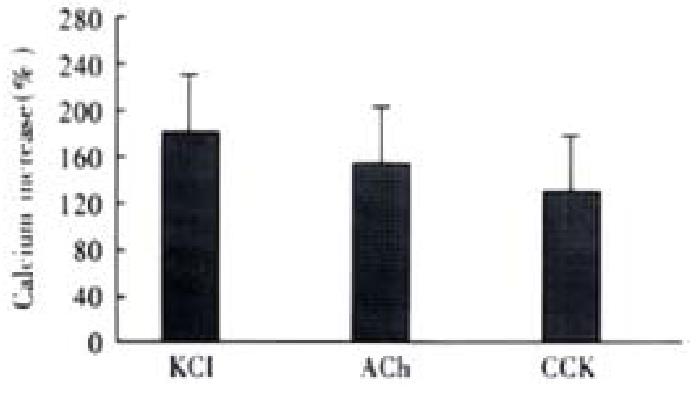
Figure 3 Intracellular fluorescence increases induced by different agonists.
Ca2+ Concentration increased from resting level of 108 ± 21 nmol·L-1 to 297 ± 66 nmol·L-1, 275 ± 58 nmol·L-1 and 251 ± 45 nmol·L-1, respectively. ANOVA was performed for the analysis, F = 0.9184, no significant difference be-tween three groups (n = 4).
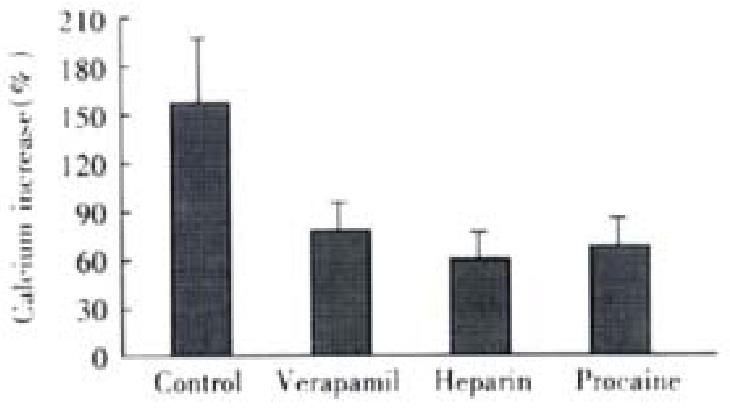
Figure 4 Effect of different antagonists on ACh induced cellular Ca2+ increase (-x ± S-x, n = 4).
Maximal Ca2+ concentration increased to 192 ± 22 nmol·L-1,175 nmol·L-1± 26 nmol·L-1 and 186 ± 30 nmol·L-1, respectively. ANOVA was performed for the analysis, F = 1.324, with no significant difference be-tween the three experimental groups (n = 4 ).
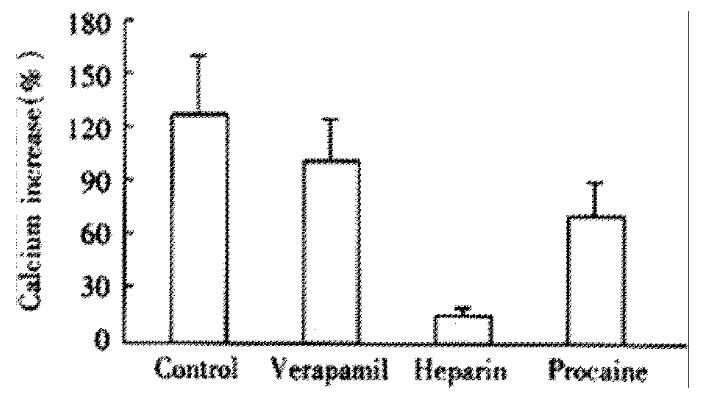
Figure 5 Effect of different antagonists on CCK induced cellular Ca2+ increase (-x ± S-x, n = 4).
Maximal Ca2+concentration increased to 220 ± 26 nmol·L-1, 133 ± 21 nmol·L-1 and 201 ± 40 nmol·L-1, respectively. SNK-q test was performed, there was a statistical difference between heparin treated group and other two groups, P < 0.01.
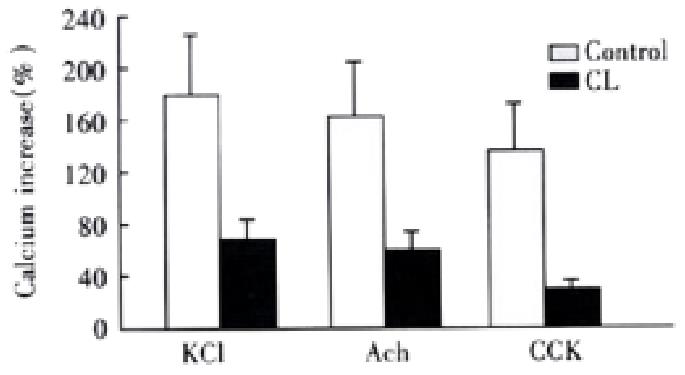
Figure 6 Effect of cholesterol liposome on cellular Ca2+ mobilization (-x ± S-x, n = 4).
Agonists induced cellular influorescence increase percentages were markedly less than that of control group.
- Citation: Wang XJ, Wei JG, Wang CM, Wang YC, Wu QZ, Xu JK, Yang XX. Effect of cholesterol liposomes on calcium mobilization in muscle cells from the rabbit sphincter of Oddi. World J Gastroenterol 2002; 8(1): 144-149
- URL: https://www.wjgnet.com/1007-9327/full/v8/i1/144.htm
- DOI: https://dx.doi.org/10.3748/wjg.v8.i1.144


