Copyright
©The Author(s) 2001.
World J Gastroenterol. Dec 15, 2001; 7(6): 864-867
Published online Dec 15, 2001. doi: 10.3748/wjg.v7.i6.864
Published online Dec 15, 2001. doi: 10.3748/wjg.v7.i6.864
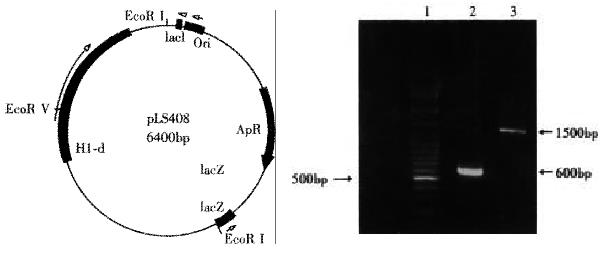
Figure 1 Map of pLS408 (left) and gel electrophoresis of PCR product (right).
Lane 1: 100 bp DNA ladder, lane 2: PCR product of partial flagellin C gene, lane 3: PCR product of flagellin C gene.
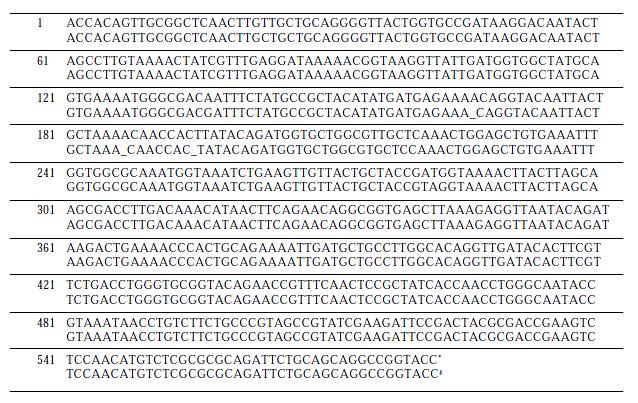
Figure 2 Comparison of nucleotide sequence between PCR product and the corresponding sequence reported previously (all differences are shadowed or dashed).
*Sequence of partial flagellin C PCR product, #Sequence from Genbank X03395
Figure 3 Comparison of amino acid sequences among different strains with (all differences are shadowed).
*Amino acid sequence of PCR product. #The corresponding sequences of S. muenchen (Genbank X03395). &The corresponding sequence of S. typhi (Genbank L21912)
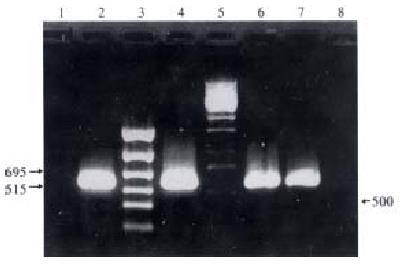
Figure 4 Amplification of flagellin C gene fragment in different Salmonella strains.
Lane 1: S. enteritis; 2, 4: S. typhi; 3: PCR DNA marker; 5: 100 bp DNA ladder; 6: S. typhimurium; 7: S. muenchen (plasmid pLS408); 8: S. typhoid.
- Citation: Ji WS, Hu JL, Qiu JW, Pan BR, Peng DR, Shi BL, Zhou SJ, Wu KC, Fan DM. Relationship between genotype and phenotype of flagellin C in Salmonella. World J Gastroenterol 2001; 7(6): 864-867
- URL: https://www.wjgnet.com/1007-9327/full/v7/i6/864.htm
- DOI: https://dx.doi.org/10.3748/wjg.v7.i6.864


