Copyright
©The Author(s) 2001.
World J Gastroenterol. Dec 15, 2001; 7(6): 830-835
Published online Dec 15, 2001. doi: 10.3748/wjg.v7.i6.830
Published online Dec 15, 2001. doi: 10.3748/wjg.v7.i6.830
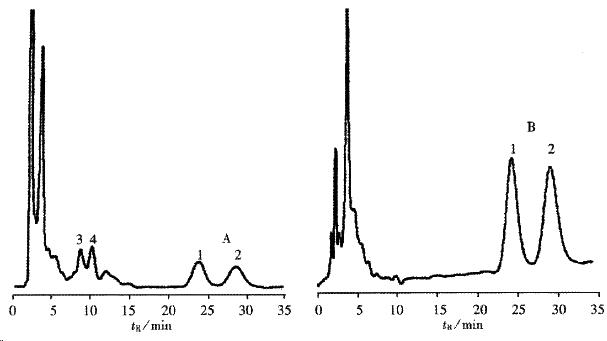
Figure 1 Chiral high performance liquid chromatogram of racemic propafenone in rat liver microsomal incubates after 30 min incubation.
A: BNF pre-treated B: without incubation. Peaks 1, 2: Diastereomers of S(+)-propafenone and R(-)-propafenone; Peaks 3, 4: Diastereomers of metabolite (N-desalkylpropafenone)
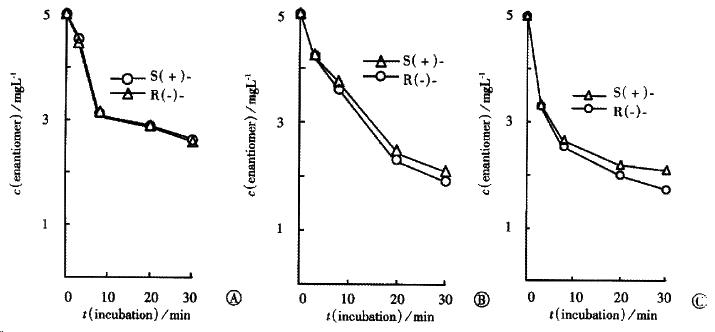
Figure 3 Concentration-time curves for S(+)- and R(-)-propafenone metabolism in rat hepatic microsomes.
A: Control; B: BNF; C: DEX.
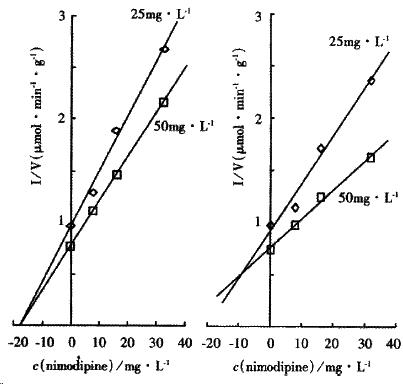
Figure 3 Dixon plot for S(+)-propafenone (Left) and R(-)-propafenone (Right) wit nimodipine as inhibitor at three concentration.
Ki for S (+)-and R(-)-PPF was 15.4, 8.mg•L¯¹, respectively. Each data point represents the mean of duplicate determinations.
- Citation: Zhou Q, Yao TW, Zeng S. Chiral metabolism of propafenone in rat hepatic microsomes treated with two inducers. World J Gastroenterol 2001; 7(6): 830-835
- URL: https://www.wjgnet.com/1007-9327/full/v7/i6/830.htm
- DOI: https://dx.doi.org/10.3748/wjg.v7.i6.830


