Copyright
©The Author(s) 2001.
World J Gastroenterol. Apr 15, 2001; 7(2): 208-215
Published online Apr 15, 2001. doi: 10.3748/wjg.v7.i2.208
Published online Apr 15, 2001. doi: 10.3748/wjg.v7.i2.208
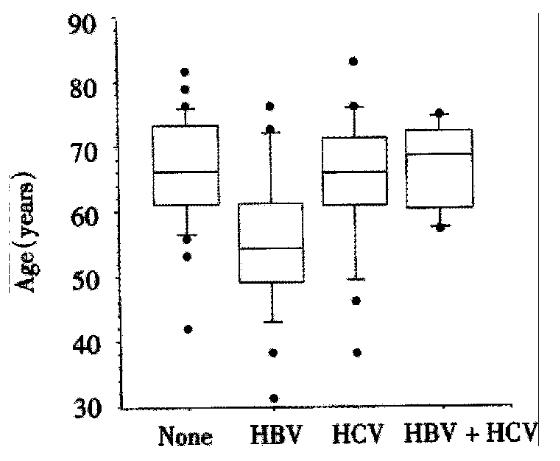
Figure 1 Box plots showing the patients’ age according to hepatitis status.
Patients with HBV-infections have a lower median age compared to patients with no hepatitis (None, n = 33), HBV-infection (HBV, n = 25), HCV Infection (HCV, n = 21), or HBV/ HCV co-infection (HBV + HCV, n = 6).
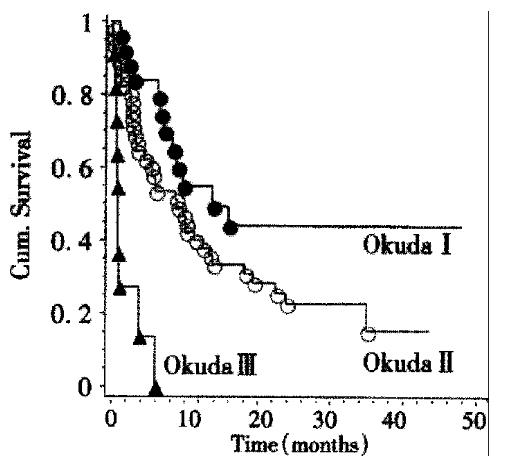
Figure 2 Kaplan-Meier-analysis of patient survival according to Okuda stage.
Significant differences between groups (P < 0.001, Log-rank test) can be seen.
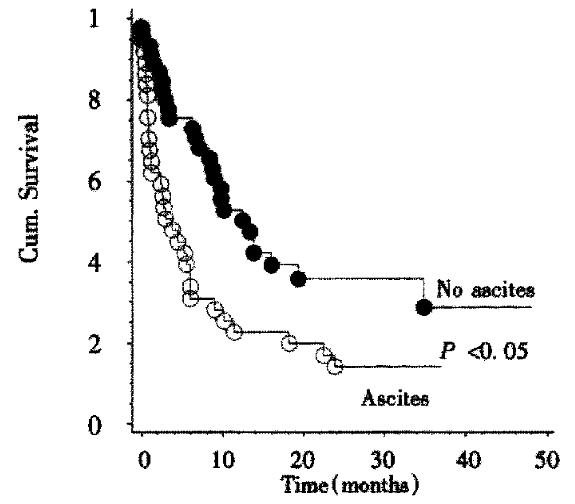
Figure 3 Kaplan-Meier-analysis of survival in relation to the presence or absence of ascites.
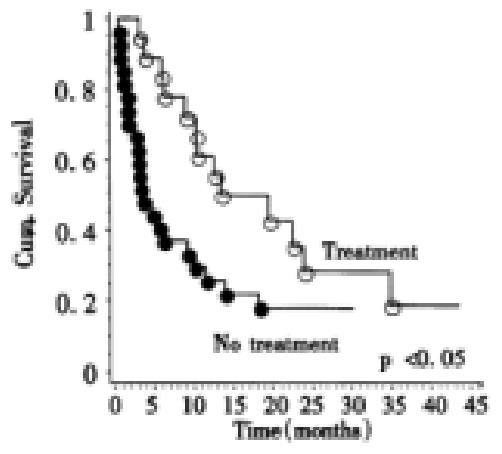
Treated patients (open circles) lived significantly longer (P < 0.05, Log-rank test) than their untreated counterparts (filled circles).
Figure 4 Kaplan-Meier-analysis of Okuda stage II patients in relationship to treatment.
Patients with ascites (open circles) lived for a significantly shorter (P < 0.05, Log-rank test) time than their counterparts without ascites (filled circles).
- Citation: Rabe C, Pilz T, Klostermann C, Berna M, Schild HH, Sauerbruch T, Caselmann WH. Clinical characteristics and outcome of a cohort of 101 patients with hepatocellular carcinoma. World J Gastroenterol 2001; 7(2): 208-215
- URL: https://www.wjgnet.com/1007-9327/full/v7/i2/208.htm
- DOI: https://dx.doi.org/10.3748/wjg.v7.i2.208


