Copyright
©The Author(s) 2001.
World J Gastroenterol. Feb 15, 2001; 7(1): 88-92
Published online Feb 15, 2001. doi: 10.3748/wjg.v7.i1.88
Published online Feb 15, 2001. doi: 10.3748/wjg.v7.i1.88
Figure 1 Fas expression of LS174T cells treated with chemotherapy drugs for 48 h.
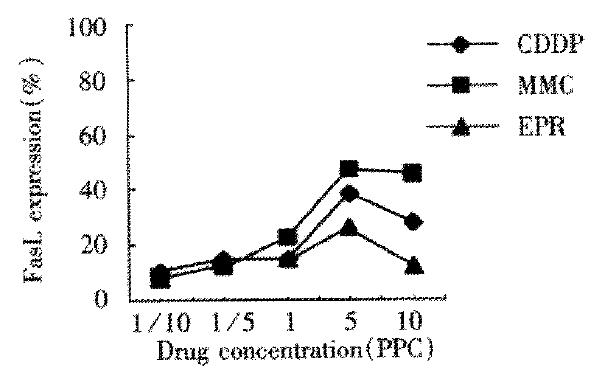
Figure 2 FasL expression of LS174T cells treated with chemotherapy drugs for 48 h.
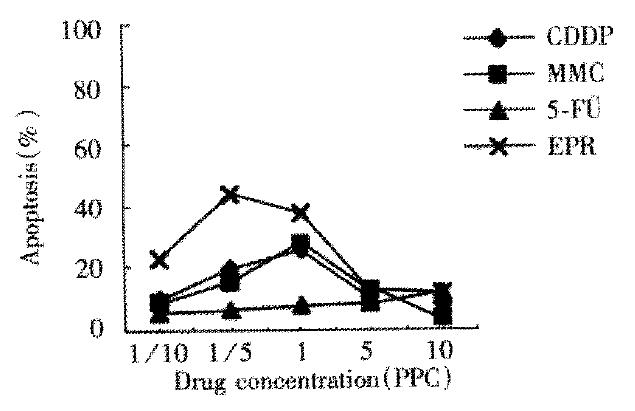
Figure 3 Apoptosis of LS174T cells treated with chemotherapy drugs for 48 h.
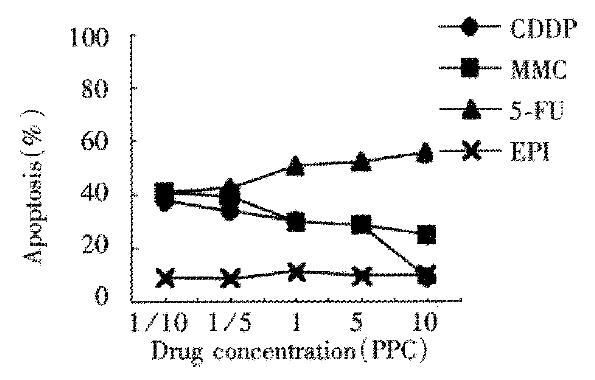
Figure 4 Apoptosis of LoVo cells treated with chemotherapy drugs for 24 h.
Figure 5 DNA ladder LS174T cells treated with chemotherapy drugs for 48 h (1.
Markers; 2. The control group; 3. 5-Fu; 4. DDP; 5. EPI; 6. MMC).
Figure 6 DNA ladder of LoVo cells treated with chemotherapy drugs for 24 h (1.
Markers; 2. The control group; 3. 5-Fu; 4. DDP; 5. EPI; 6. MMC).
- Citation: Peng ZH, Xing TH, Qiu GQ, Tang HM. Relationship between Fas/FasL expression and apoptosis of colon adenocarcinoma cell lines. World J Gastroenterol 2001; 7(1): 88-92
- URL: https://www.wjgnet.com/1007-9327/full/v7/i1/88.htm
- DOI: https://dx.doi.org/10.3748/wjg.v7.i1.88


