Copyright
©The Author(s) 2001.
World J Gastroenterol. Feb 15, 2001; 7(1): 66-73
Published online Feb 15, 2001. doi: 10.3748/wjg.v7.i1.66
Published online Feb 15, 2001. doi: 10.3748/wjg.v7.i1.66
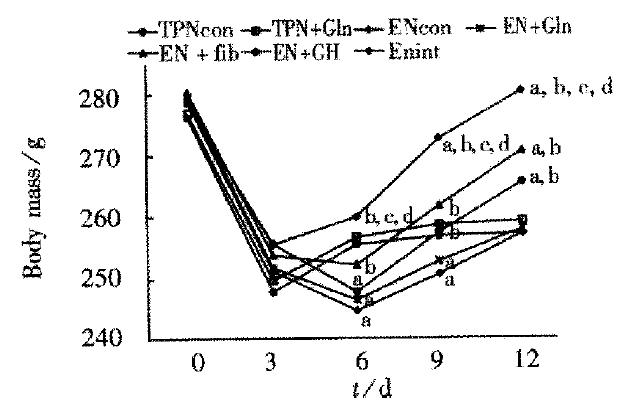
Figure 1 Body mass before and after surgery.
aP < 0.05, vs TPNcon; bP < 0.05, vs ENcon; cP < 0.05, vs EN + GH; dP < 0.05, vs EN + Fib. Day 0, refers to the day operation was performed, from which the time was dated.
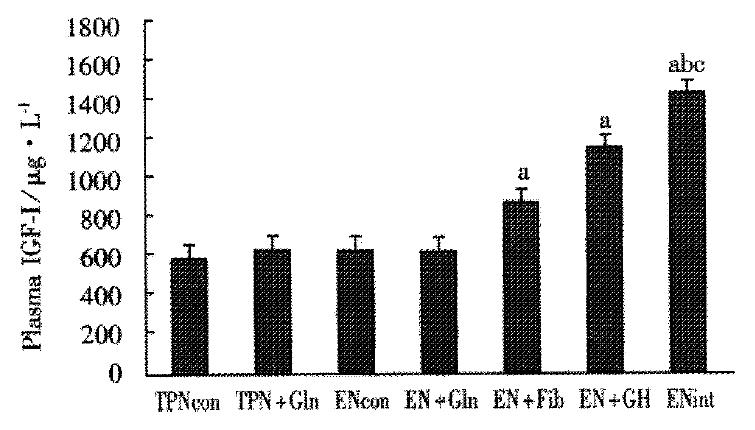
Figure 2 Plasma insulin-like growth factor level on day 12.
aP < 0.05, vs Encon; bP < 0.05, vs EN + Fib; cP < 0.05, vs EN + GH.
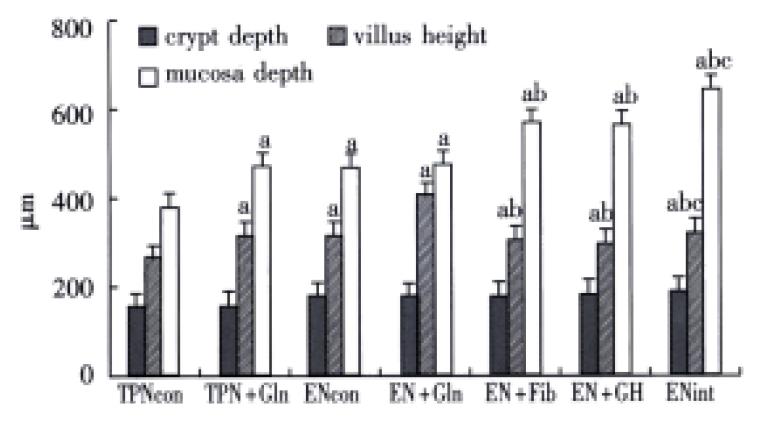
Figure 3 Crypt depth, villus height and mucosal thickness of the remnant ileum.
aP < 0.05, vs TPNcon; bP < 0.05, vs ENcon; cP < 0.05, vs EN + GH.
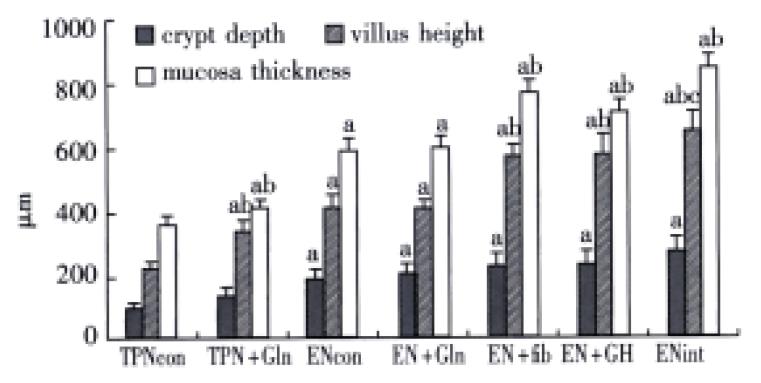
Figure 4 Crypt depth, villus height and mucosal thickness of the remnant jejunum.
aP < 0.05, vs TPNcon; bP < 0.05, vs ENcon; cP < 0.05, vs EN + GH.
- Citation: Zhou X, Li YX, Li N, Li JS. Effect of bowel rehabilitative therapy on structural adaptation of remnant small intestine: animal experiment. World J Gastroenterol 2001; 7(1): 66-73
- URL: https://www.wjgnet.com/1007-9327/full/v7/i1/66.htm
- DOI: https://dx.doi.org/10.3748/wjg.v7.i1.66


