Copyright
©The Author(s) 1999.
World J Gastroenterol. Oct 15, 1999; 5(5): 391-396
Published online Oct 15, 1999. doi: 10.3748/wjg.v5.i5.391
Published online Oct 15, 1999. doi: 10.3748/wjg.v5.i5.391
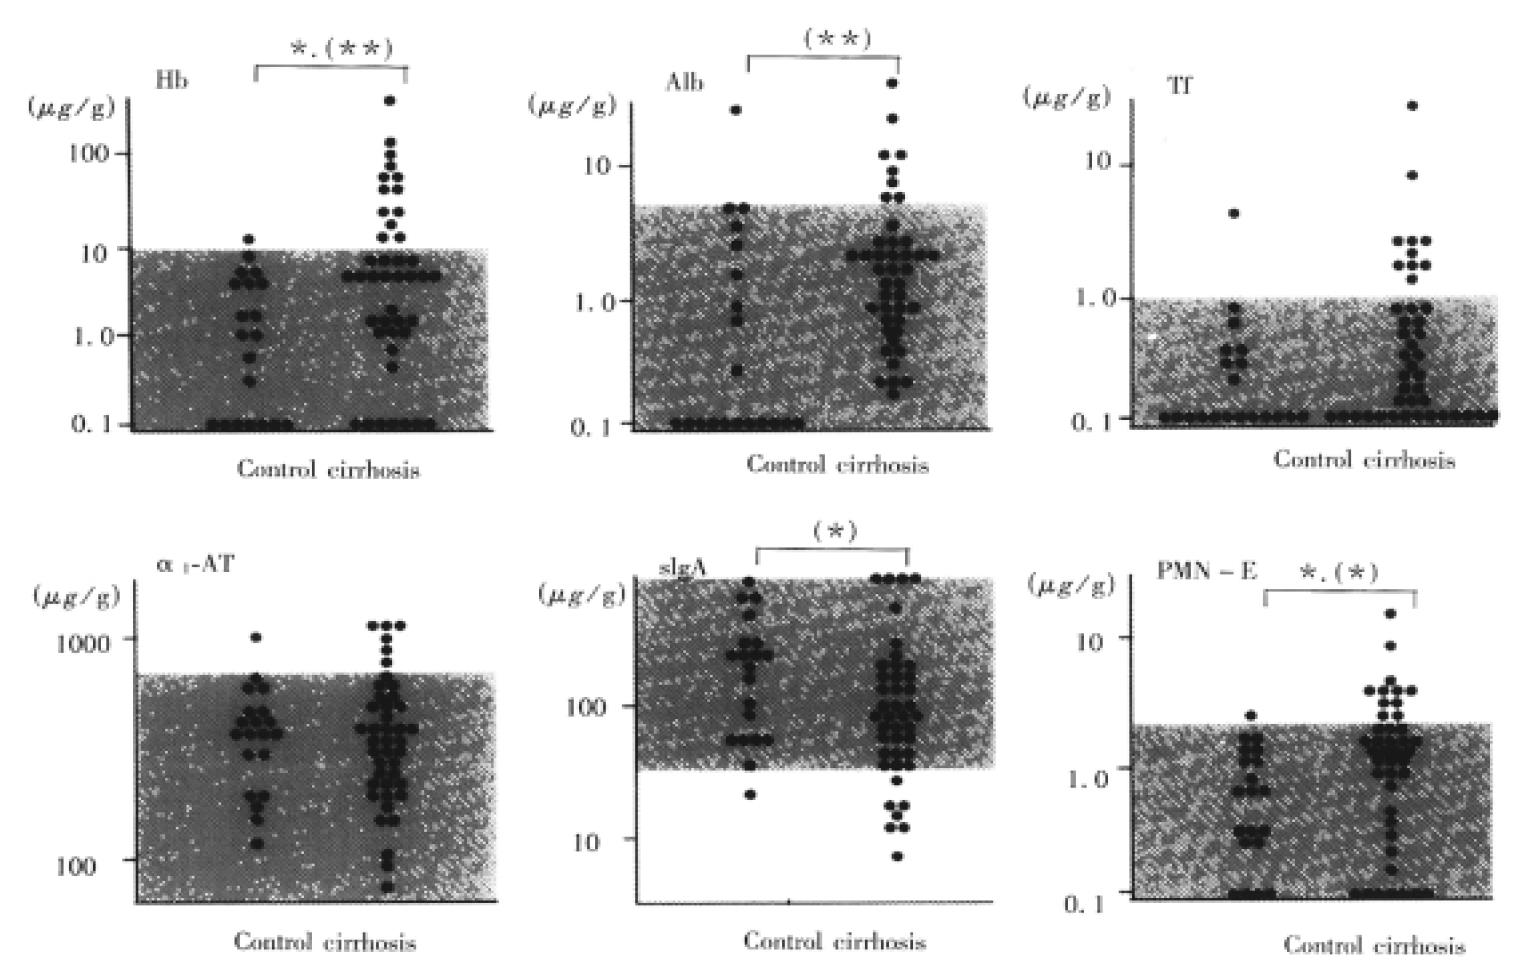
Figure 1 Fecal protein concentrations in cirrhotic patients and control subjects.
The dotted area shows the 95 percentile of the control subjects. a: P < 0.05 by c2 test; b: P < 0.05 ; c:P < 0.01 by Mann-Whitney U test.
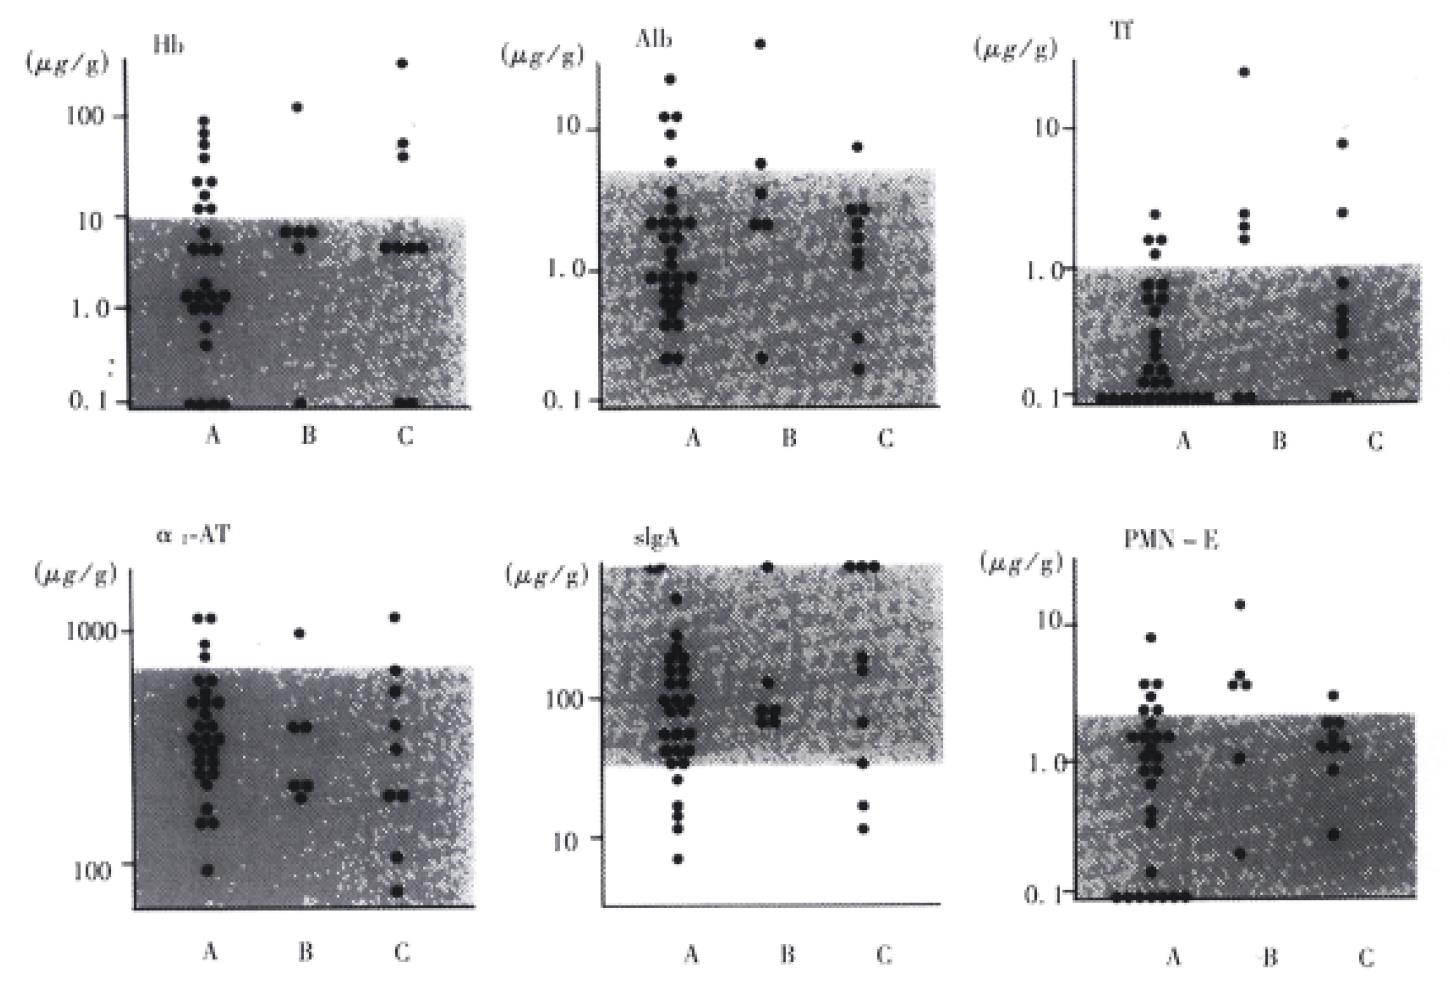
Figure 2 Relationship between fecal protein concentrations and the severity of the liver cirrhosis.
A: Child A, B: Child B, C: Child C. The dotted area shows the 95 percentile of the control subjects.
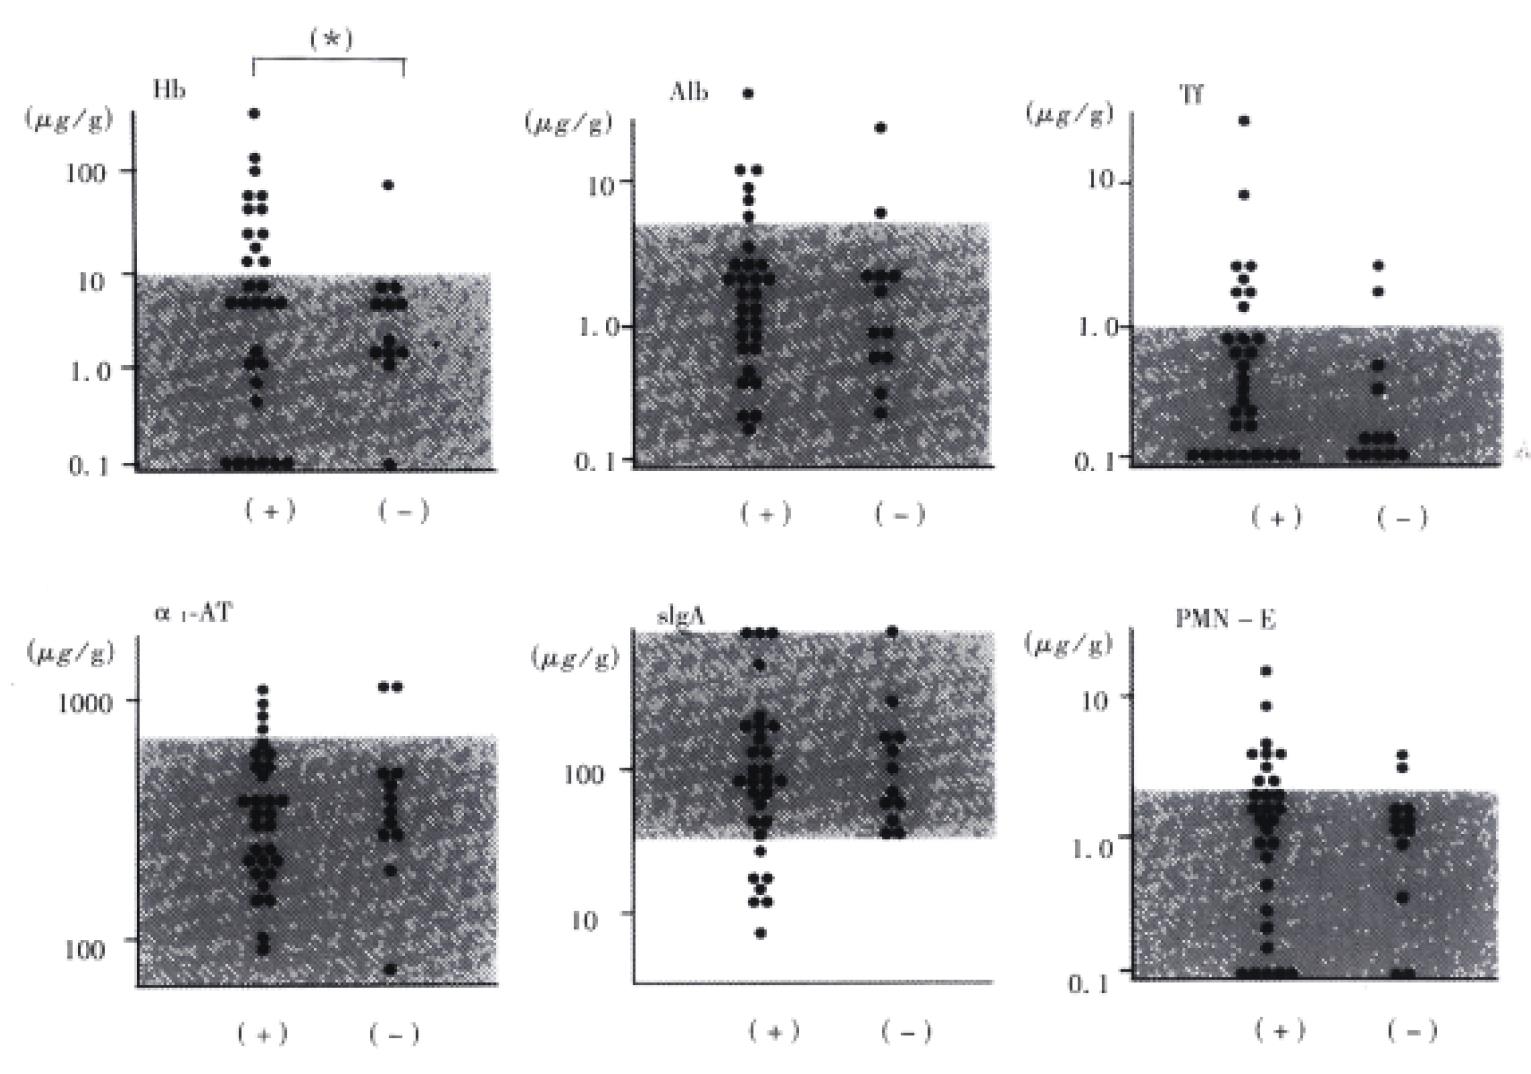
Figure 3 Relationship between fecal protein concentr ations and the presence of esophageal varices.
(+): cirrhotic patients associated with esophageal varices; (-): cirrhotic patients not associated with esophagea l varices;a: P < 0.05 by X2 test.
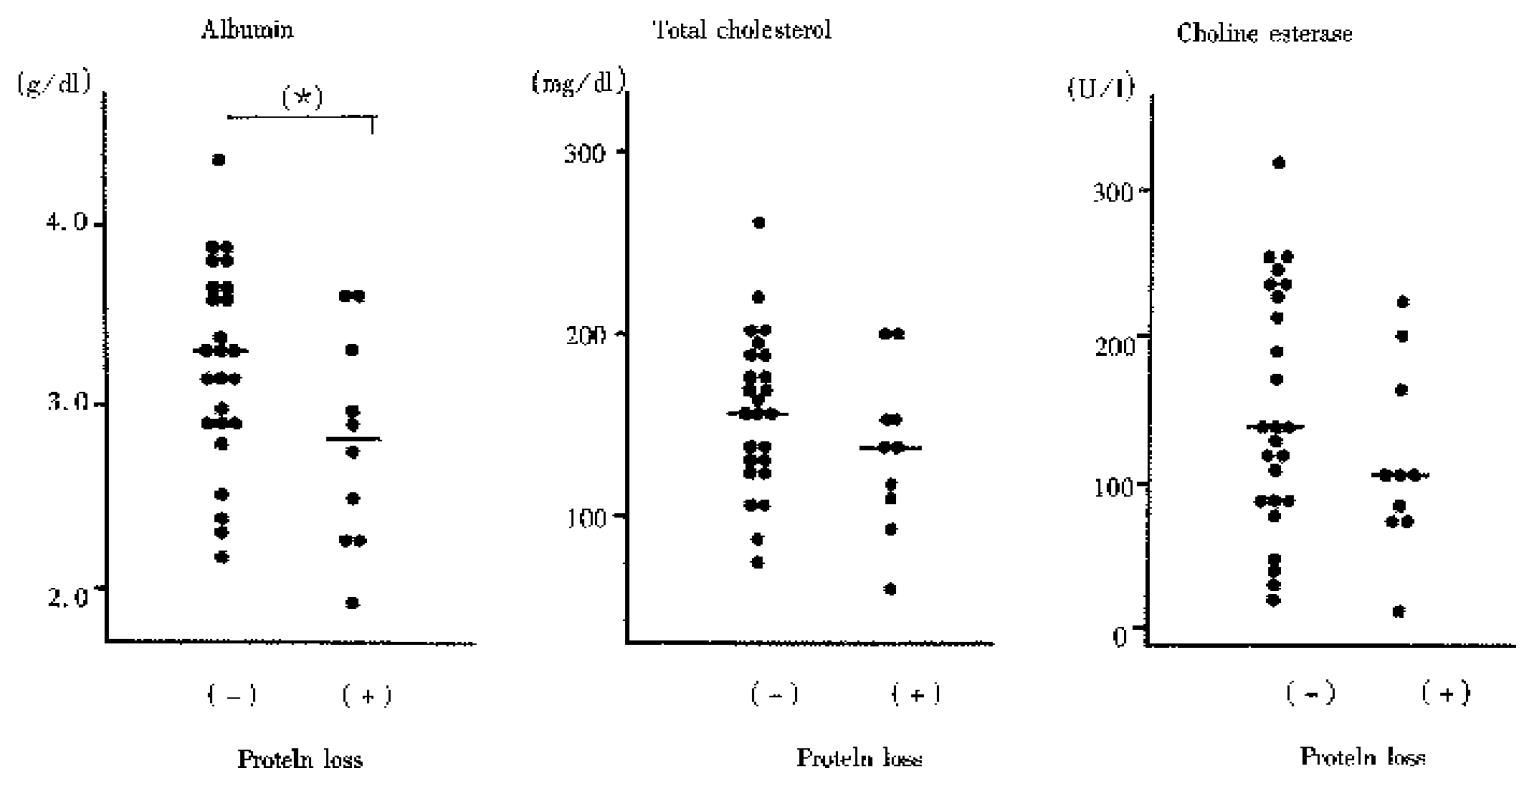
Figure 4 Serum concentrations of albumin, total cholesterol, and choline esterase in cirrhotic patients.
Comparison between groups with or without intestinal protein loss. a: P < 0.05, NS; not significant by Mann-Whitney U test.
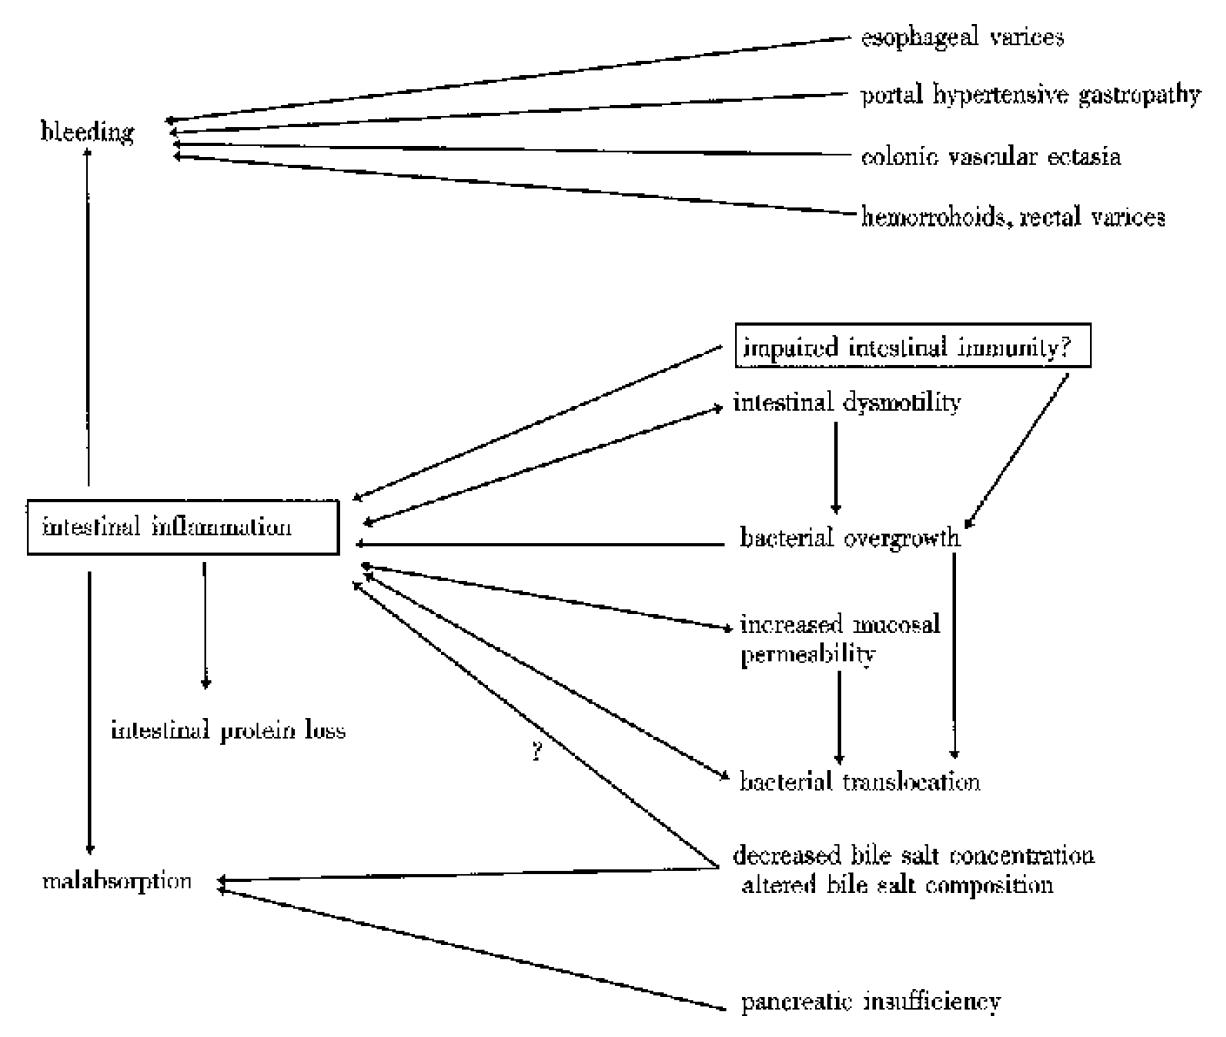
Figure 5 Proposed pathophysiology of digestive tract in cirrhotic patients.
- Citation: Saitoh O, Sugi K, Kojima K, Matsumoto H, Nakagawa K, Kayazawa M, Tanaka S, Teranishi T, Hirata I, Katsu KI. Increased prevalence of intestinal inflammation in patients with liver cirrhosis. World J Gastroenterol 1999; 5(5): 391-396
- URL: https://www.wjgnet.com/1007-9327/full/v5/i5/391.htm
- DOI: https://dx.doi.org/10.3748/wjg.v5.i5.391


