Copyright
©The Author(s) 1999.
World J Gastroenterol. Aug 15, 1999; 5(4): 324-326
Published online Aug 15, 1999. doi: 10.3748/wjg.v5.i4.324
Published online Aug 15, 1999. doi: 10.3748/wjg.v5.i4.324
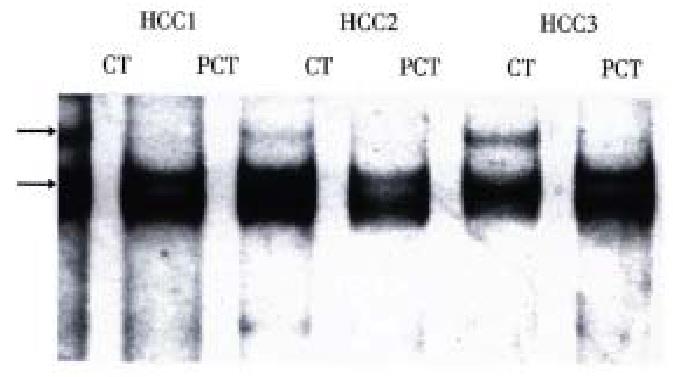
Figure 1 PCR/SSCP analysis of HCC samples.
CT represents cancerous tissue, PCT represents pericancerous tissue, shifted bands were marked by arrows. Silver staining.
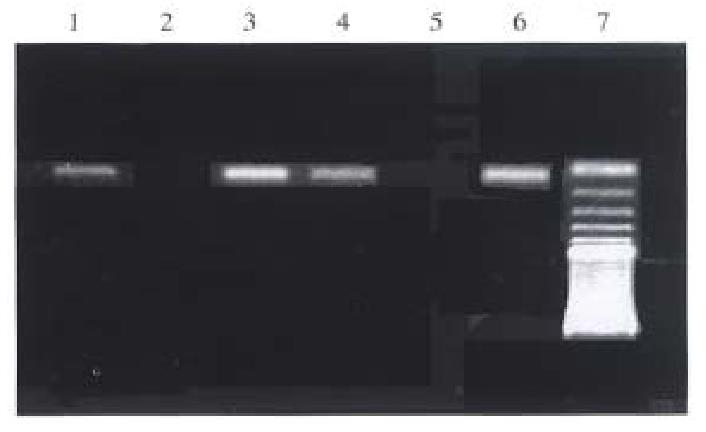
Figure 2 AS-PCR products were analyzed by running on 2% agarose gel and visualized by staining with ethidium bromide.
Lane 1 was 100 bp ladder from GIBCO, Gaithersburg, Md, USA; Lane 2, 4, 5, 7 was positive; Lane 3, 6 are negative.
- Citation: Peng XM, Yao CL, Chen XJ, Peng WW, Gao ZL. Codon 249 mutations of p53 gene in non-neoplastic liver tissues. World J Gastroenterol 1999; 5(4): 324-326
- URL: https://www.wjgnet.com/1007-9327/full/v5/i4/324.htm
- DOI: https://dx.doi.org/10.3748/wjg.v5.i4.324


