Copyright
©The Author(s) 2025.
World J Gastroenterol. Mar 7, 2025; 31(9): 103188
Published online Mar 7, 2025. doi: 10.3748/wjg.v31.i9.103188
Published online Mar 7, 2025. doi: 10.3748/wjg.v31.i9.103188
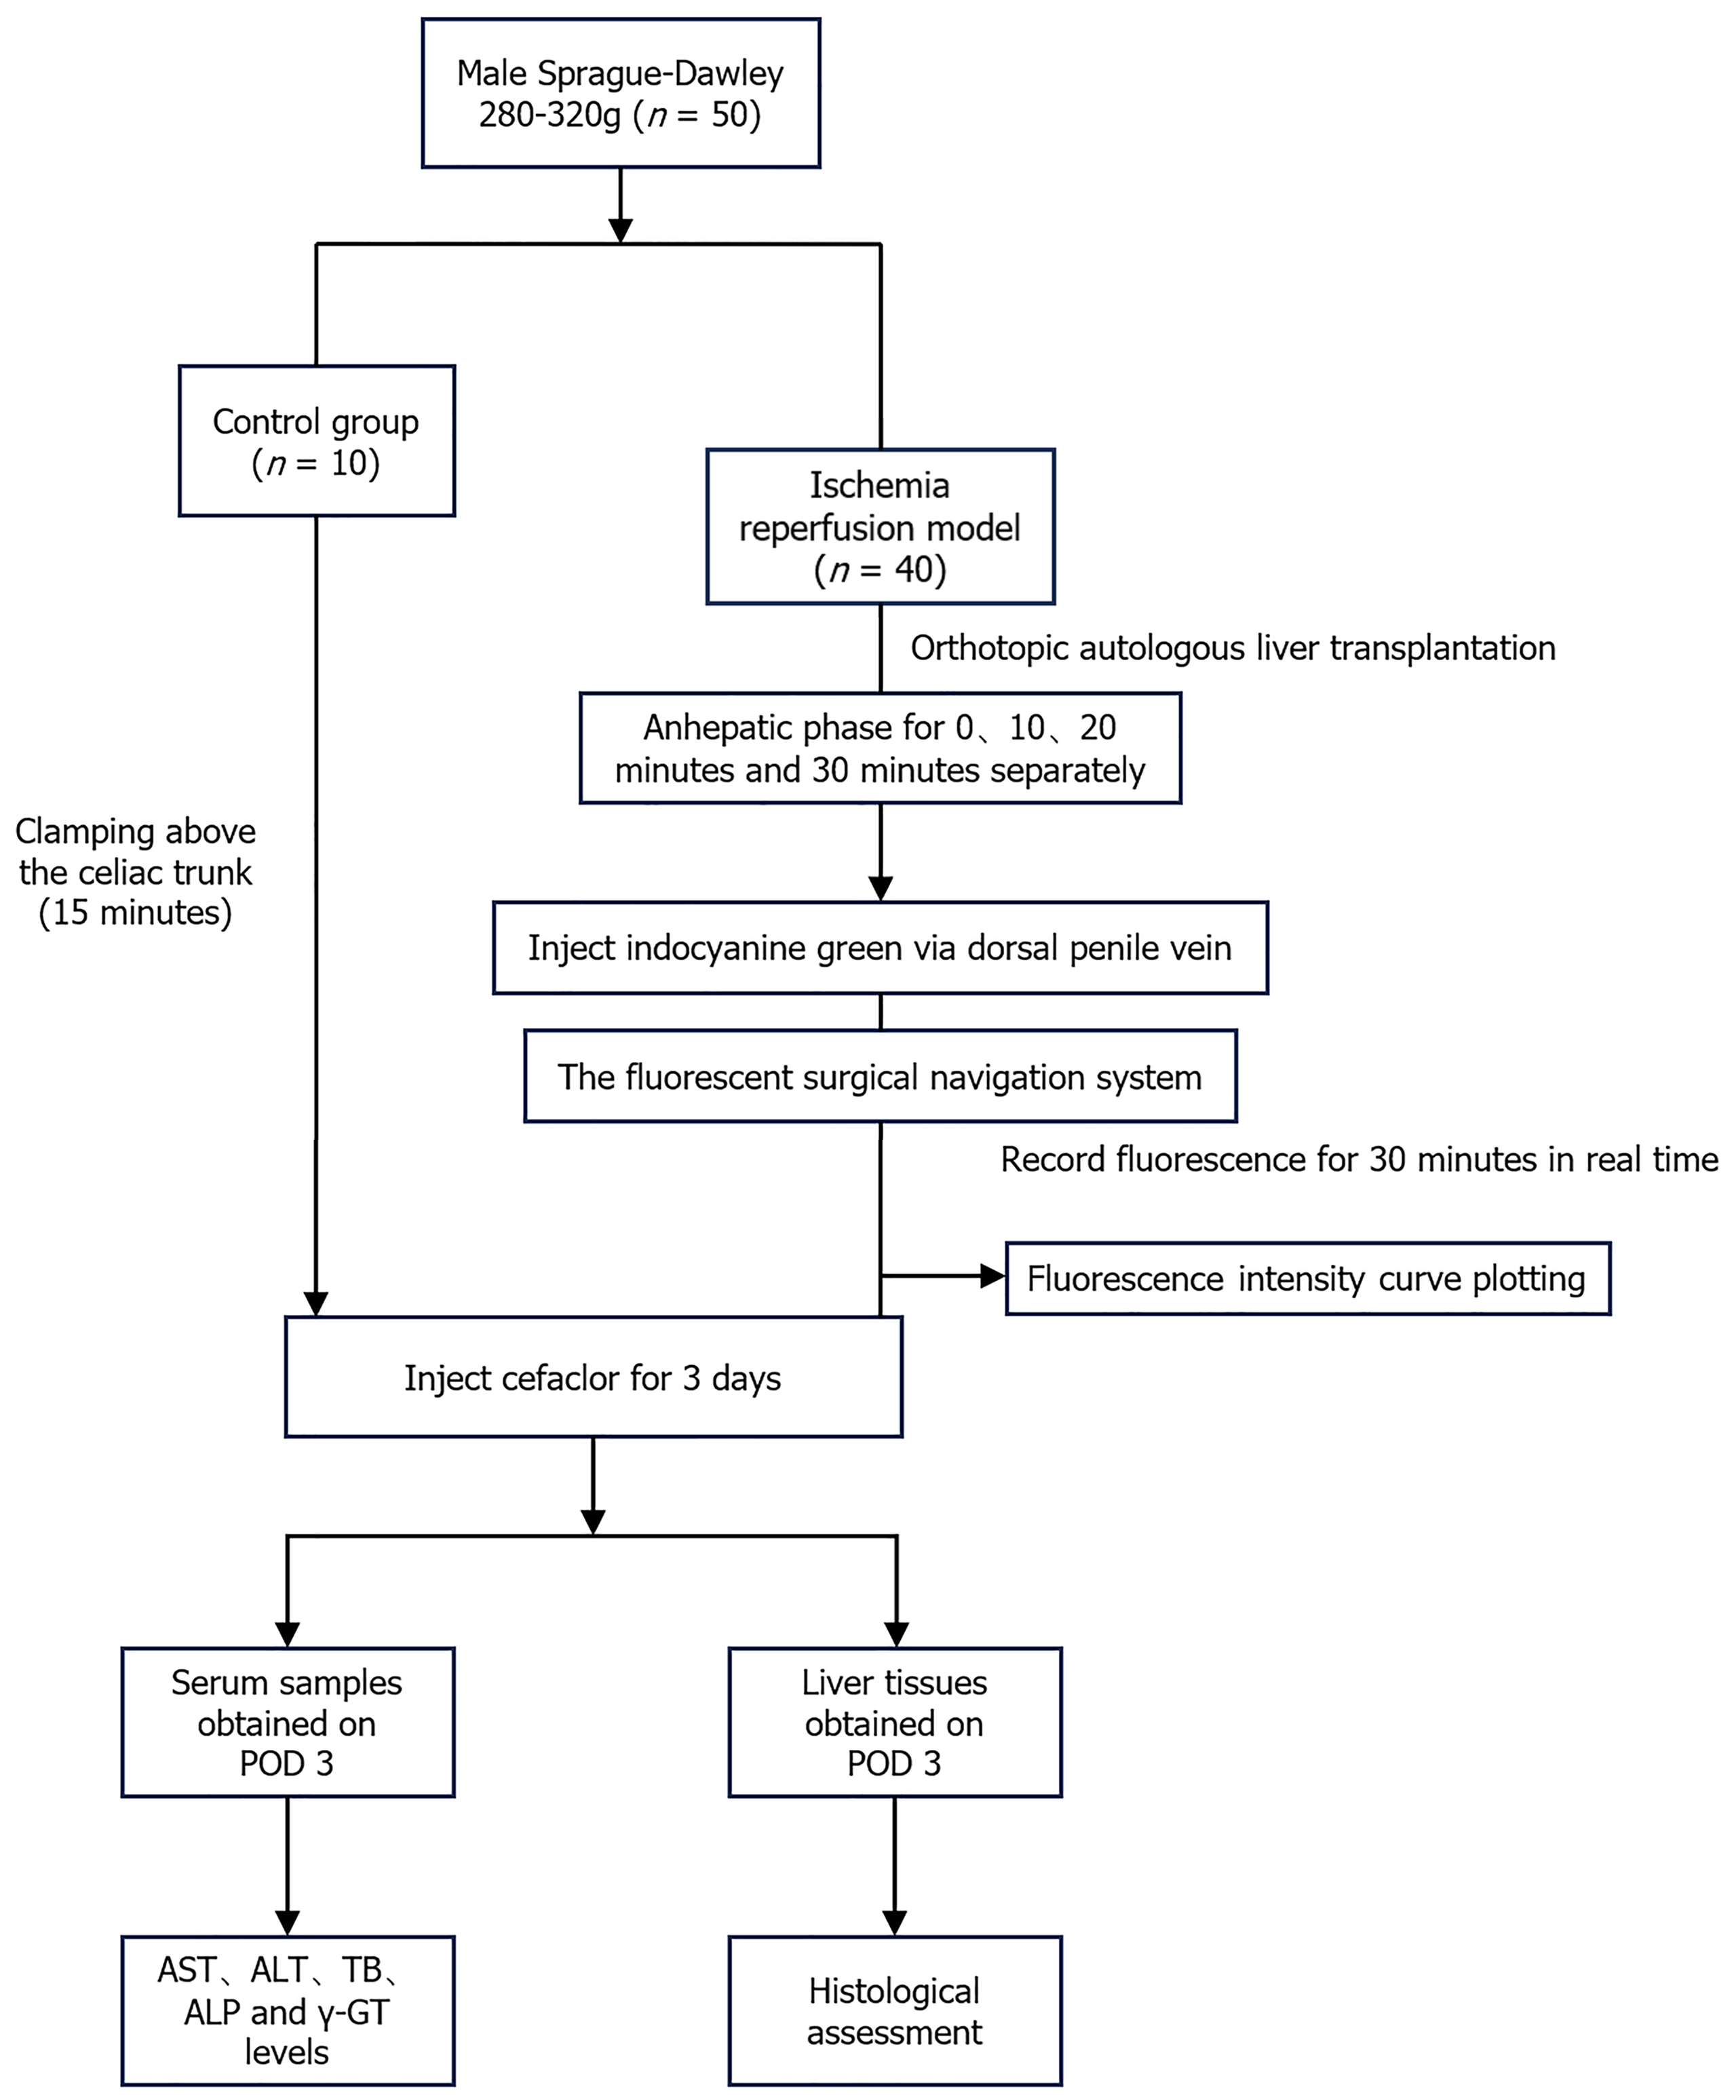
Figure 1 Experimental design.
ALT: Alanine aminotransferase; AST: Aspartate aminotransferase; ALP: Alkaline phosphatase; γ-GT: Gamma-glutamyltransferase; Total bilirubin; POD3: Postoperative day 3.
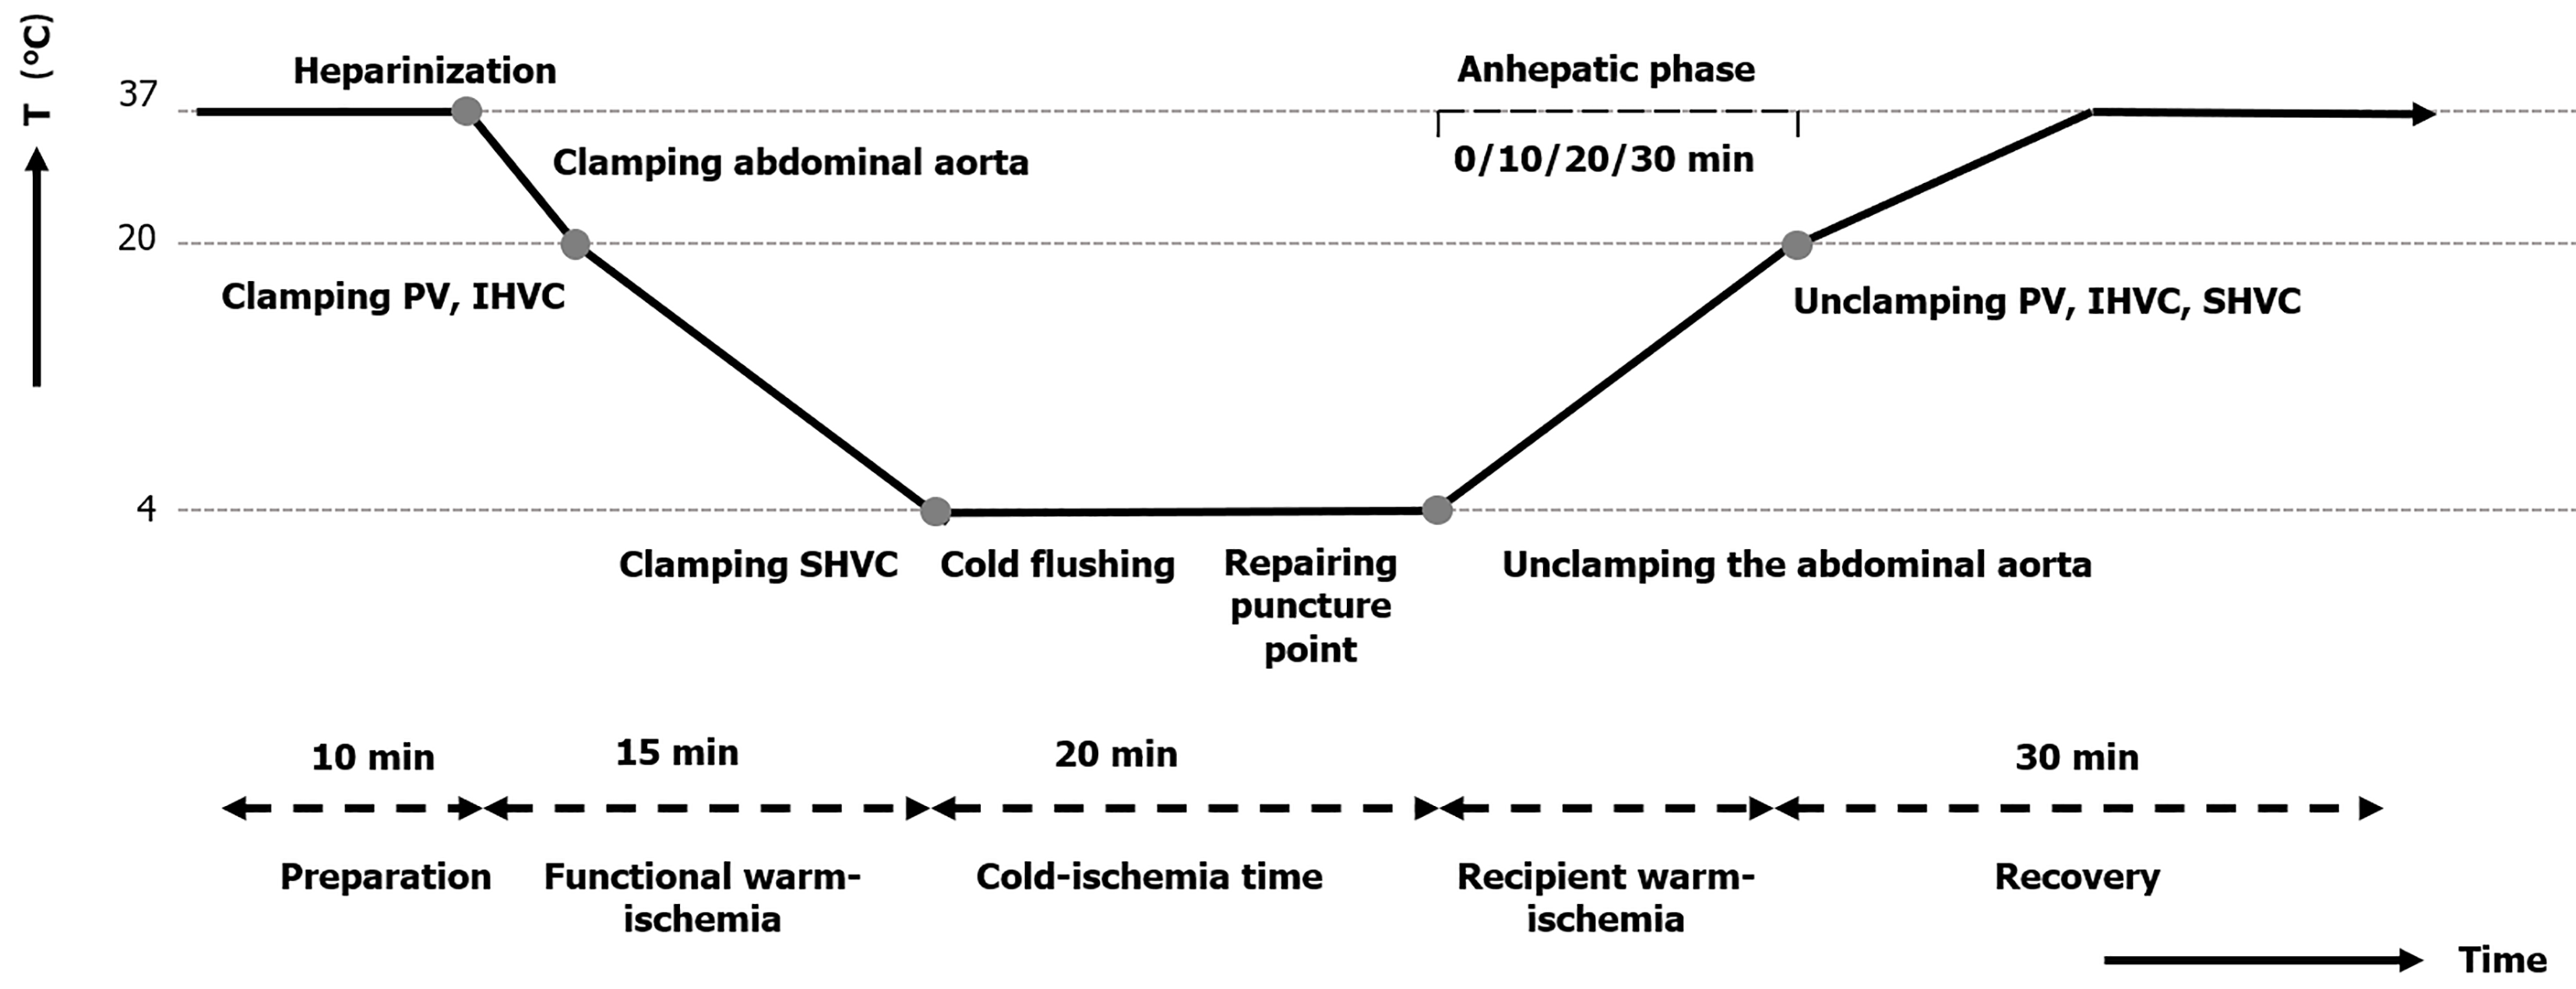
Figure 2 Schematic representation of an extended-criteria donor autologous orthotopic liver transplantation.
PV: Portal vein; SHVC: Suprahepatic vena cava; IHVC: infrahepatic vena cava.
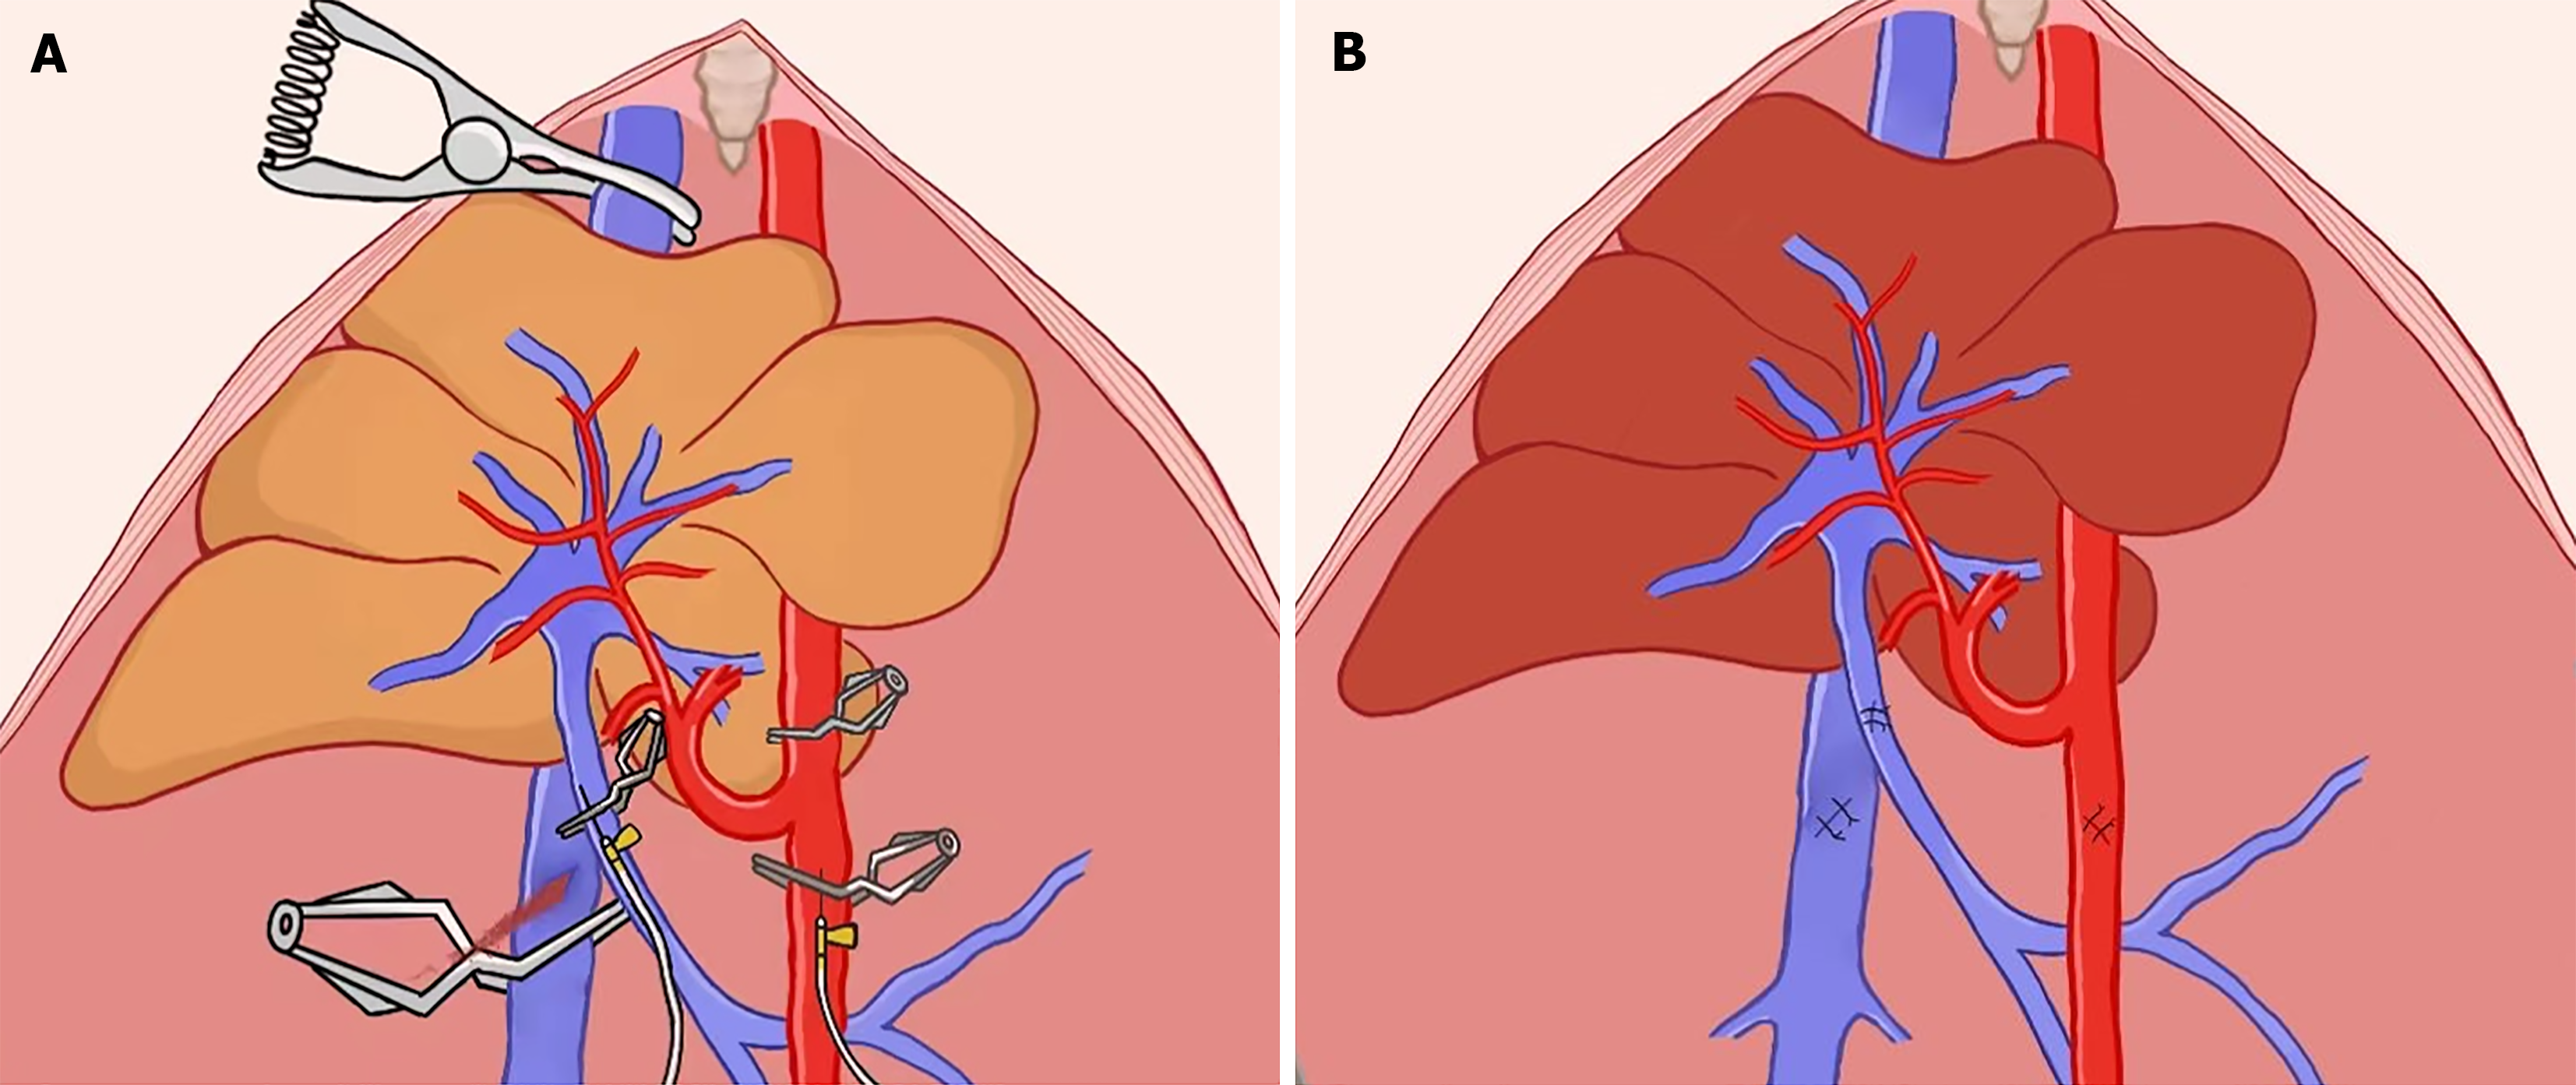
Figure 3 Rat autologous orthotopic liver transplantation.
A: The liver graft was cold flushed through the portal vein and hepatic artery with Lactated Ringer’s solution; B: Restoration of the liver graft blood flow.
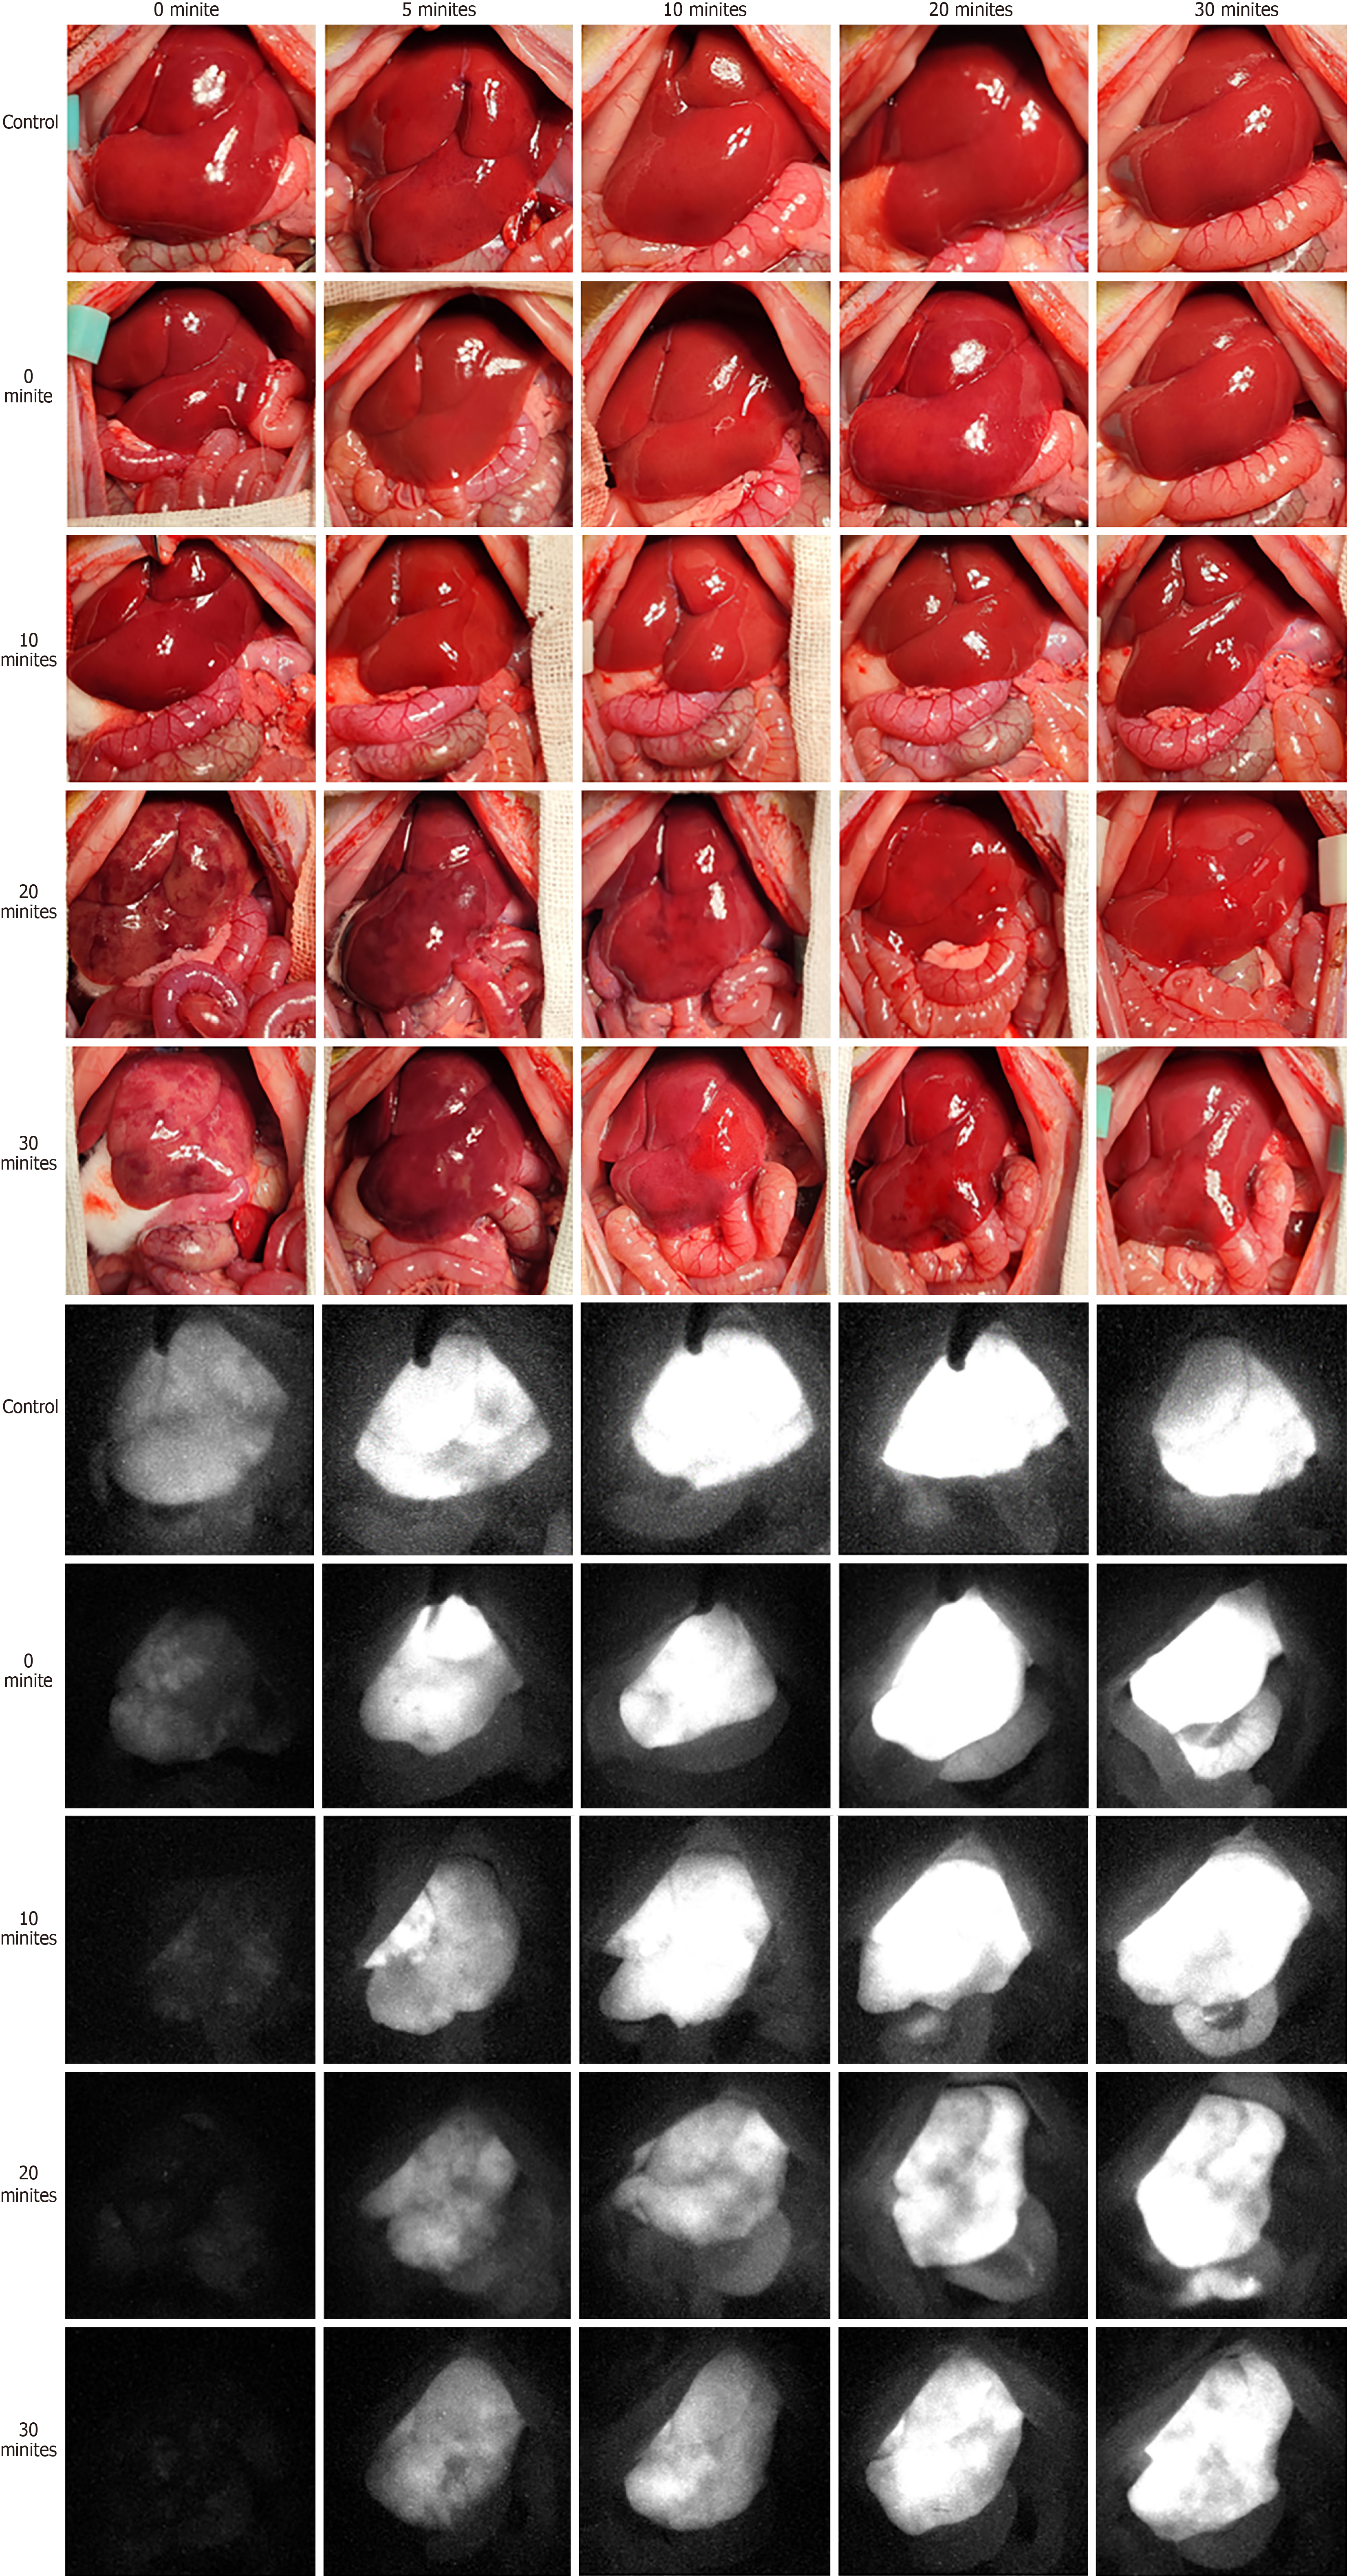
Figure 4 Color and near-infrared fluorescence images of liver grafts at different time points after the anhepatic period.
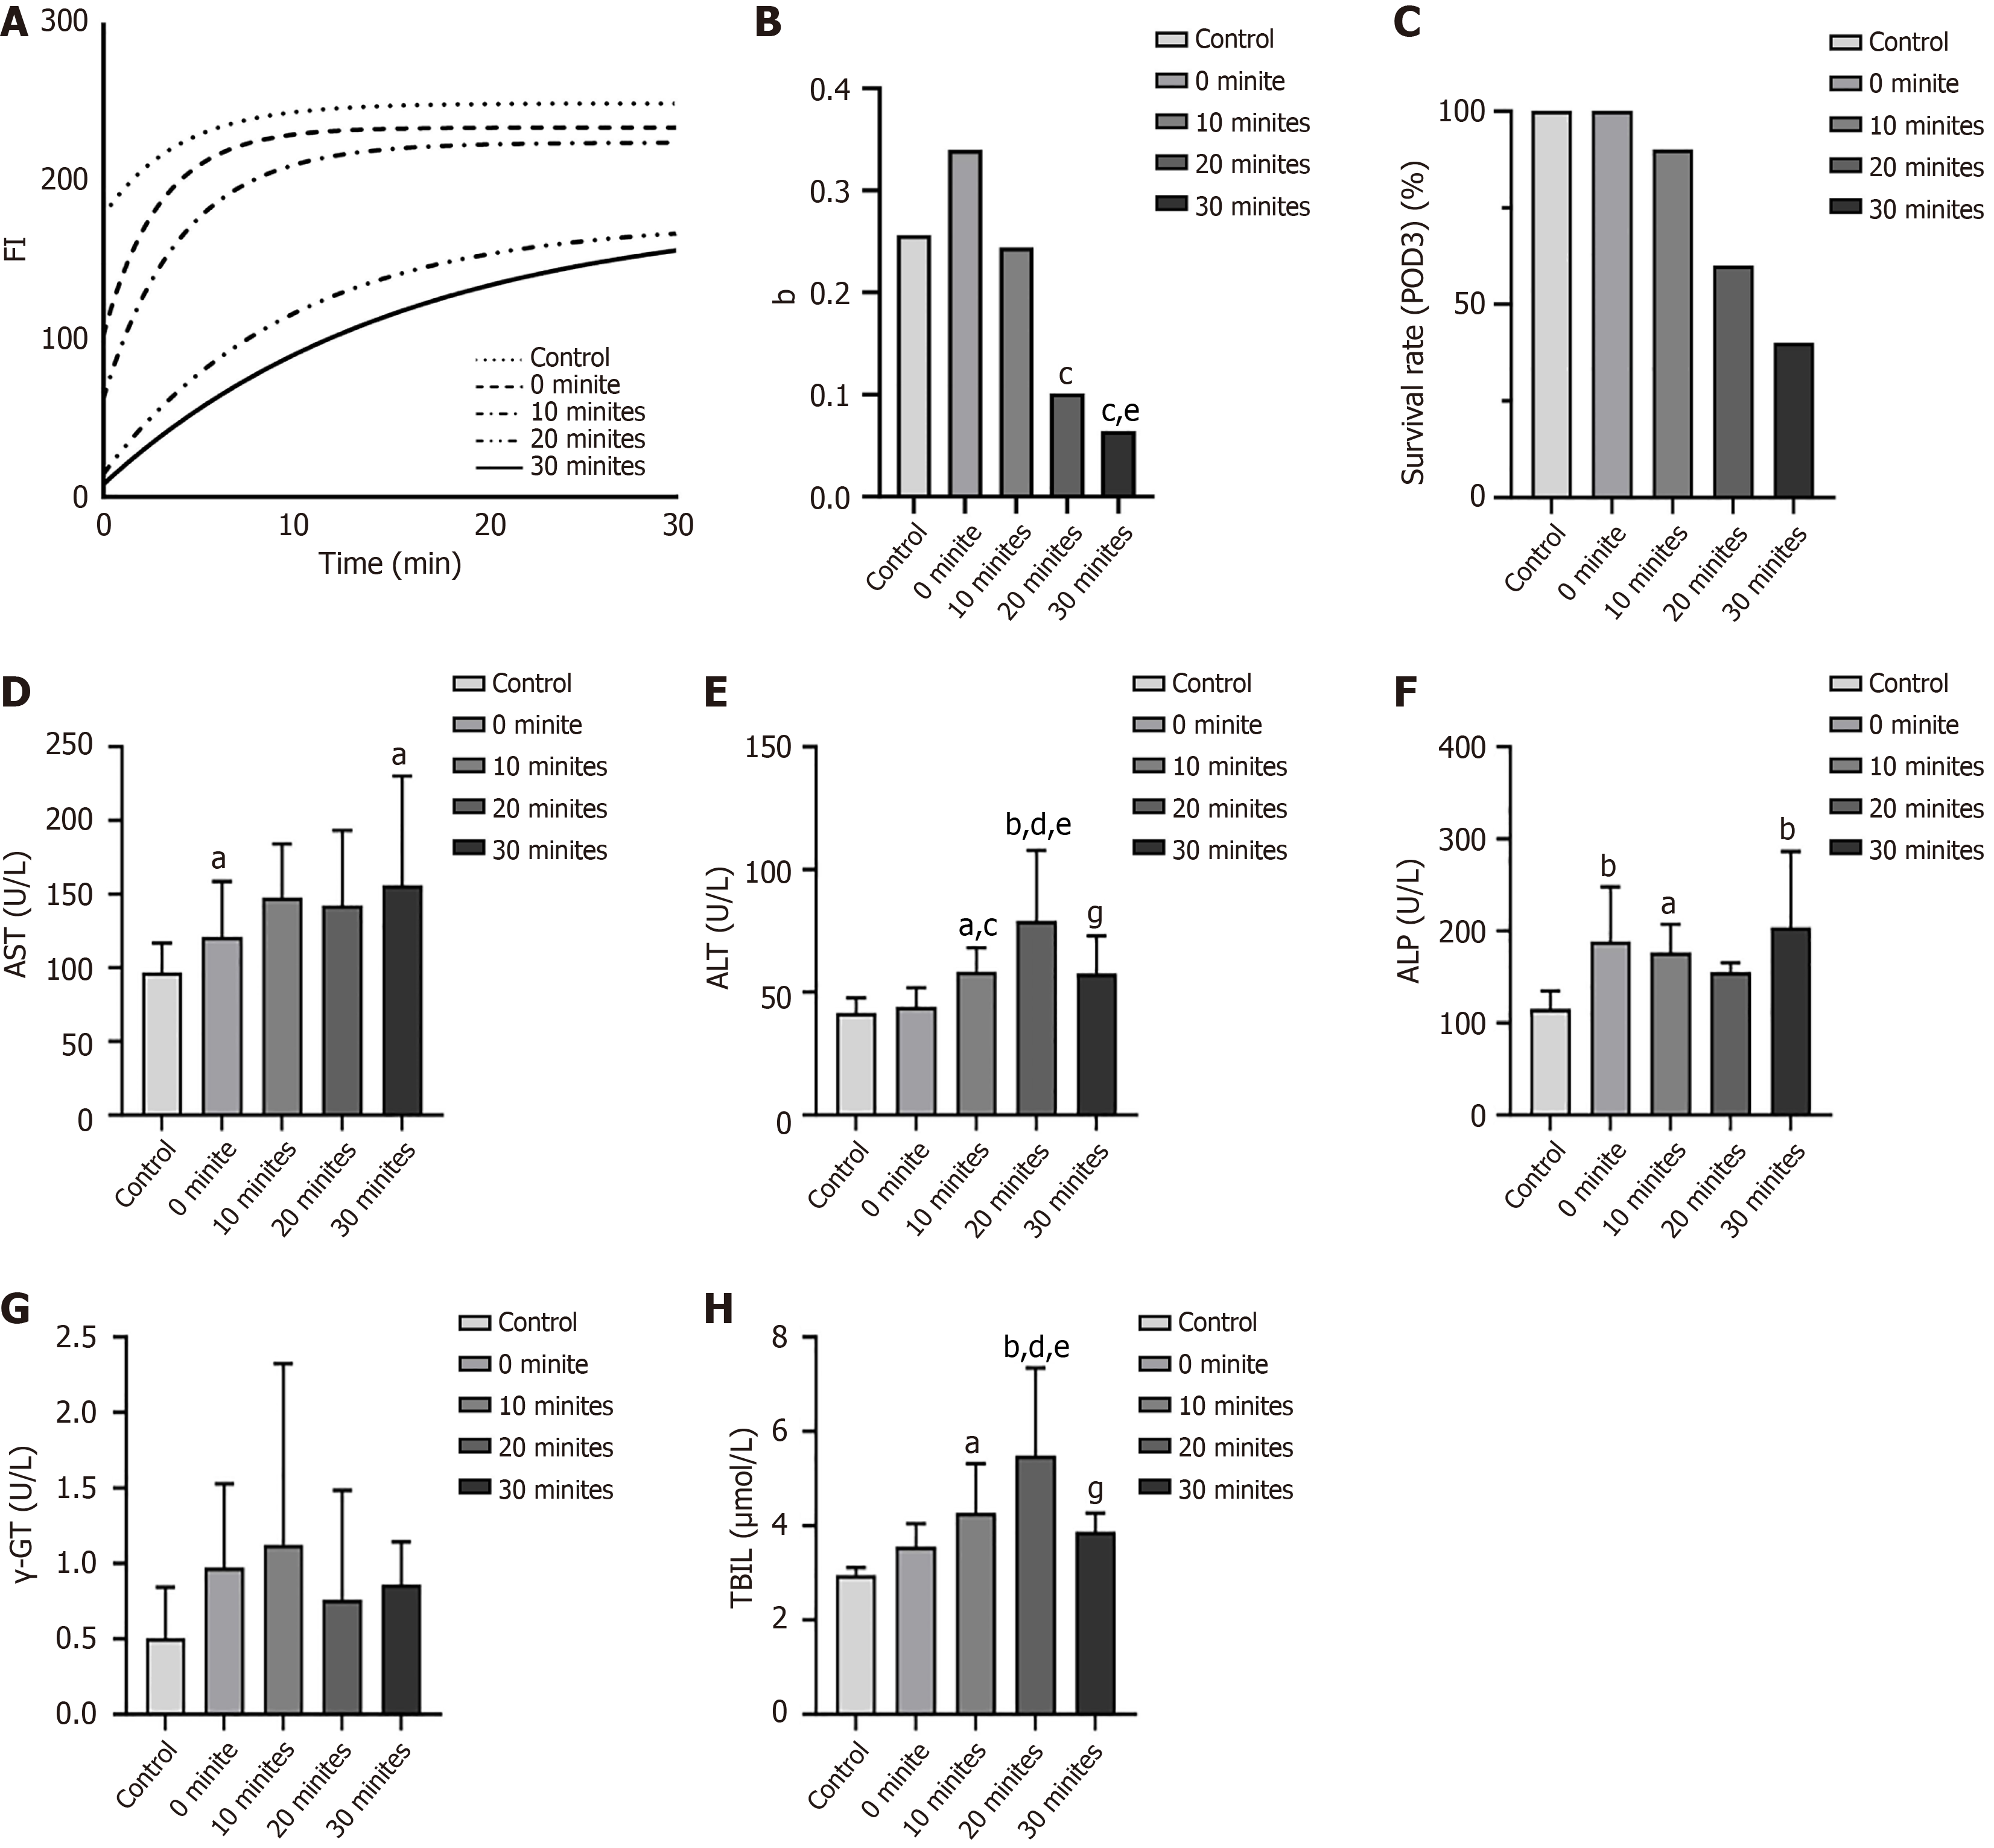
Figure 5 Survival rate (postoperative day 3), near-infrared fluorescence curve, and liver function (postoperative day 3).
A: Near-infrared fluorescence curves; B: Near-infrared fluorescence curve growth rates; C: Survival rates; D: Serum aspartate aminotransferase levels; E: Serum alanine aminotransferase levels; F: Serum alkaline phosphatase levels; G: Serum gamma-glutamyltransferase levels; H: Serum total bilirubin levels. aP < 0.05 vs control group; bP < 0.01 vs control group; cP < 0.05 vs 0-minute group; dP < 0.01 vs 0-minute group; eP < 0.05 vs 10-minute group; gP < 0.05 vs 20-minute group. FI: Fluorescence imaging; POD 3: Postoperative day 3; AST: Aspartate aminotransferase; ALT: Alanine aminotransferase; ALP: Alkaline phosphatase; γ-GT: Gamma-glutamyltransferase; TBIL: Total bilirubin.
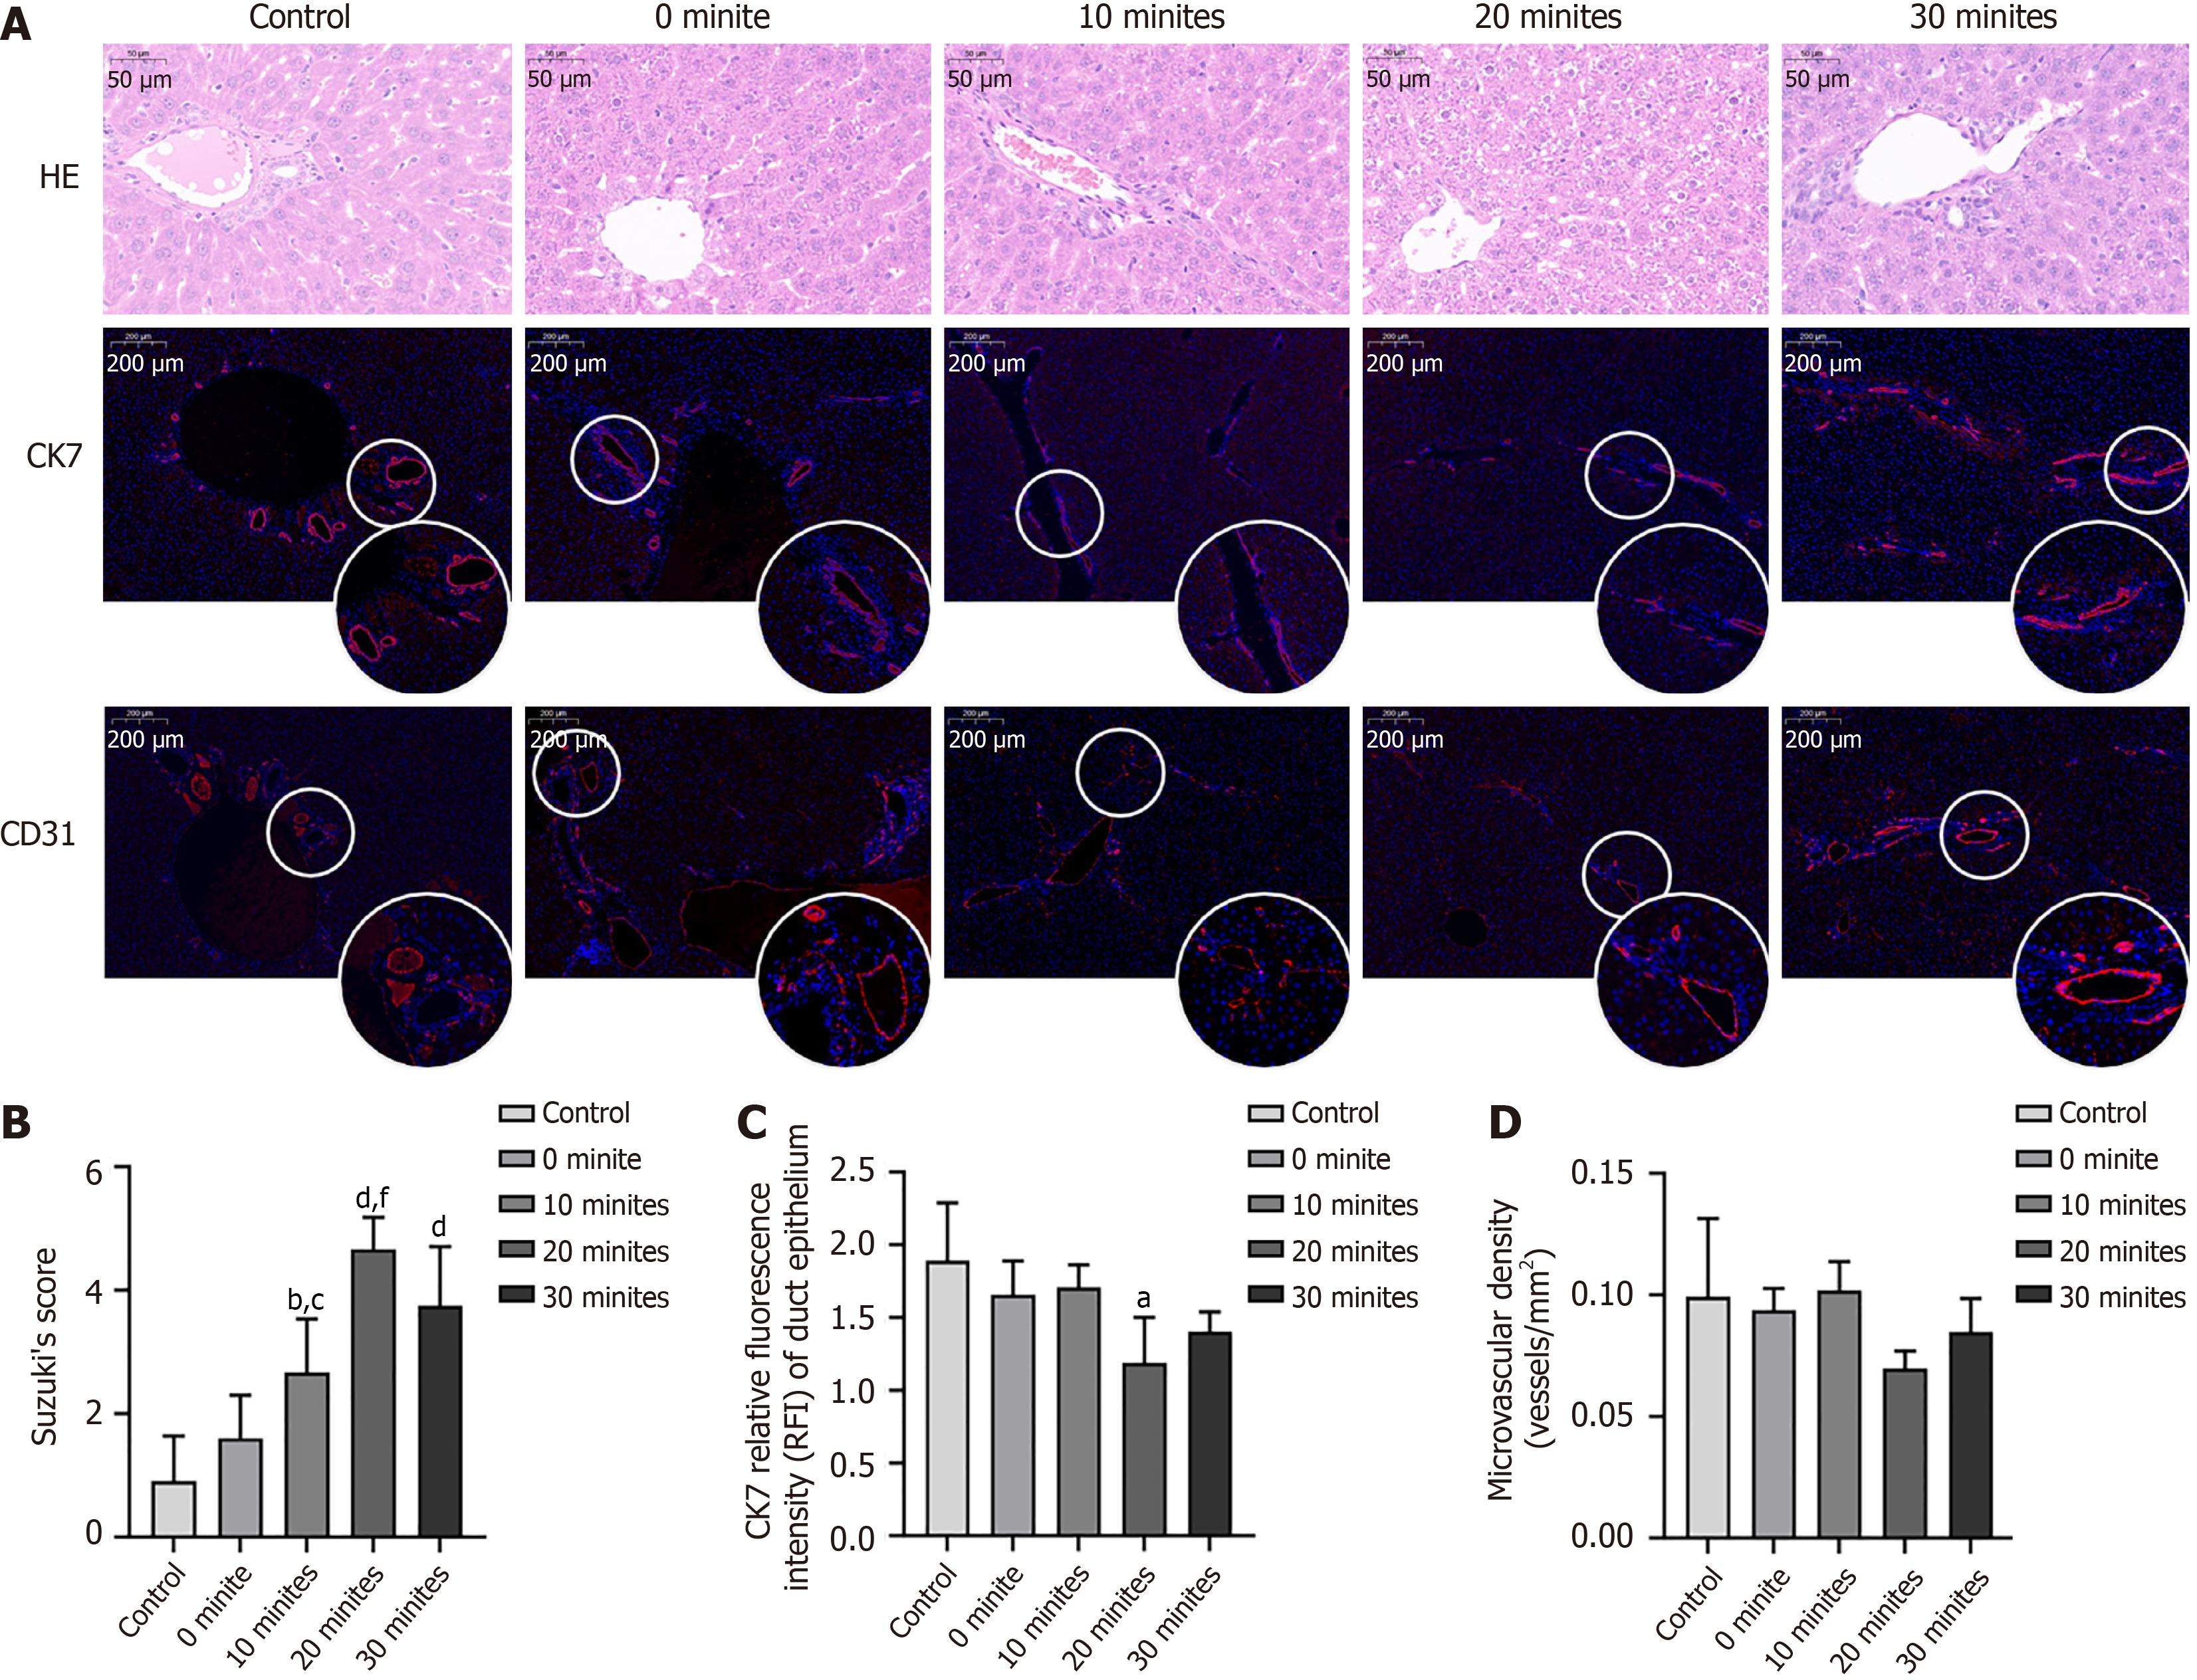
Figure 6 Histological evaluations of the liver grafts.
A: Representative hematoxylin and eosin and immunofluorescence (CK7 and CD31) staining of the liver grafts; B: Suzuki score; C: Bile duct epithelium cell (CK7+) count; D: Microvascular density quantification (CD31+). aP < 0.05 vs control group; bP < 0.01 vs control group; cP < 0.05 vs 0-minute group; dP < 0.01 vs 0-minute group; fP < 0.01 vs 10-minute group.
- Citation: Yu JW, Xiang LB, Dong XJ, Yang CX, Wang L, Liu XY, Song YH, Bai XJ, Xiao JW, Ren L, Xu QH, Yang GH, Lv Y, Lu Q. Shortening the recipient warm ischemia time could be a strategy for expanding the liver donor pool. World J Gastroenterol 2025; 31(9): 103188
- URL: https://www.wjgnet.com/1007-9327/full/v31/i9/103188.htm
- DOI: https://dx.doi.org/10.3748/wjg.v31.i9.103188


