Copyright
©The Author(s) 2025.
World J Gastroenterol. Mar 7, 2025; 31(9): 103068
Published online Mar 7, 2025. doi: 10.3748/wjg.v31.i9.103068
Published online Mar 7, 2025. doi: 10.3748/wjg.v31.i9.103068
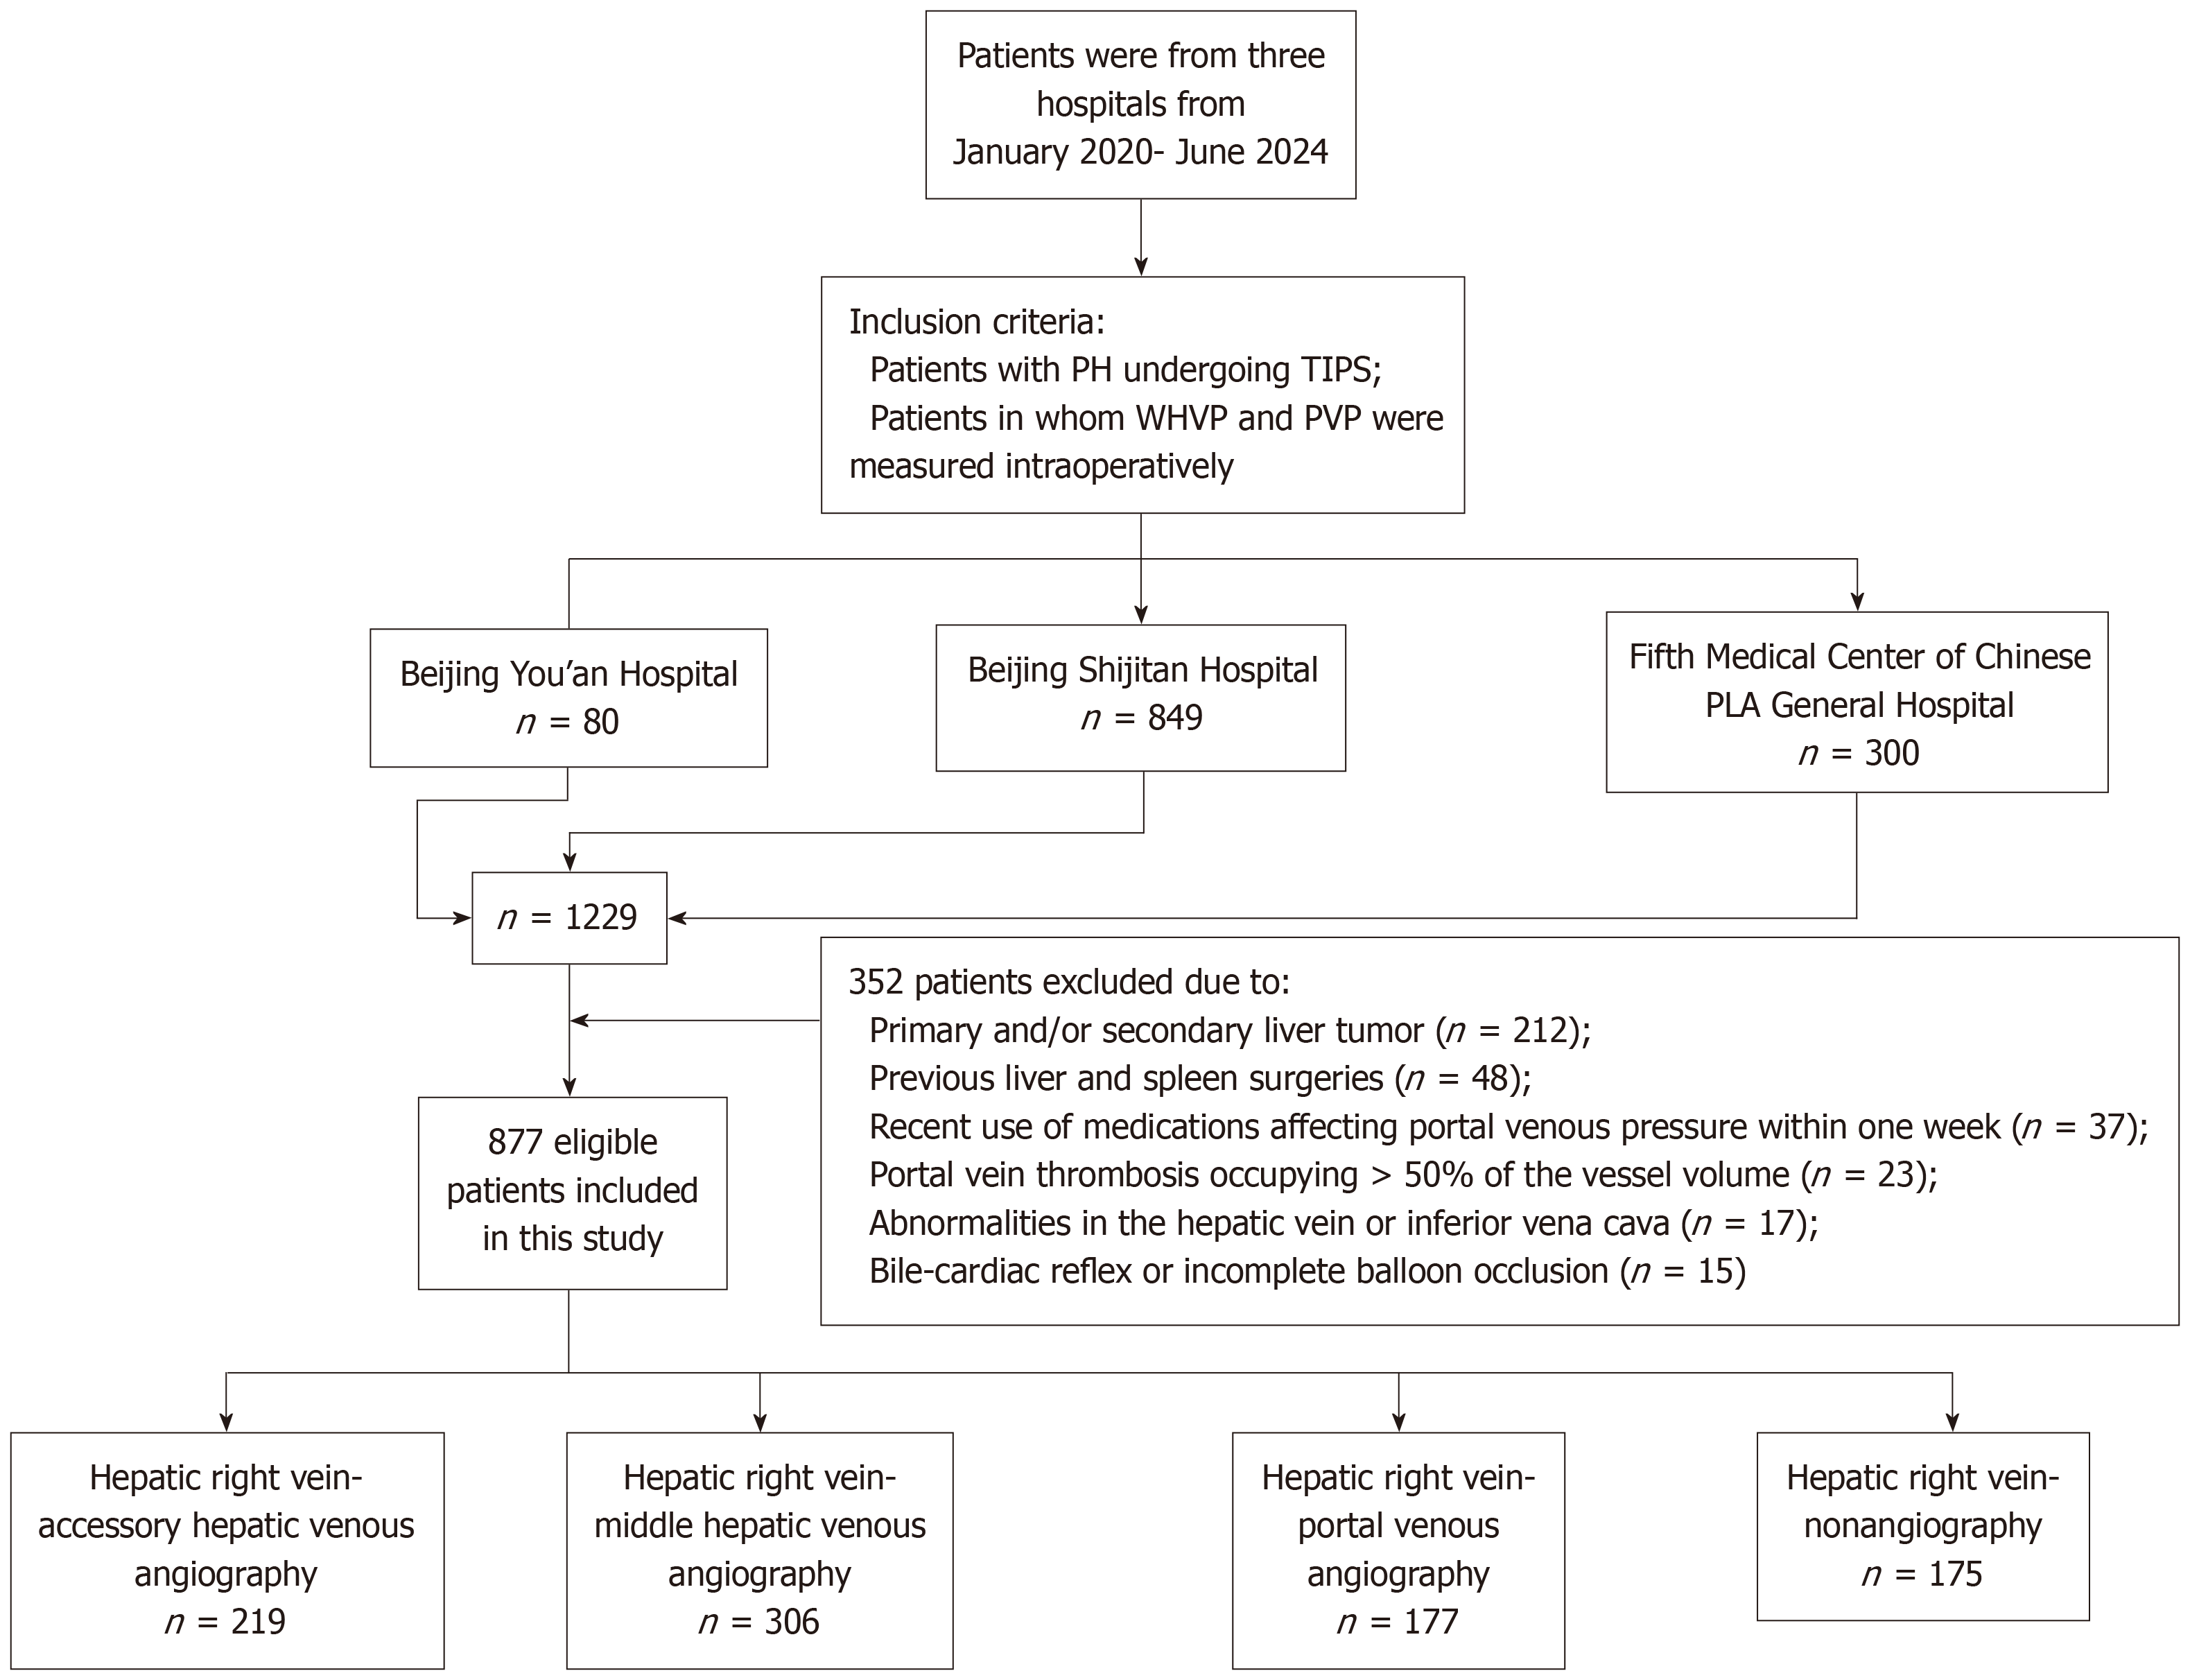
Figure 1 Flow chart of the study design.
PH: Portal hypertension; TIPS: Transjugular intrahepatic portosystemic shunt; WHVP: Wedged hepatic venous pressure; PVP: Portal venous pressure.
Figure 2 Anatomical images of balloon occlusion hepatic venography.
A: Balloon occlusion of the hepatic right vein (white short arrow) demonstrating visualization of the hepatic middle vein through a communicating branch (white long arrow); B: Balloon occlusion of the right hepatic vein (white short arrow) showing visualization of the accessory hepatic vein through a communicating branch (white long arrow); C: Balloon occlusion of the right hepatic vein (white short arrow) showing visualization of the portal vein (white long arrow); D: Balloon occlusion of the right hepatic vein (white short arrow) revealing no communicating branch or portal vein.
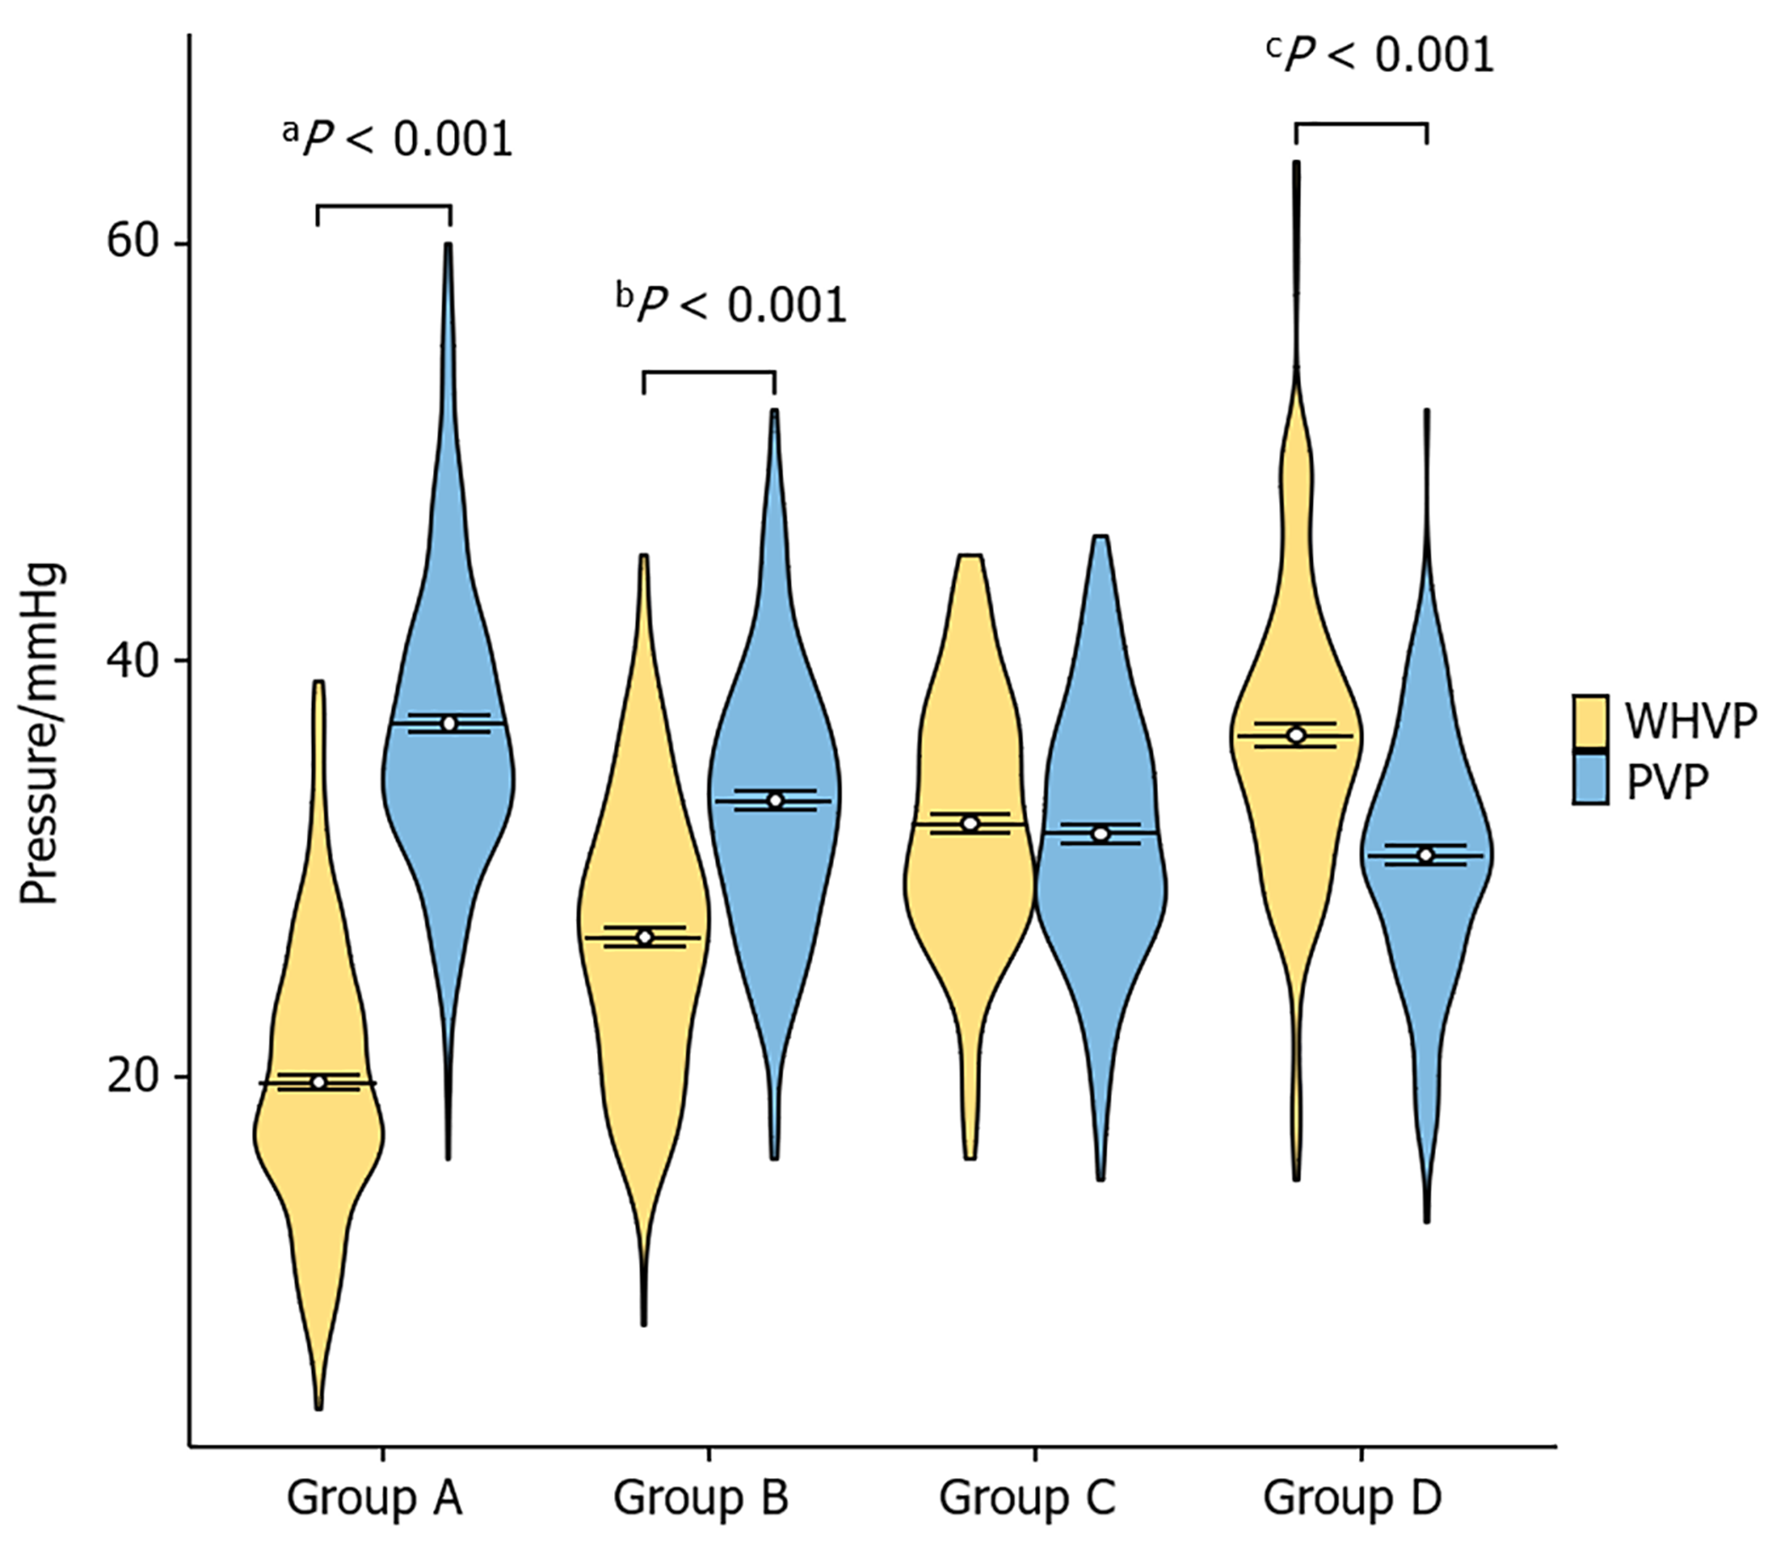
Figure 3 Comparison of wedged hepatic venous pressure and portal venous pressure in the different hepatic venous anatomic shunt groups.
The nonparametric Mann-Whitney U test was used. In group A, the portal venous pressure (PVP) was significantly greater than the wedged hepatic venous pressure (WHVP). In group B, the PVP was greater than the WHVP. In group C, the PVP and WHVP were approximately equal. In Group D, the WHVP was significantly greater than the PVP. All P values were less than 0.05. WHVP: Wedged hepatic venous pressure; PVP: Portal venous pressure.
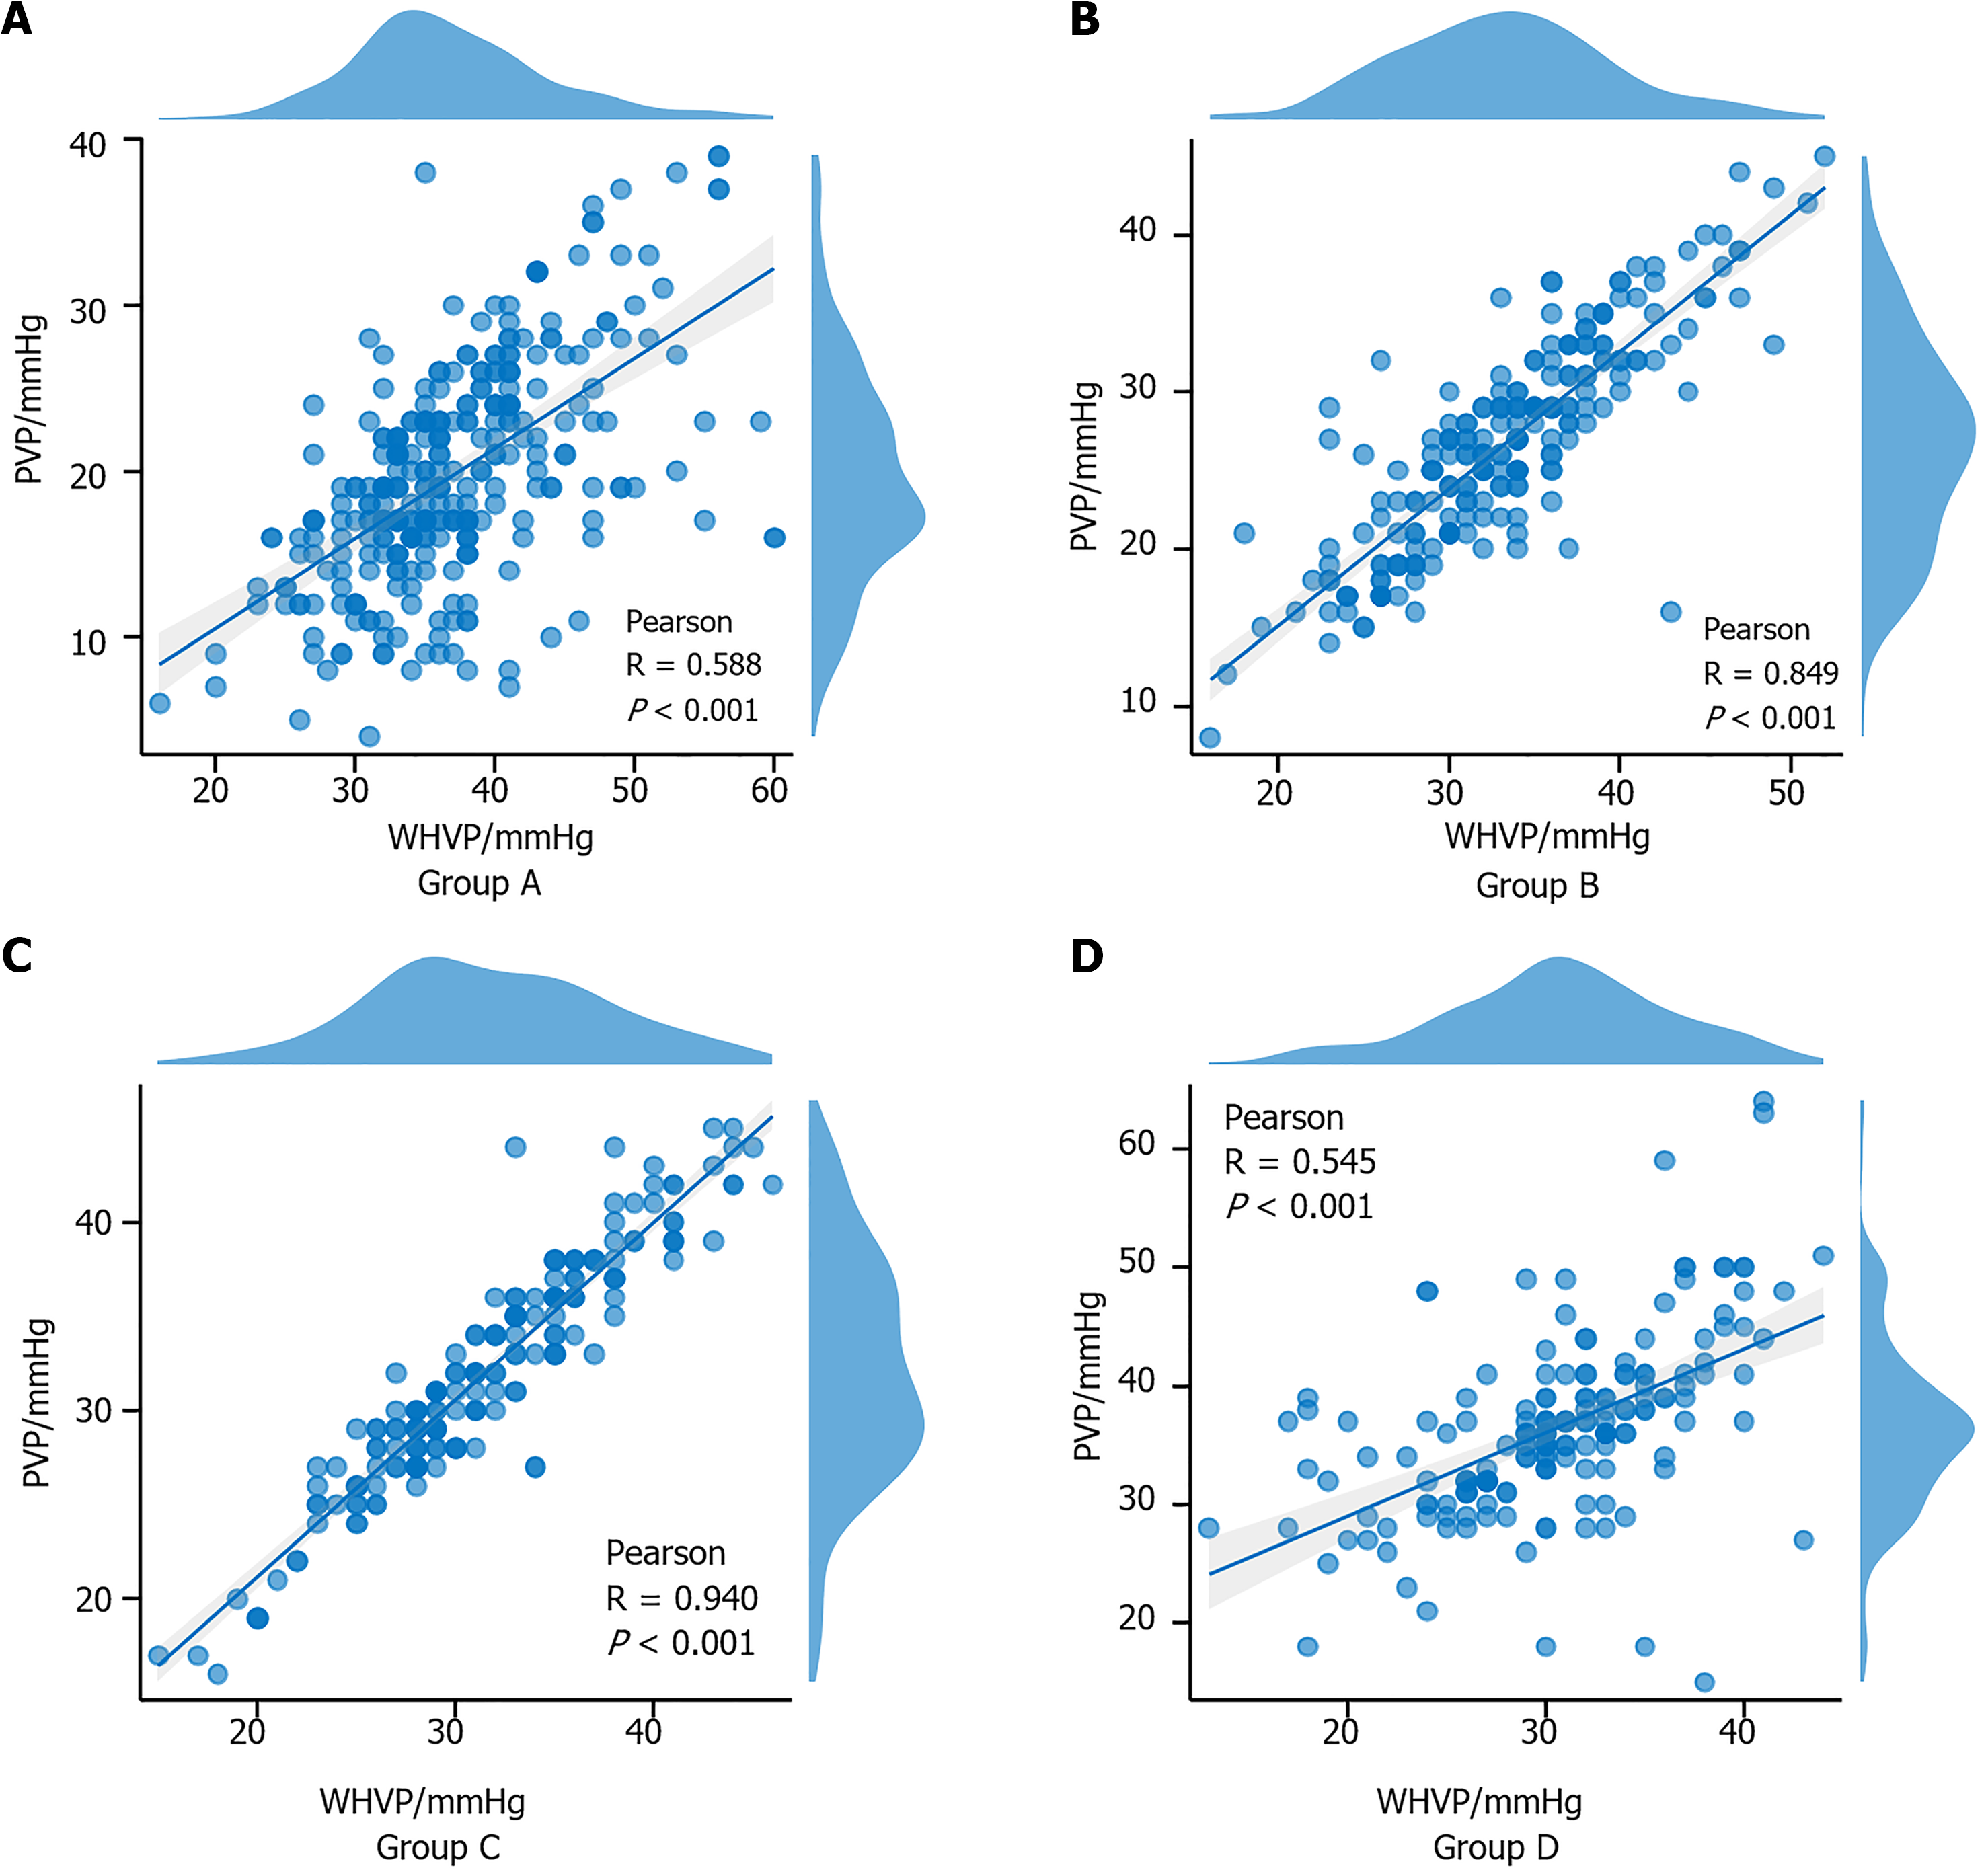
Figure 4 Correlation analysis of the wedged hepatic venous pressure and portal venous pressure in the different hepatic venous anatomic shunt groups.
Pearson's correlation test was used. A: In group A (n = 306), wedged hepatic venous pressure (WHVP) and portal venous pressure (PVP) were moderately correlated; B and C: In group B (n = 219) and group C (n = 177), WHVP and PVP exhibited strong correlations; D: In group D (n = 175), WHVP and PVP were moderately correlated. All differences were statistically significant (P < 0.05). WHVP: Wedged hepatic venous pressure; PVP: Portal venous pressure.
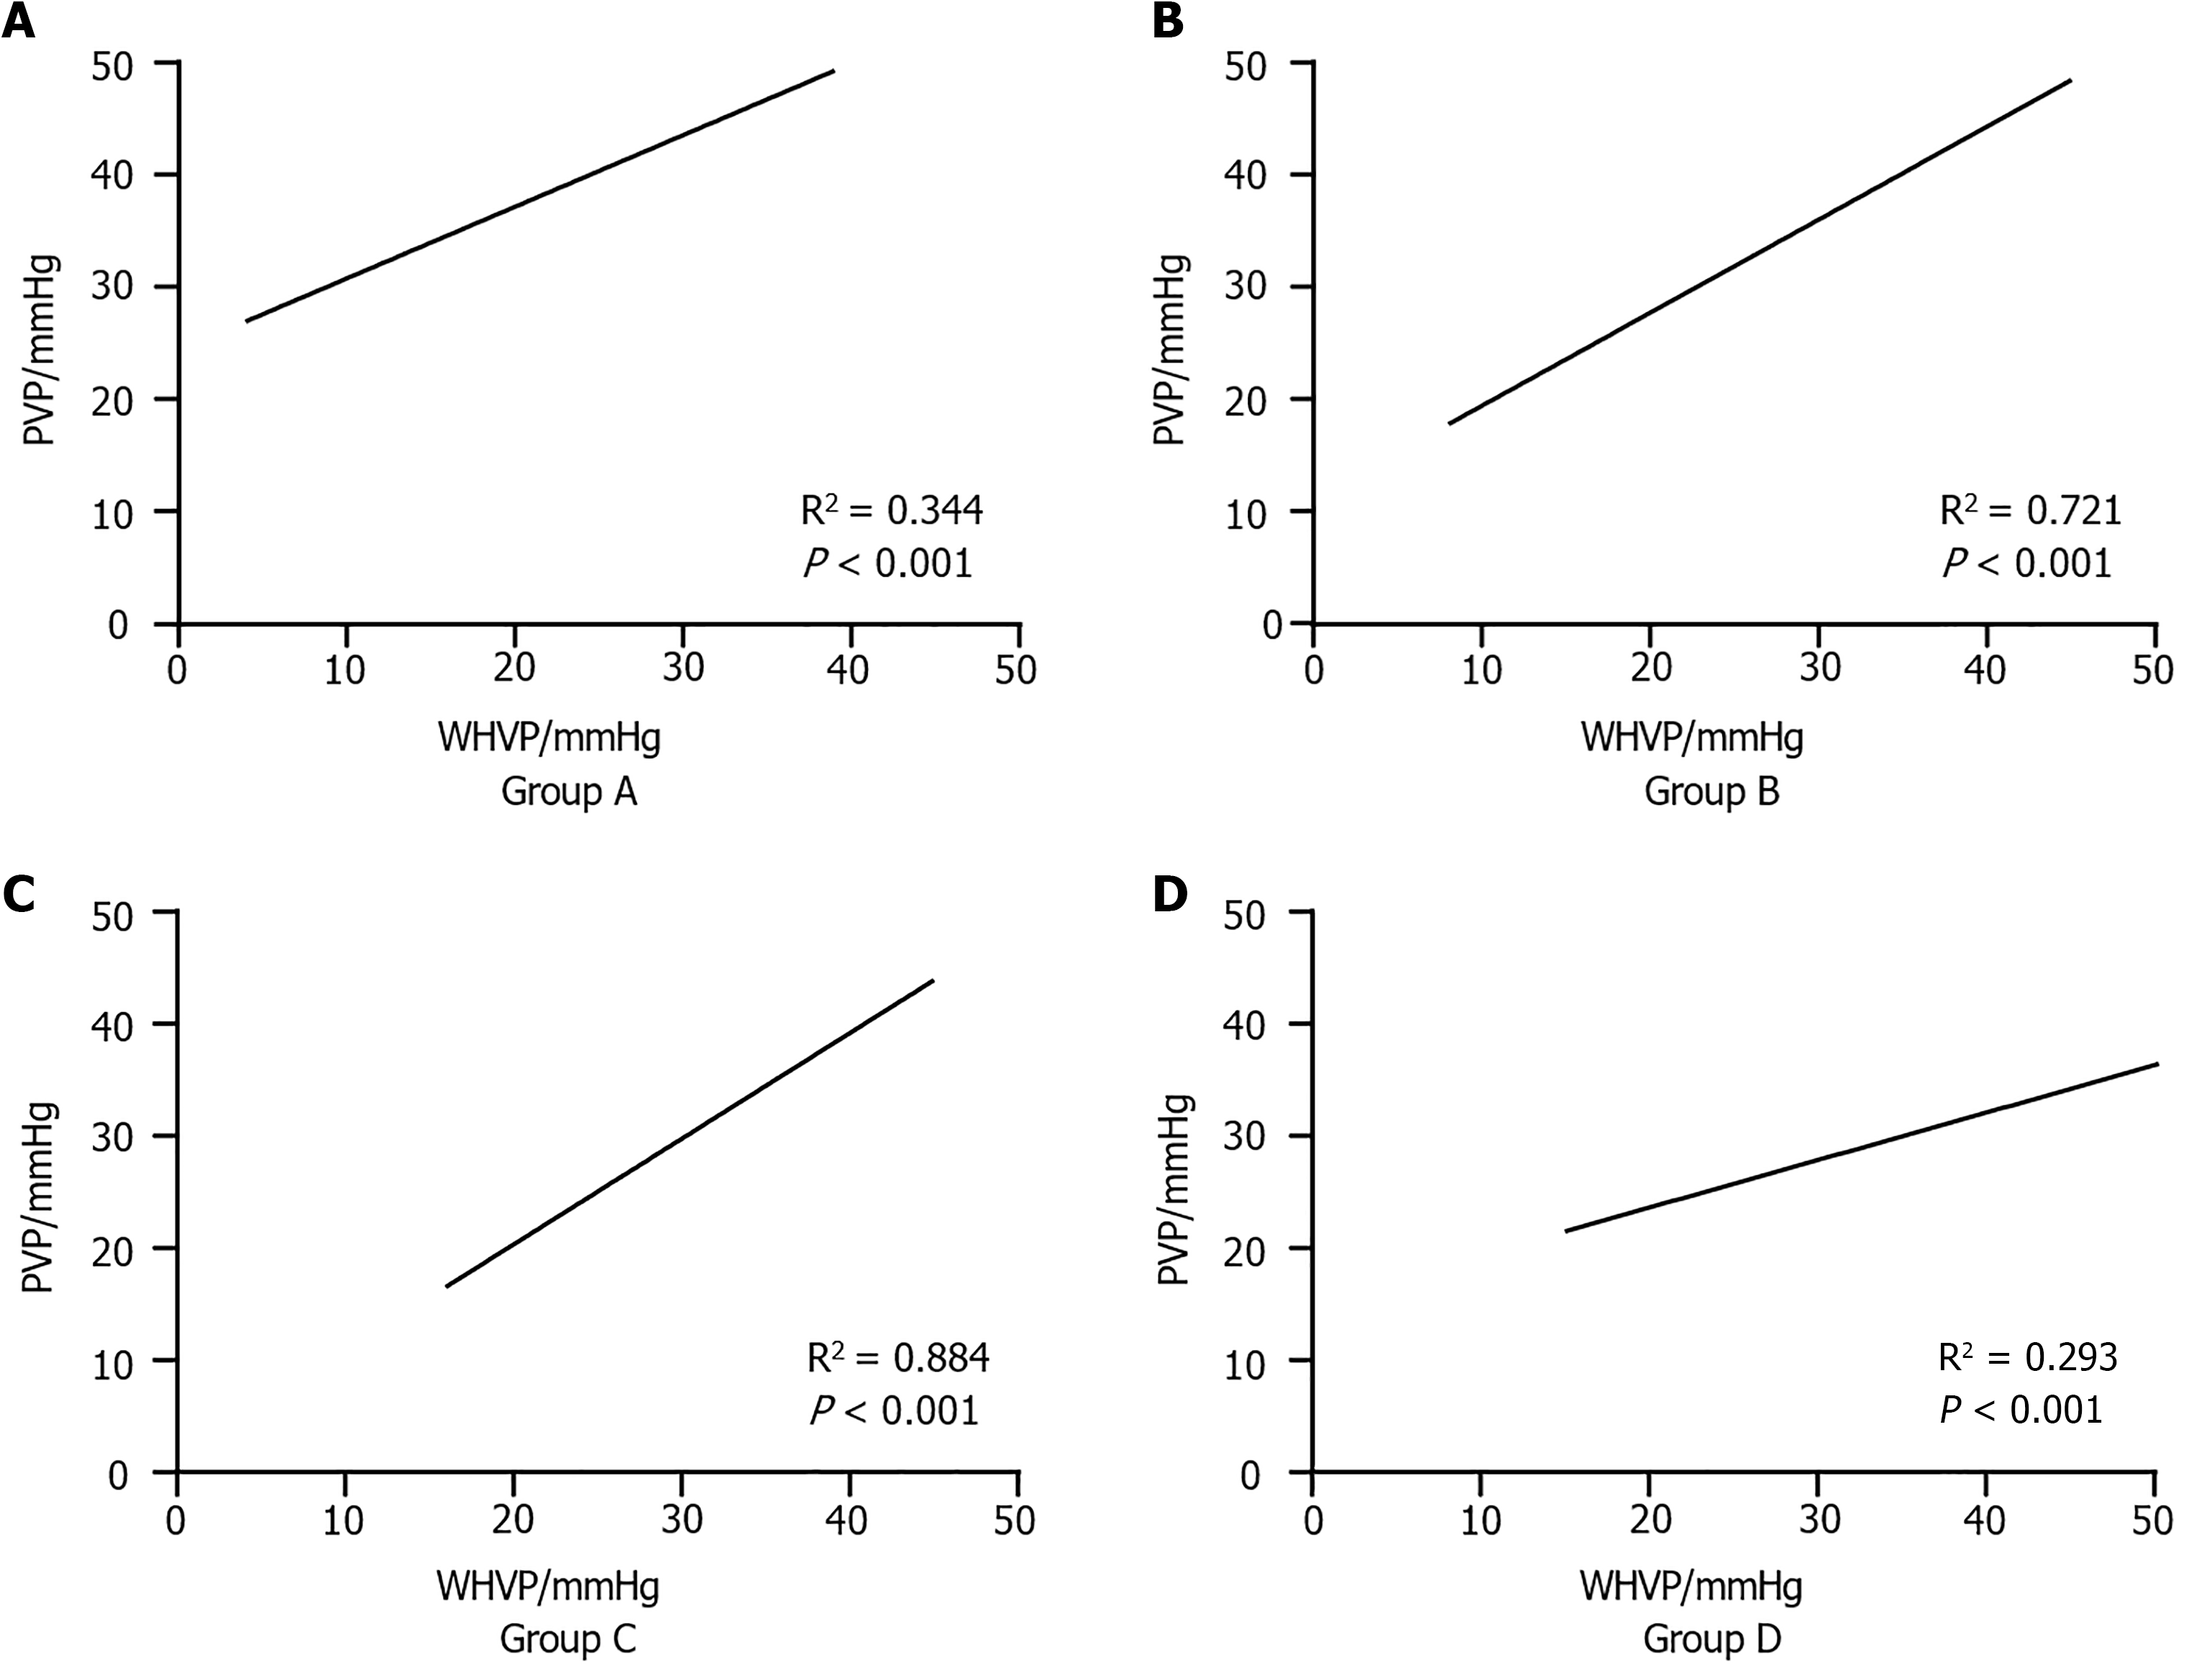
Figure 5 Regression of portal venous pressure on the wedged hepatic venous pressure in different hepatic venous anatomic shunt groups.
A: Regression analysis of group A, R2 = 0.344; B: Regression analysis of group B, R2 = 0.721; C: Regression analysis of group C, R2 = 0.884; D: Regression analysis of group D, R2 = 0.293. The results revealed a significant positive correlation (P < 0.05). WHVP: Wedged hepatic venous pressure; PVP: Portal venous pressure.
- Citation: Ye QX, Meng MM, Wu YF, Dong CB, Zhang Y, Liu BW, Lv YF, You SL, Lv S, Ding HG, Han Y, Yang YP, Zhu B, Liu FQ. Multicenter analysis on the correlation between the anatomical characteristics of hepatic veins and hepatic venous wedge pressure. World J Gastroenterol 2025; 31(9): 103068
- URL: https://www.wjgnet.com/1007-9327/full/v31/i9/103068.htm
- DOI: https://dx.doi.org/10.3748/wjg.v31.i9.103068


