Copyright
©The Author(s) 2025.
World J Gastroenterol. Mar 7, 2025; 31(9): 101383
Published online Mar 7, 2025. doi: 10.3748/wjg.v31.i9.101383
Published online Mar 7, 2025. doi: 10.3748/wjg.v31.i9.101383
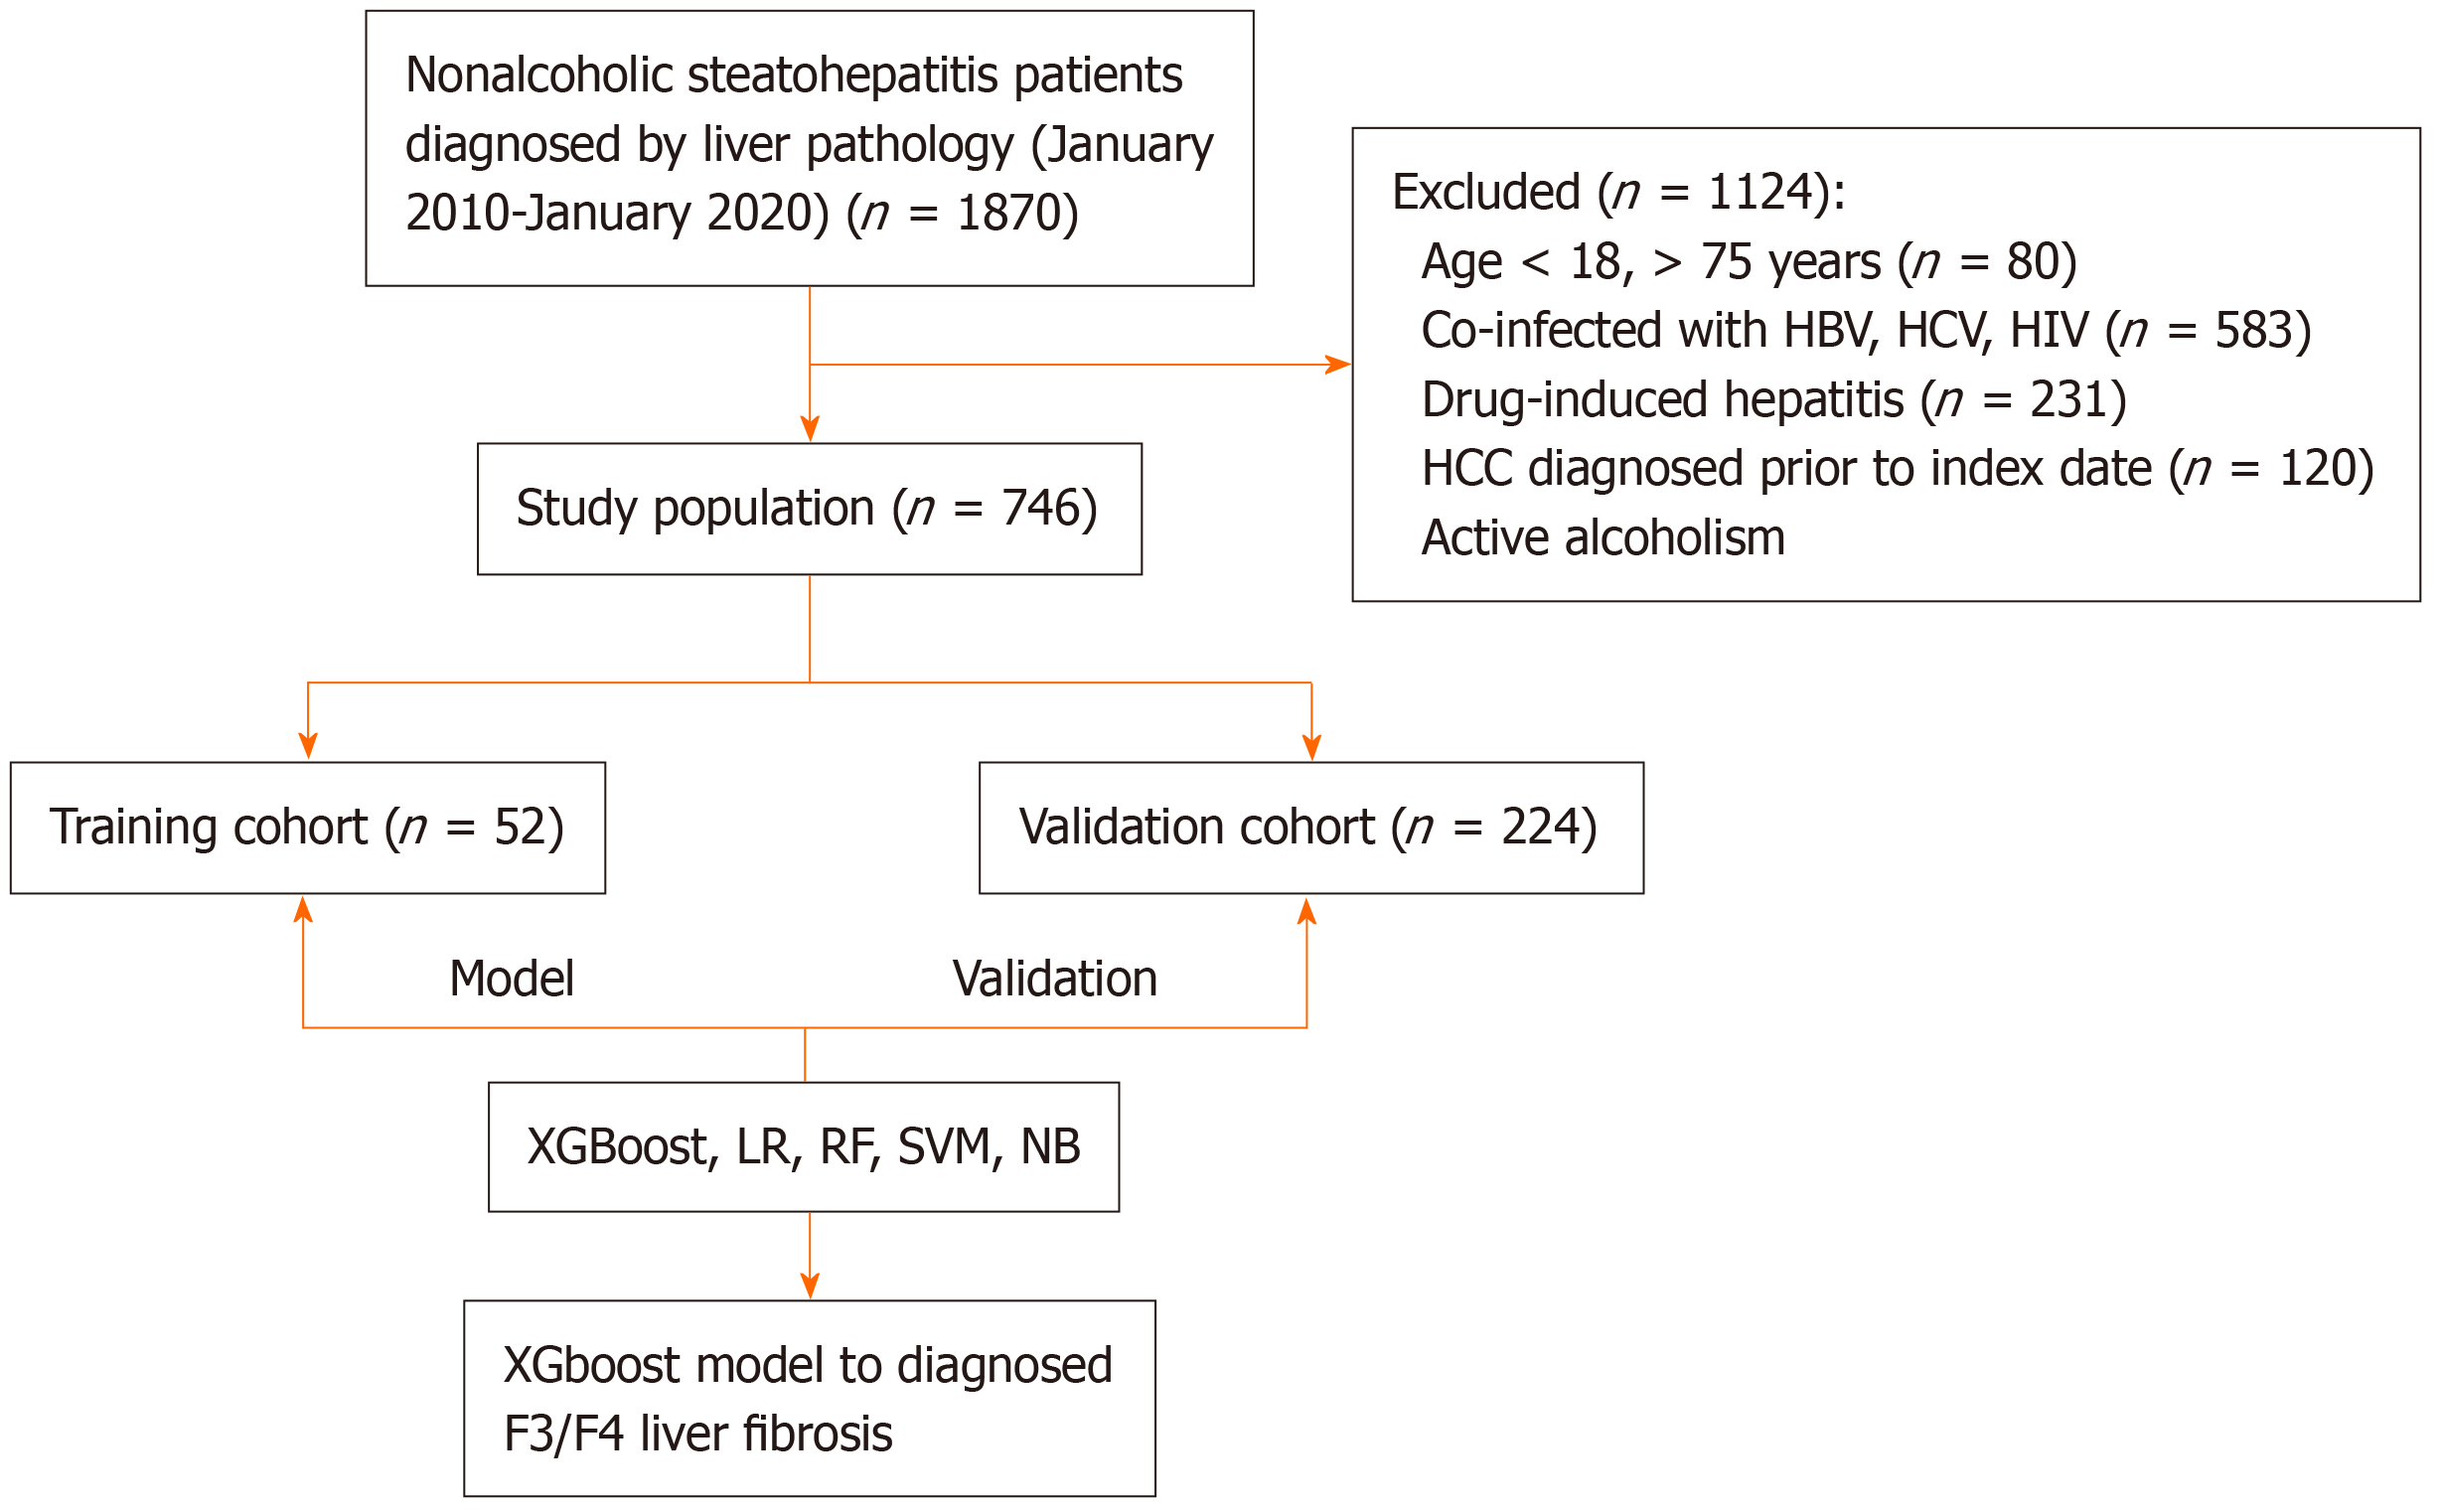
Figure 1 Outline of the recruitment and grouping of non-alcoholic steatohepatitis patitents.
HBV: Hepatitis B virus; HCV: Hepatitis C virus; HIV: Human immunodeficiency virus; HCC: Hepatocellular carcinoma; XGBoost: The Extreme Gradient Boosting; LR: Logistic regression; RF: Random forest; SVM: Support Vector Machine; NB: Naive Bayes.
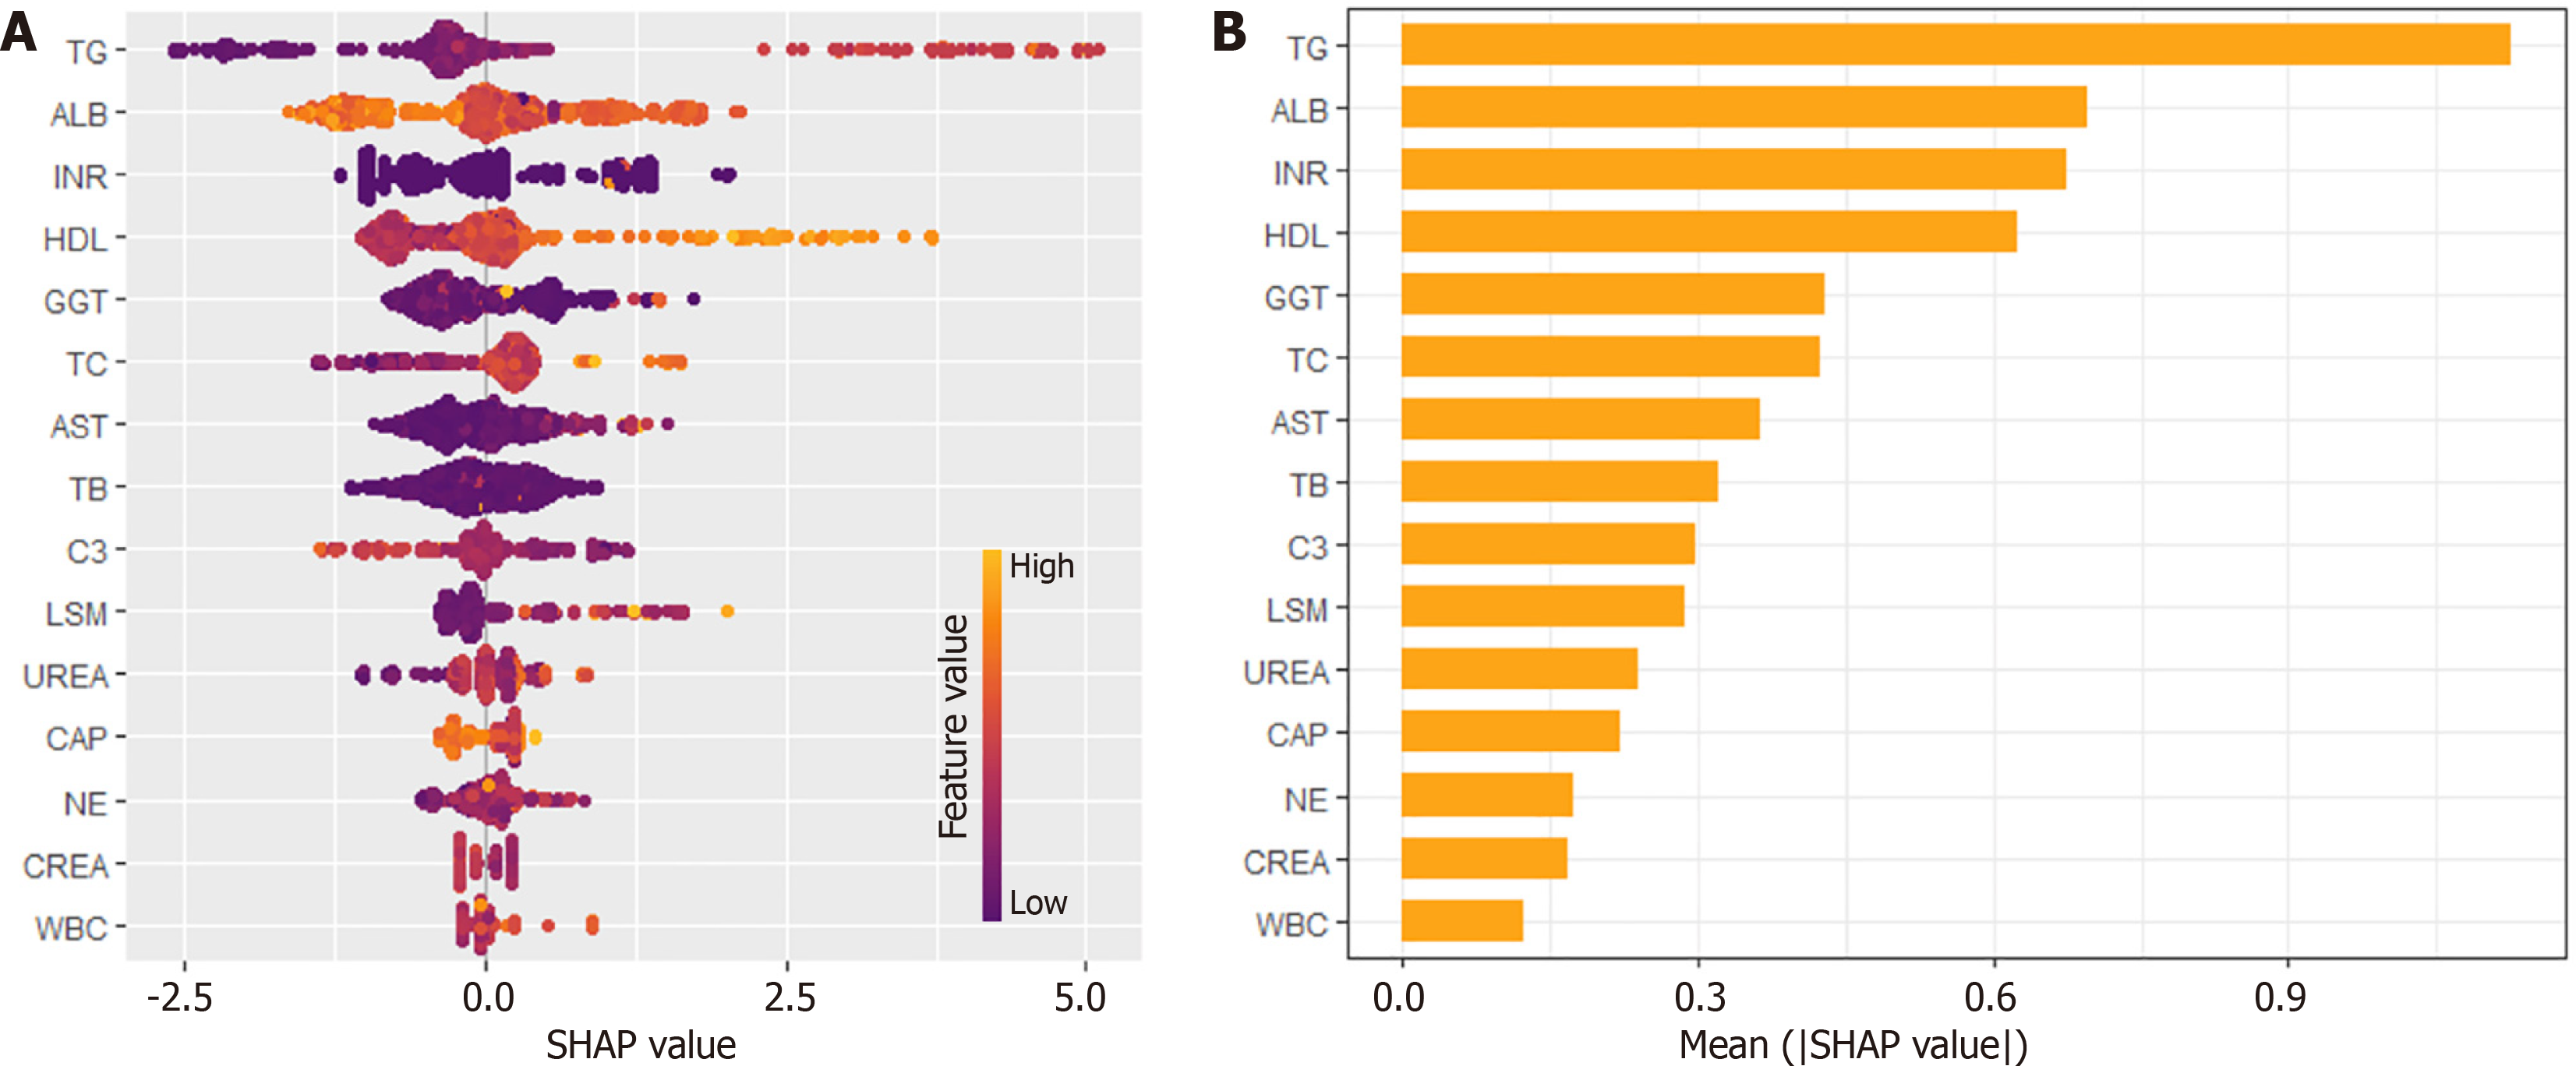
Figure 2 Shapley Additive Explanations plot: The weight of clinical features for diagnosing advanced liver fibrosis through a random forest algorithm.
A: Beeswarm plot; B: Importance bar chart. The plots showed that triglycerides, albumin, international normalized ratio and high-density lipoprotein were the top four indicators. TG: Triglycerides; ALB: Albumin; INR: International normalized ratio; HDL: High-density lipoprotein; GGT: Gamma-glutamyl transferase; AST: Alanine aminotransferase; LSM: Liver stiffness measurement; WBC: White blood cell; CAP: Controlled attenuation parameter; SHAP: Shapley Additive Explanations.
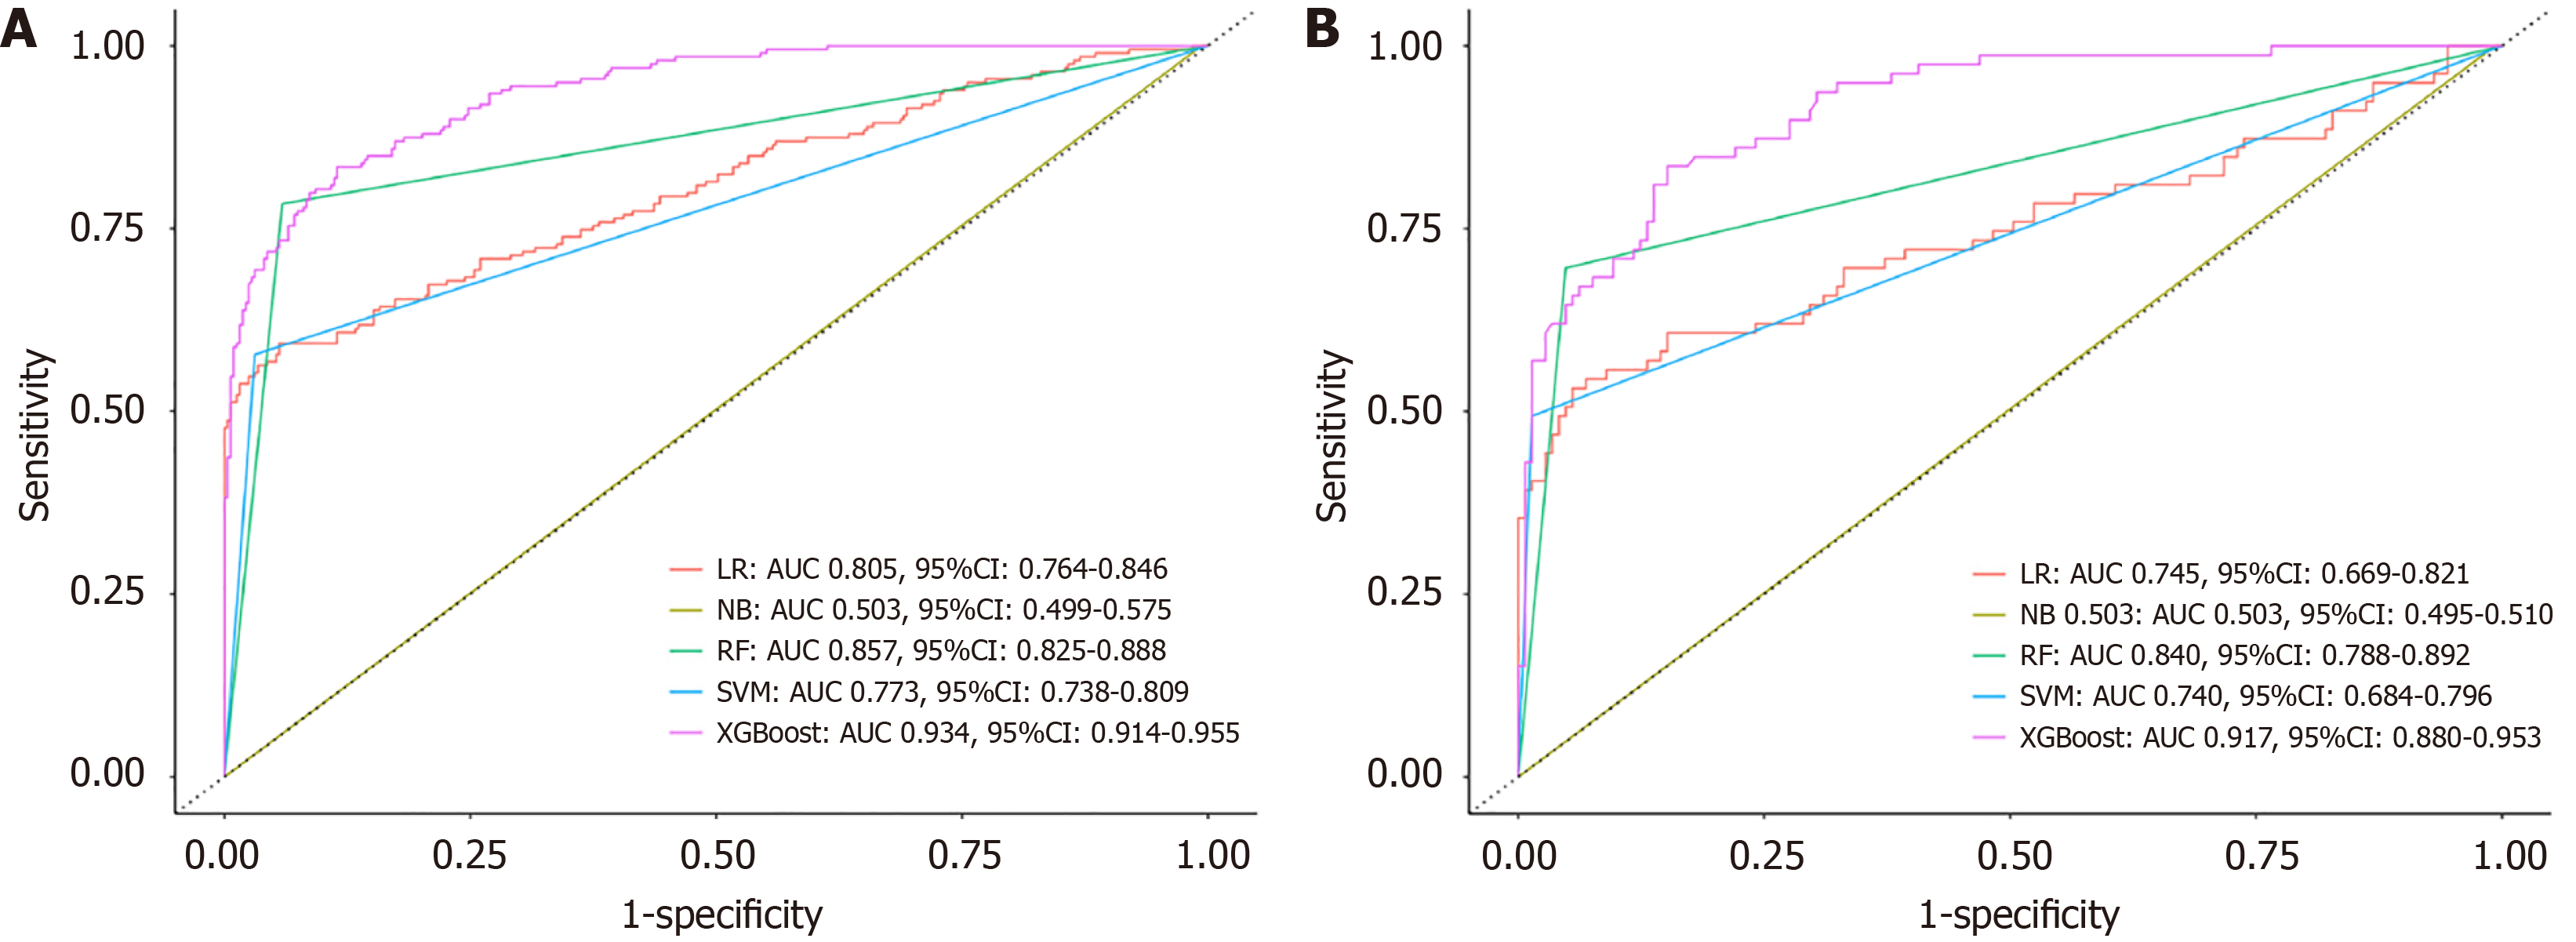
Figure 3 The receiver operating characteristic of 5 machine learning models to diagnose advanced liver fibrosis.
A: Training cohort; B: Validation cohort. The receiver operating characteristic of the Extreme Gradient Boosting model was much better than the other machine learning models. LR: Logistic regression; RF: Random forest; SVM: Support Vector Machine; XGBoost: Extreme Gradient Boosting; NB: Naive Bayes; AUC: Area under the curve.
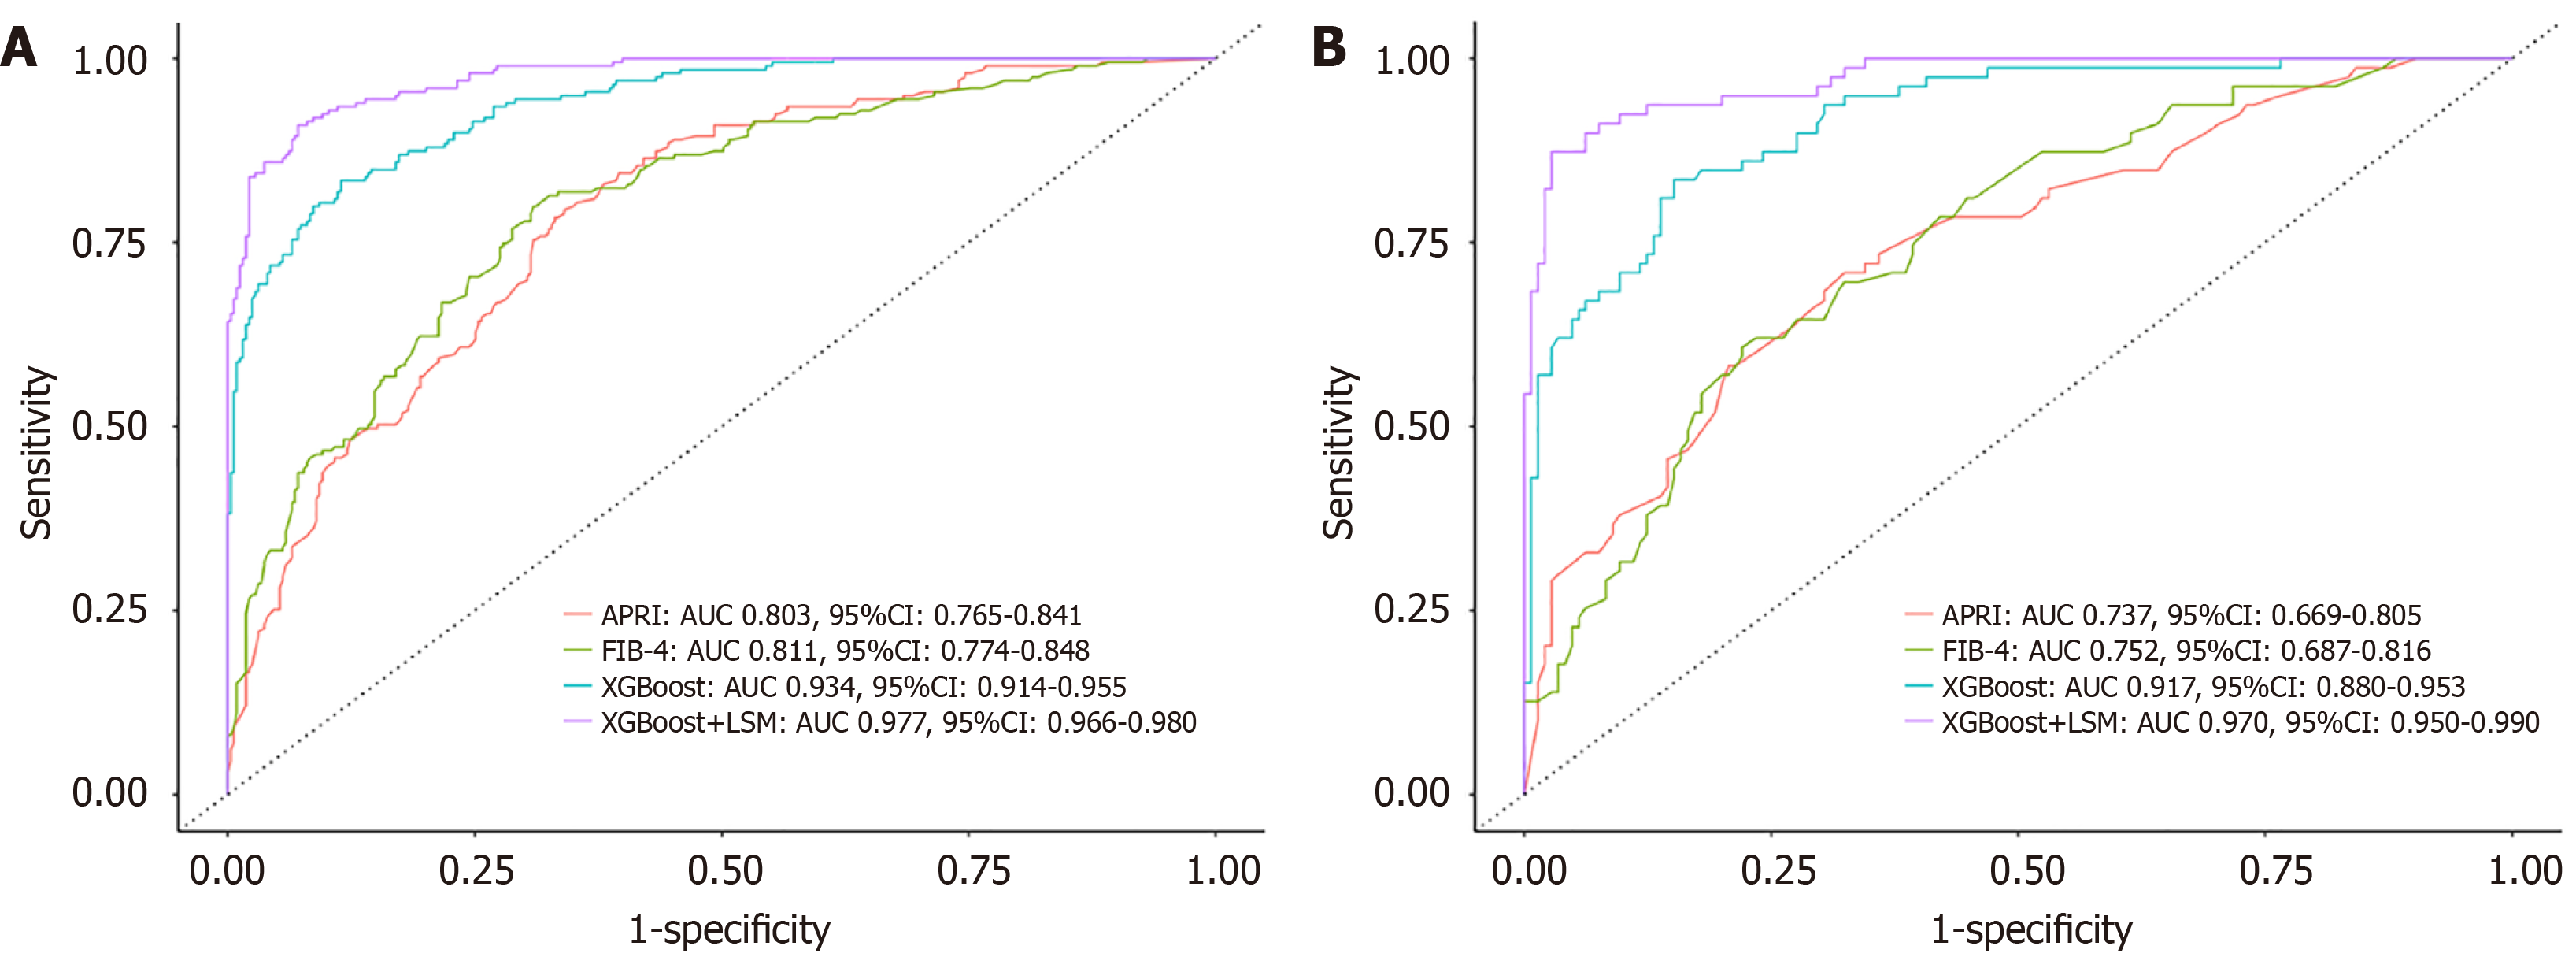
Figure 4 The receiver operating characteristic of comparing Extreme Gradient Boosting models with another non-invasive diagnosis model.
A: Training cohort; B Validation cohort. The receiver operating characteristic of the Extreme Gradient Boosting (XGBoost) model and XGBoost + liver stiffness measure model were much better than aspartate aminotransferase to platelet ratio index scores and Fibrosis-4 scores. APRI: Aspartate aminotransferase to platelet ratio index score; FIB-4: Fibrosis index based on the 4 factors; LSM: Liver stiffness measure; AUC: Area under the curve; XGBoost: Extreme Gradient Boosting.
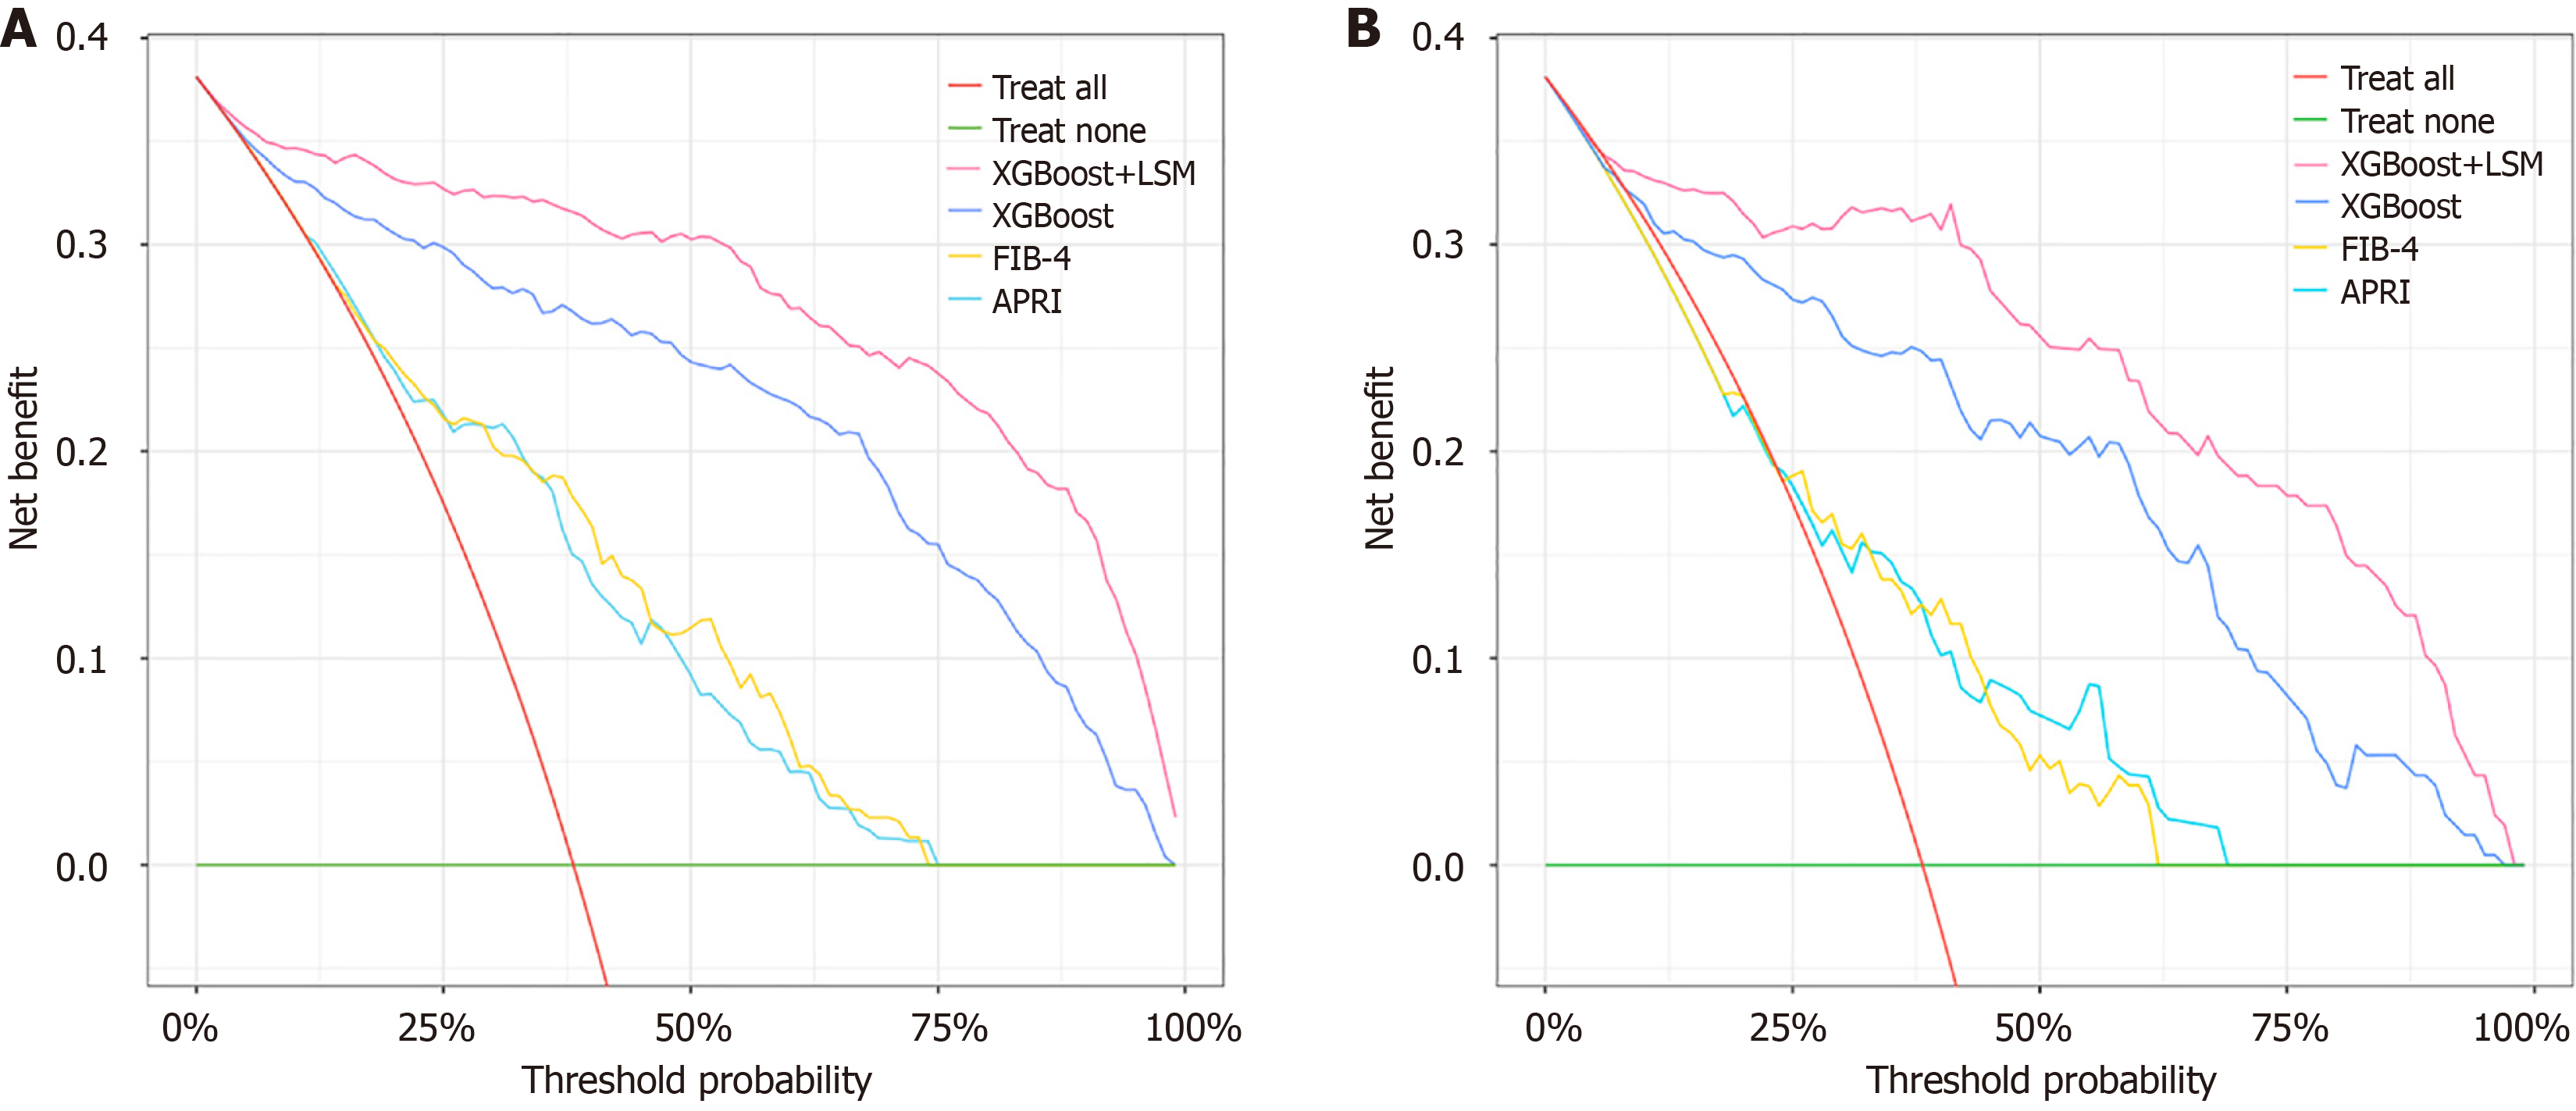
Figure 5 The decision curve analysis of the Extreme Gradient Boosting model, Extreme Gradient Boosting + liver stiffness measurement model, aspartate aminotransferase to platelet ratio index score and Fibrosis index based on the 4 factors score.
A: Training cohort; B: Validation cohort. The Extreme Gradient Boosting models showed better net benefits than the aspartate aminotransferase to platelet ratio index score and Fibrosis index based on the 4 factors score. DCA: Decision curve analysis; APRI: Aspartate aminotransferase to platelet ratio index; FIB-4: Fibrosis index based on the 4 factors; LSM: Liver stiffness measurement; XGBoost: Extreme Gradient Boosting.
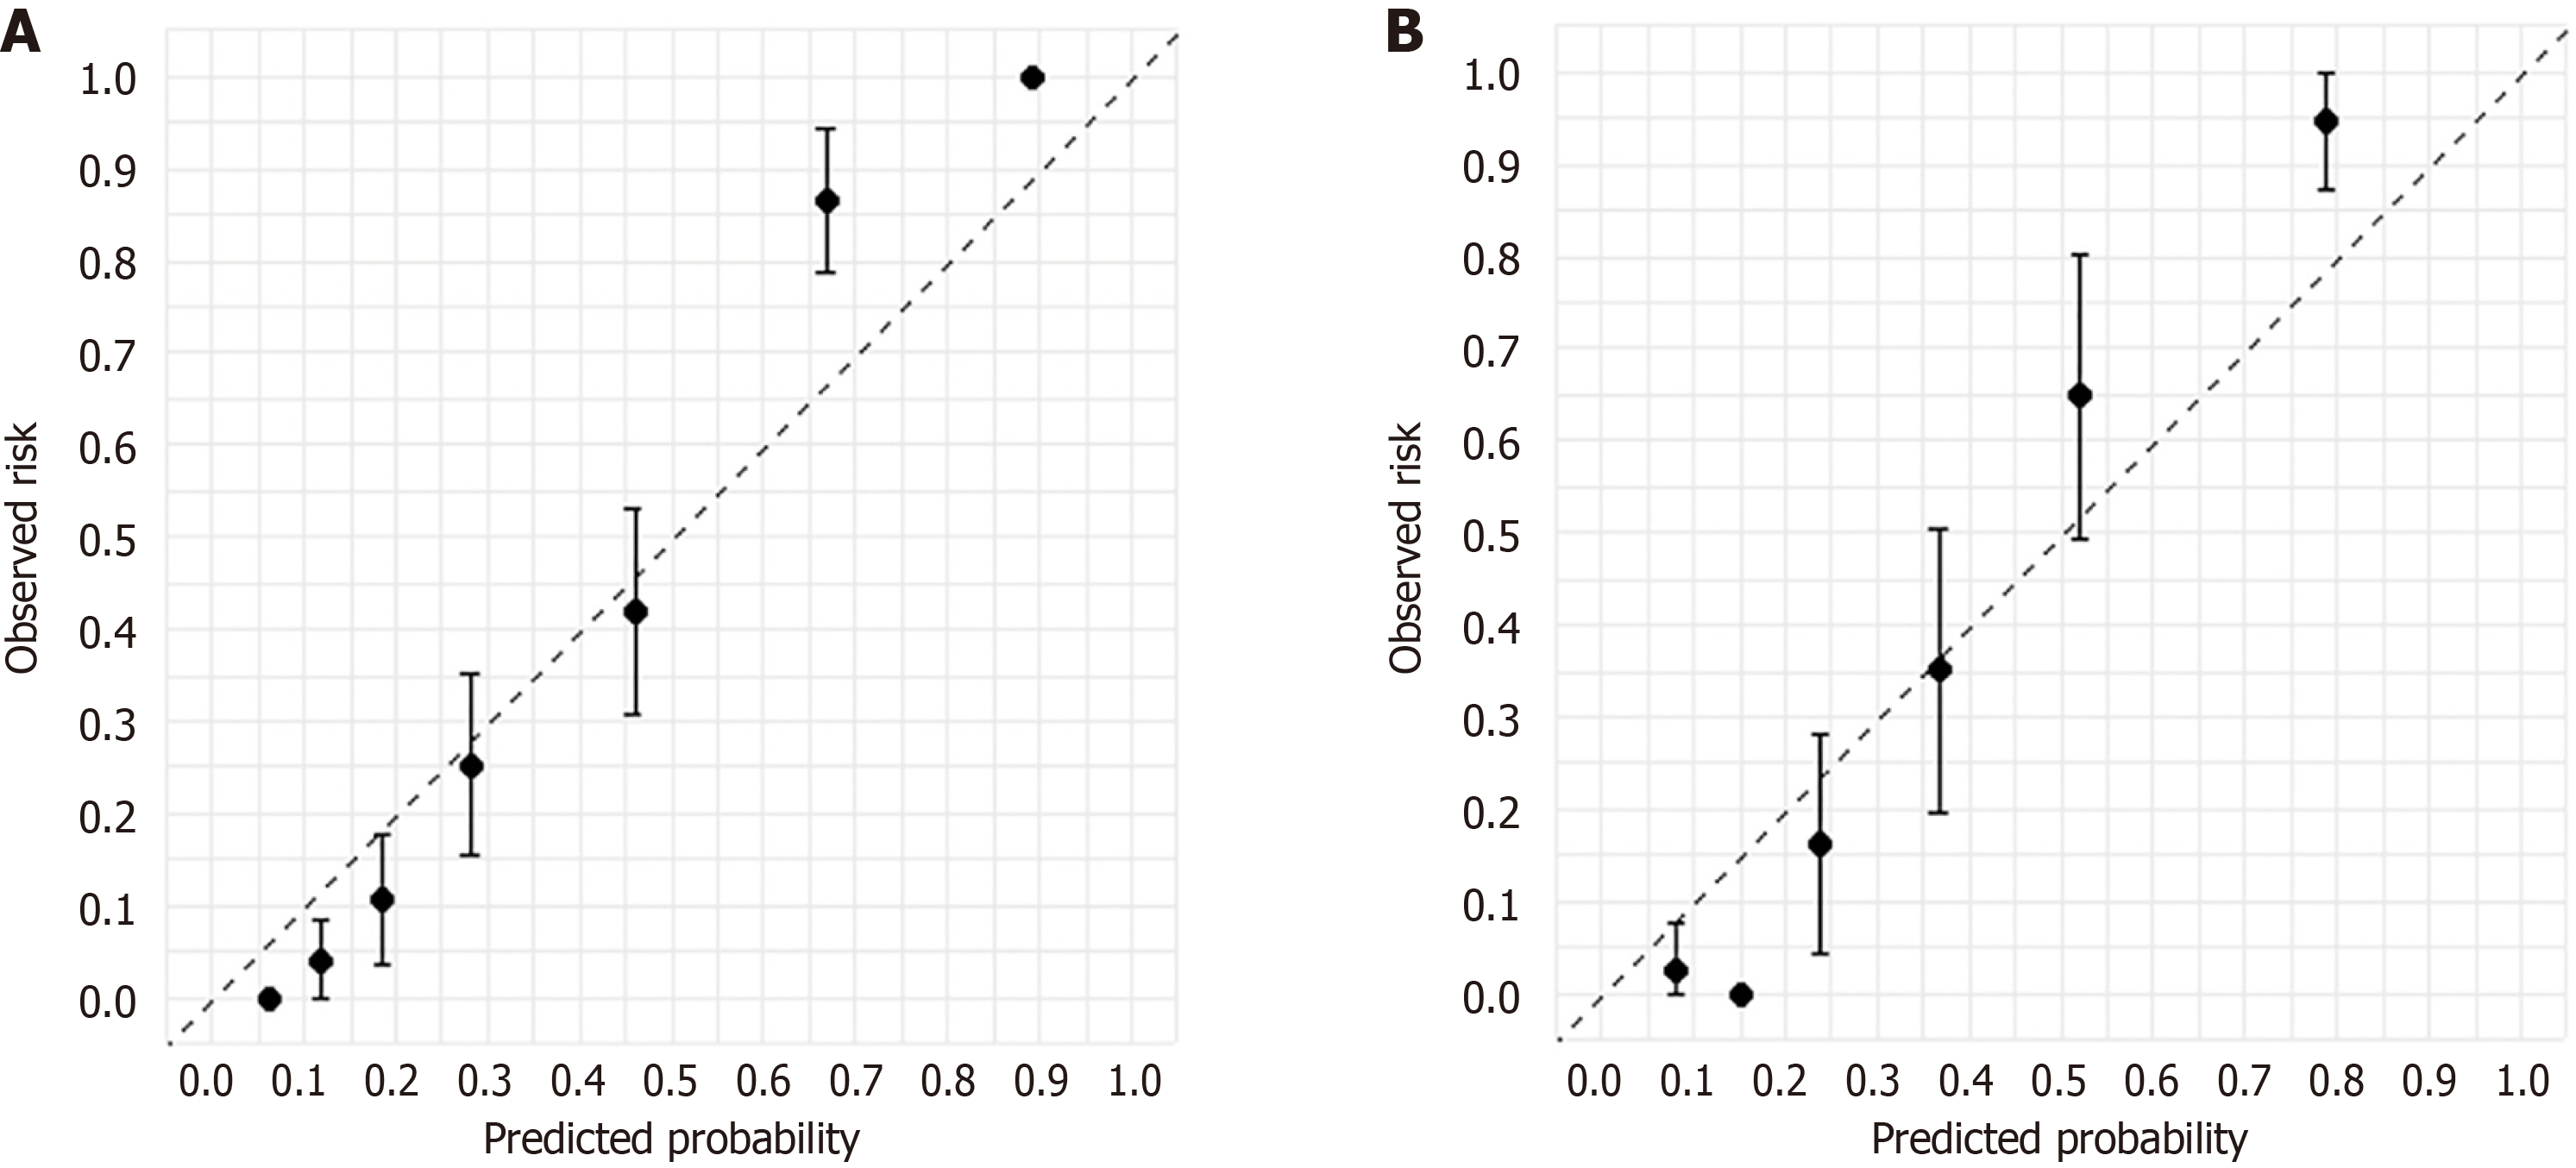
Figure 6 The cumulative curve of the Extreme Gradient Boosting model for diagnosing advanced liver fibrosis.
A: Training cohort; B: Validation cohort. The calibration curve shows good consistency between the predicted probabilities and the actual probabilities in both the training and validation sets.
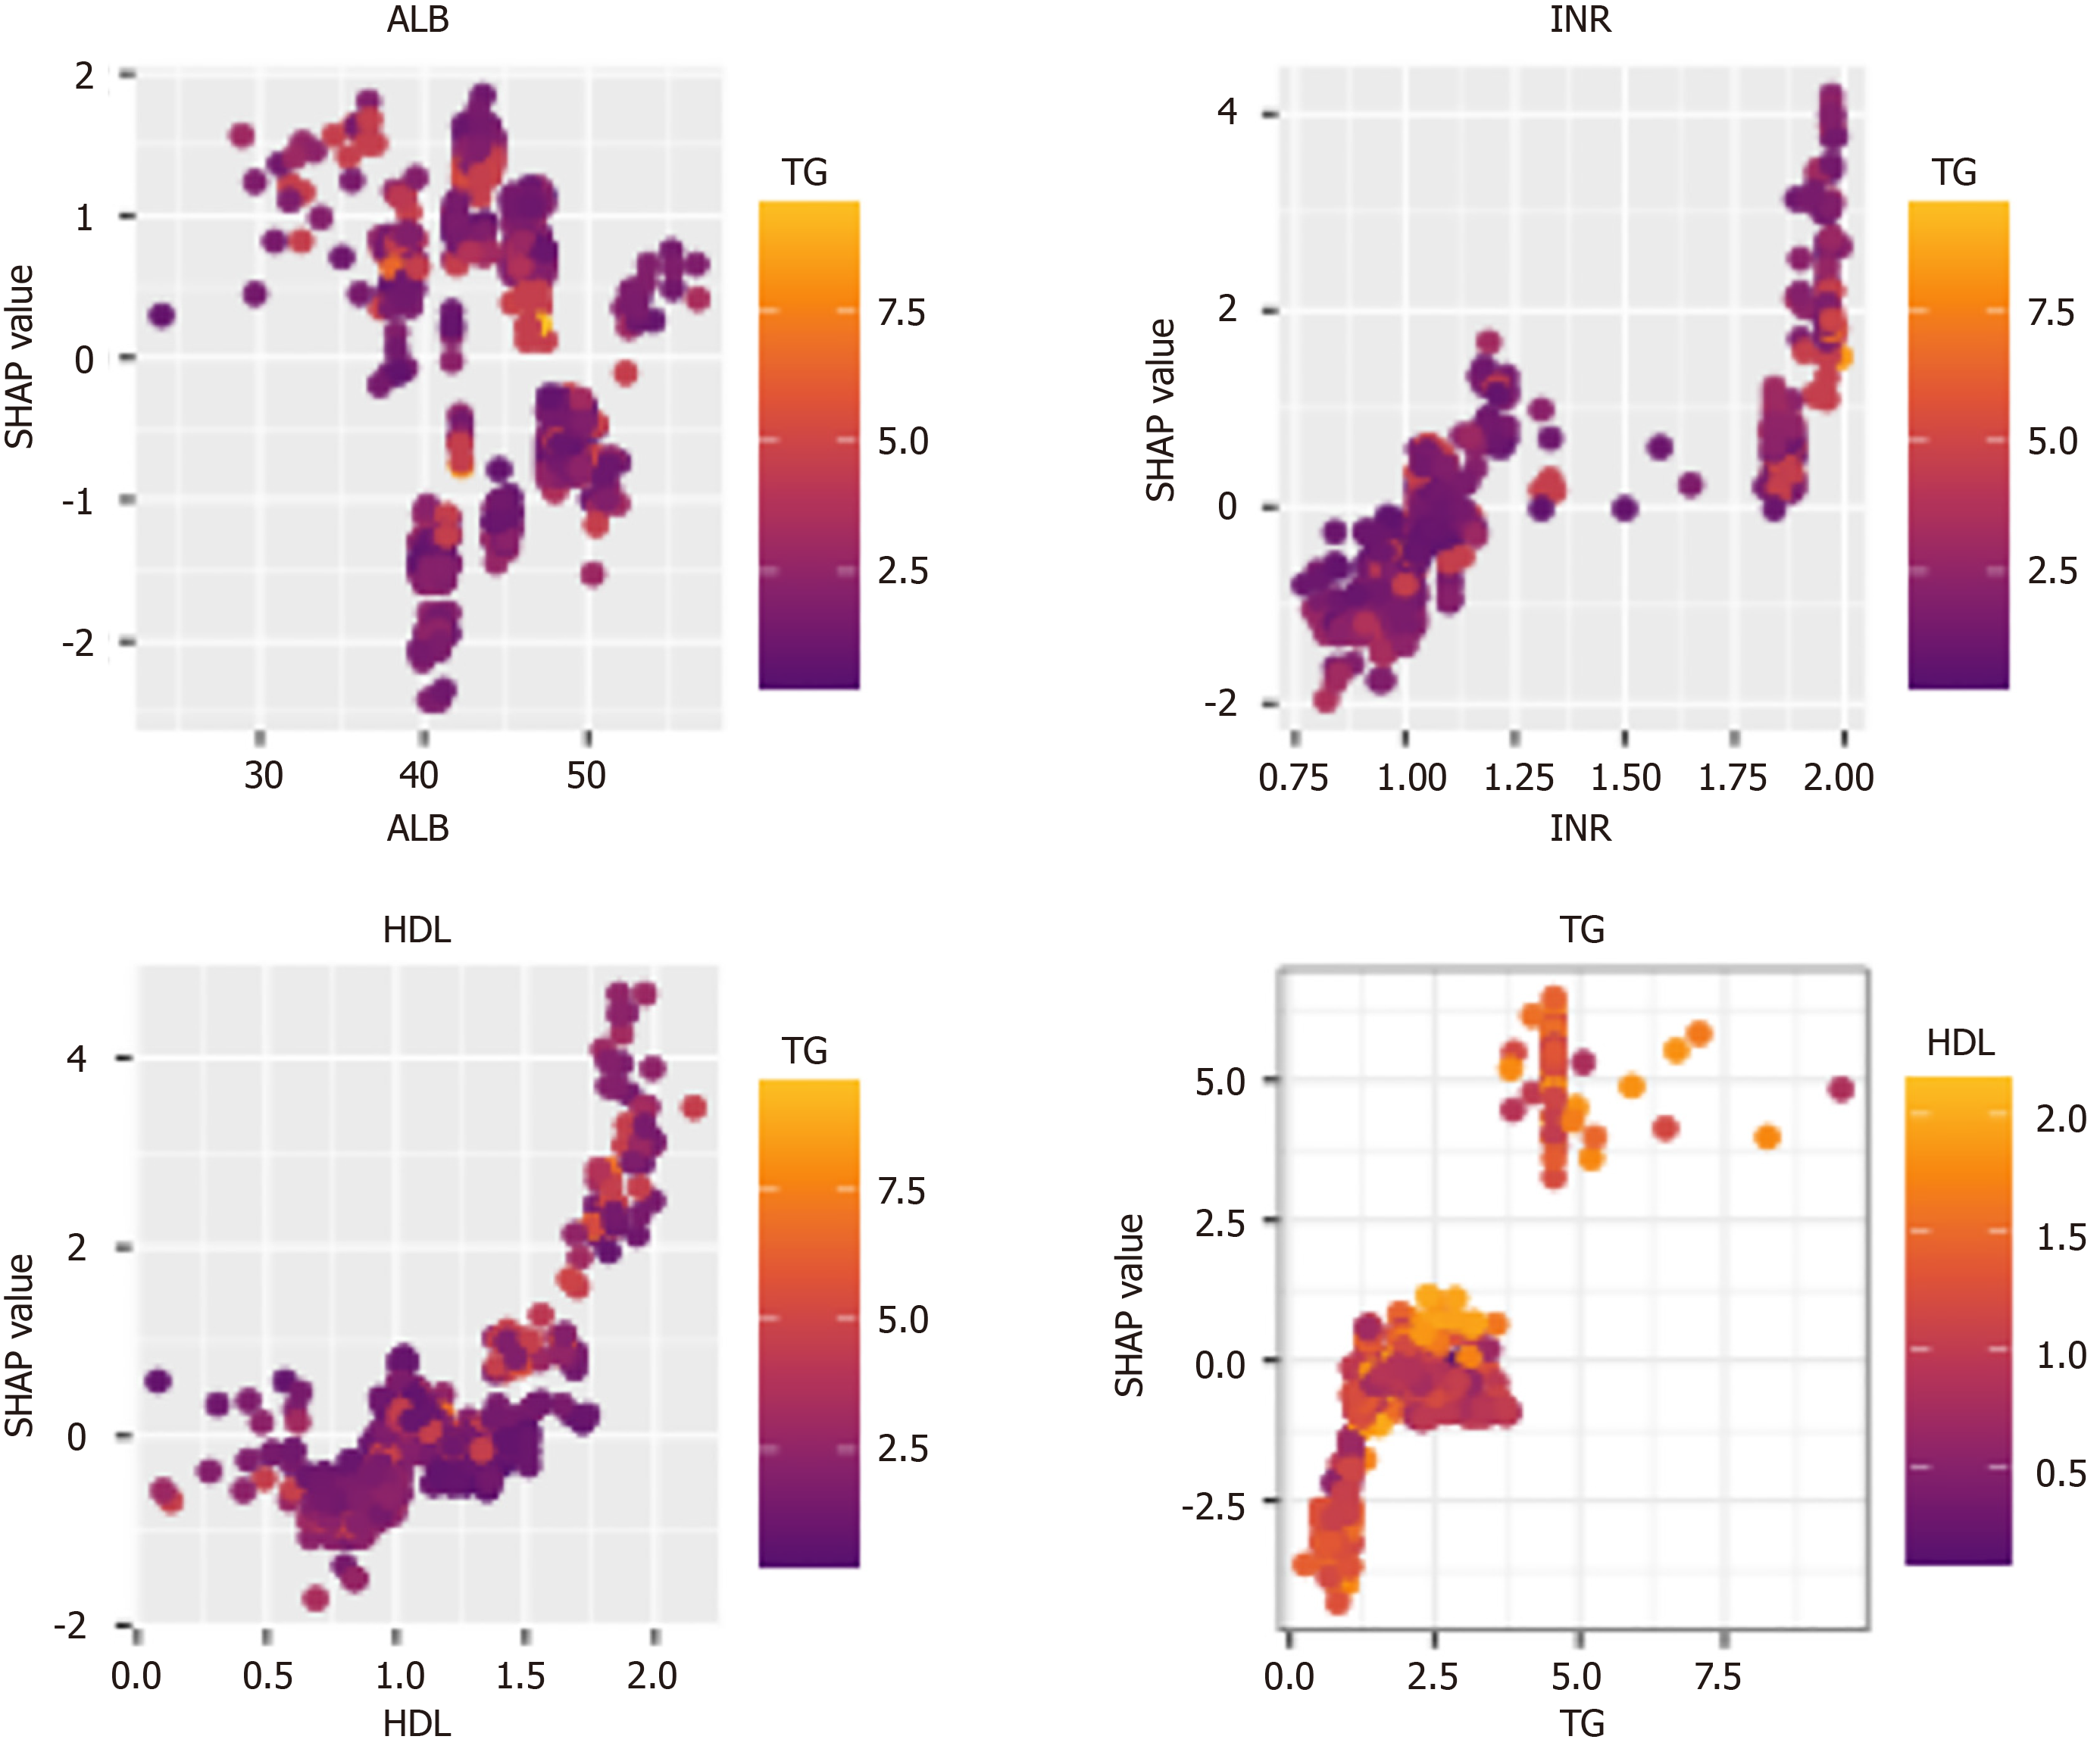
Figure 7 The Shapley Additive Explanations value in four indicators.
When albumin is below 35 g/L, international normalized ratio is in the 1.75-2.00 range, high-density lipoprotein is in the 1.5-2.0 mmol/L range, and triglycerides is above 5.0 mmol/L, the Shapley Additive Explanations values tend to be higher. SHAP: Shapley Additive Explanations; ALB: Albumin; TG: Triglycerides; INR: International normalized ratio; HDL: High-density lipoprotein.
- Citation: Xiong FX, Sun L, Zhang XJ, Chen JL, Zhou Y, Ji XM, Meng PP, Wu T, Wang XB, Hou YX. Machine learning-based models for advanced fibrosis in non-alcoholic steatohepatitis patients: A cohort study. World J Gastroenterol 2025; 31(9): 101383
- URL: https://www.wjgnet.com/1007-9327/full/v31/i9/101383.htm
- DOI: https://dx.doi.org/10.3748/wjg.v31.i9.101383


