Copyright
©The Author(s) 2025.
World J Gastroenterol. Feb 28, 2025; 31(8): 102071
Published online Feb 28, 2025. doi: 10.3748/wjg.v31.i8.102071
Published online Feb 28, 2025. doi: 10.3748/wjg.v31.i8.102071
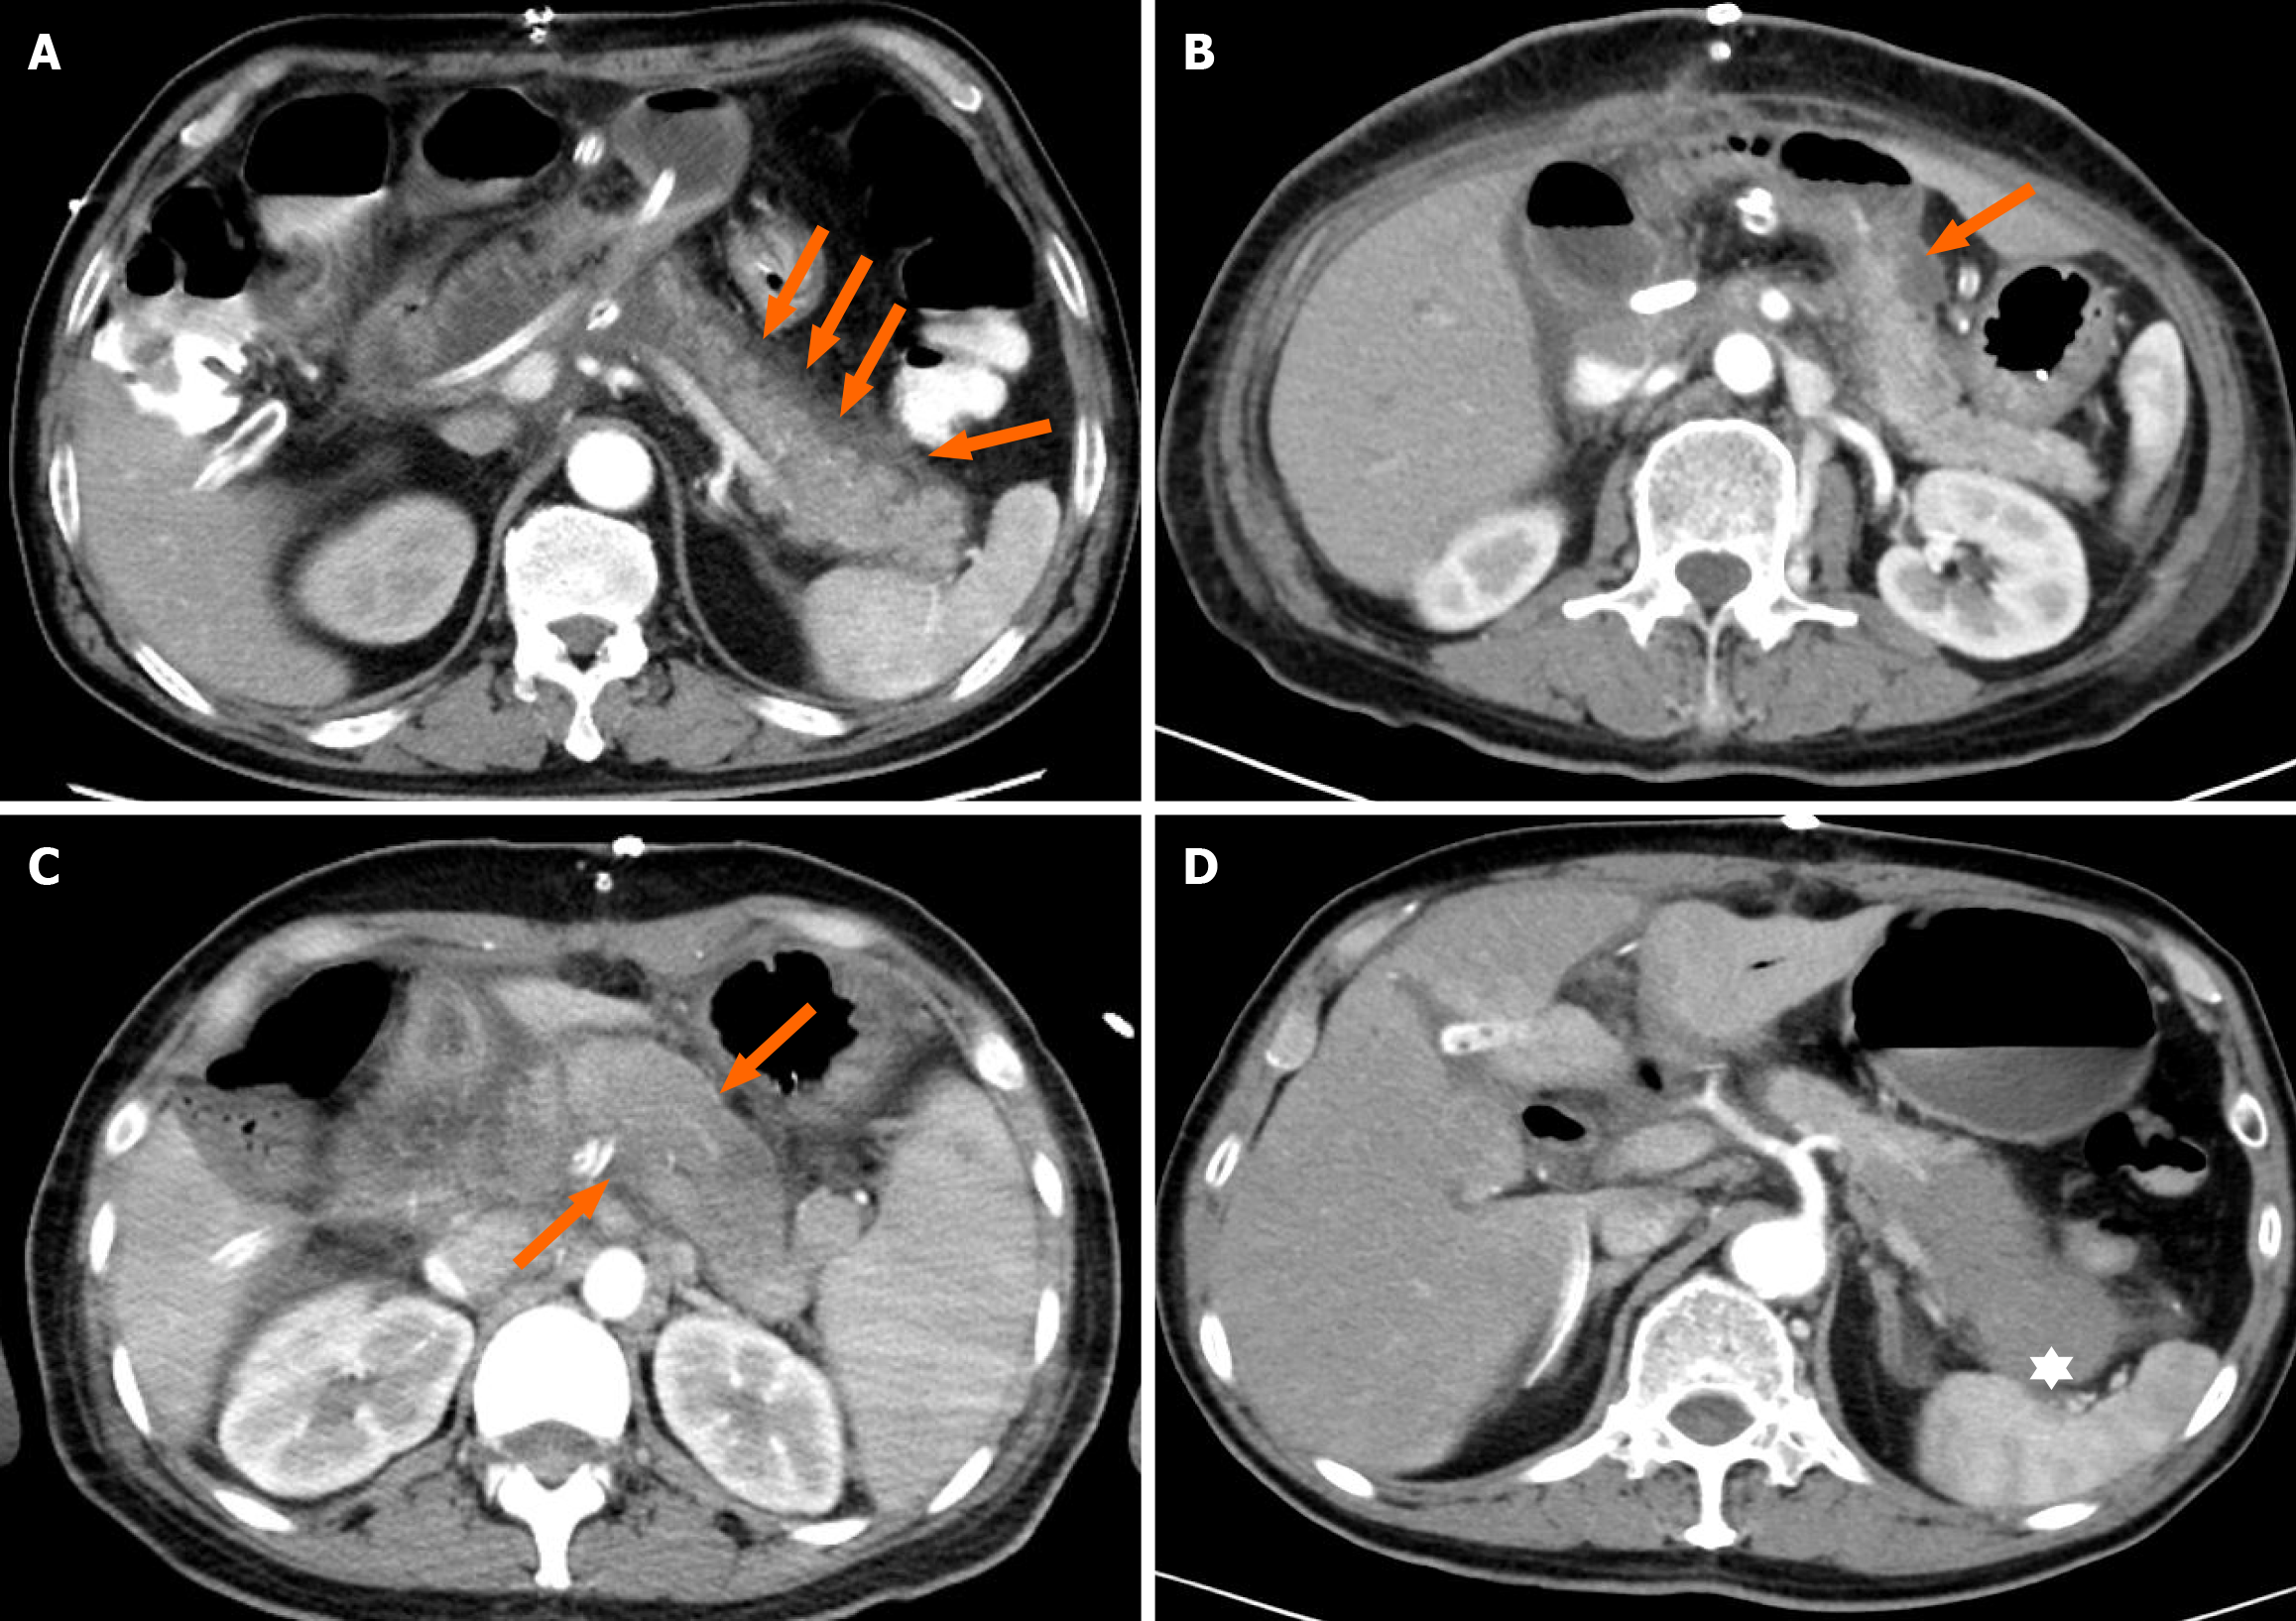
Figure 1 Several typical computed tomography changes of postpancreatectomy acute pancreatitis.
A: Peripancreatic fluid extravasation: Indicated by arrows as exudation belt; B: Residual peripancreatic fluid collection: Indicated by arrows as low-density fluid accumulation; C: Edema: Noticeable increase in the diameter of the pancreatic body and tail compared to preoperative dimensions; D: Necrotizing pancreatitis: Low-density shadow near the splenic hilum in the pancreatic tail.
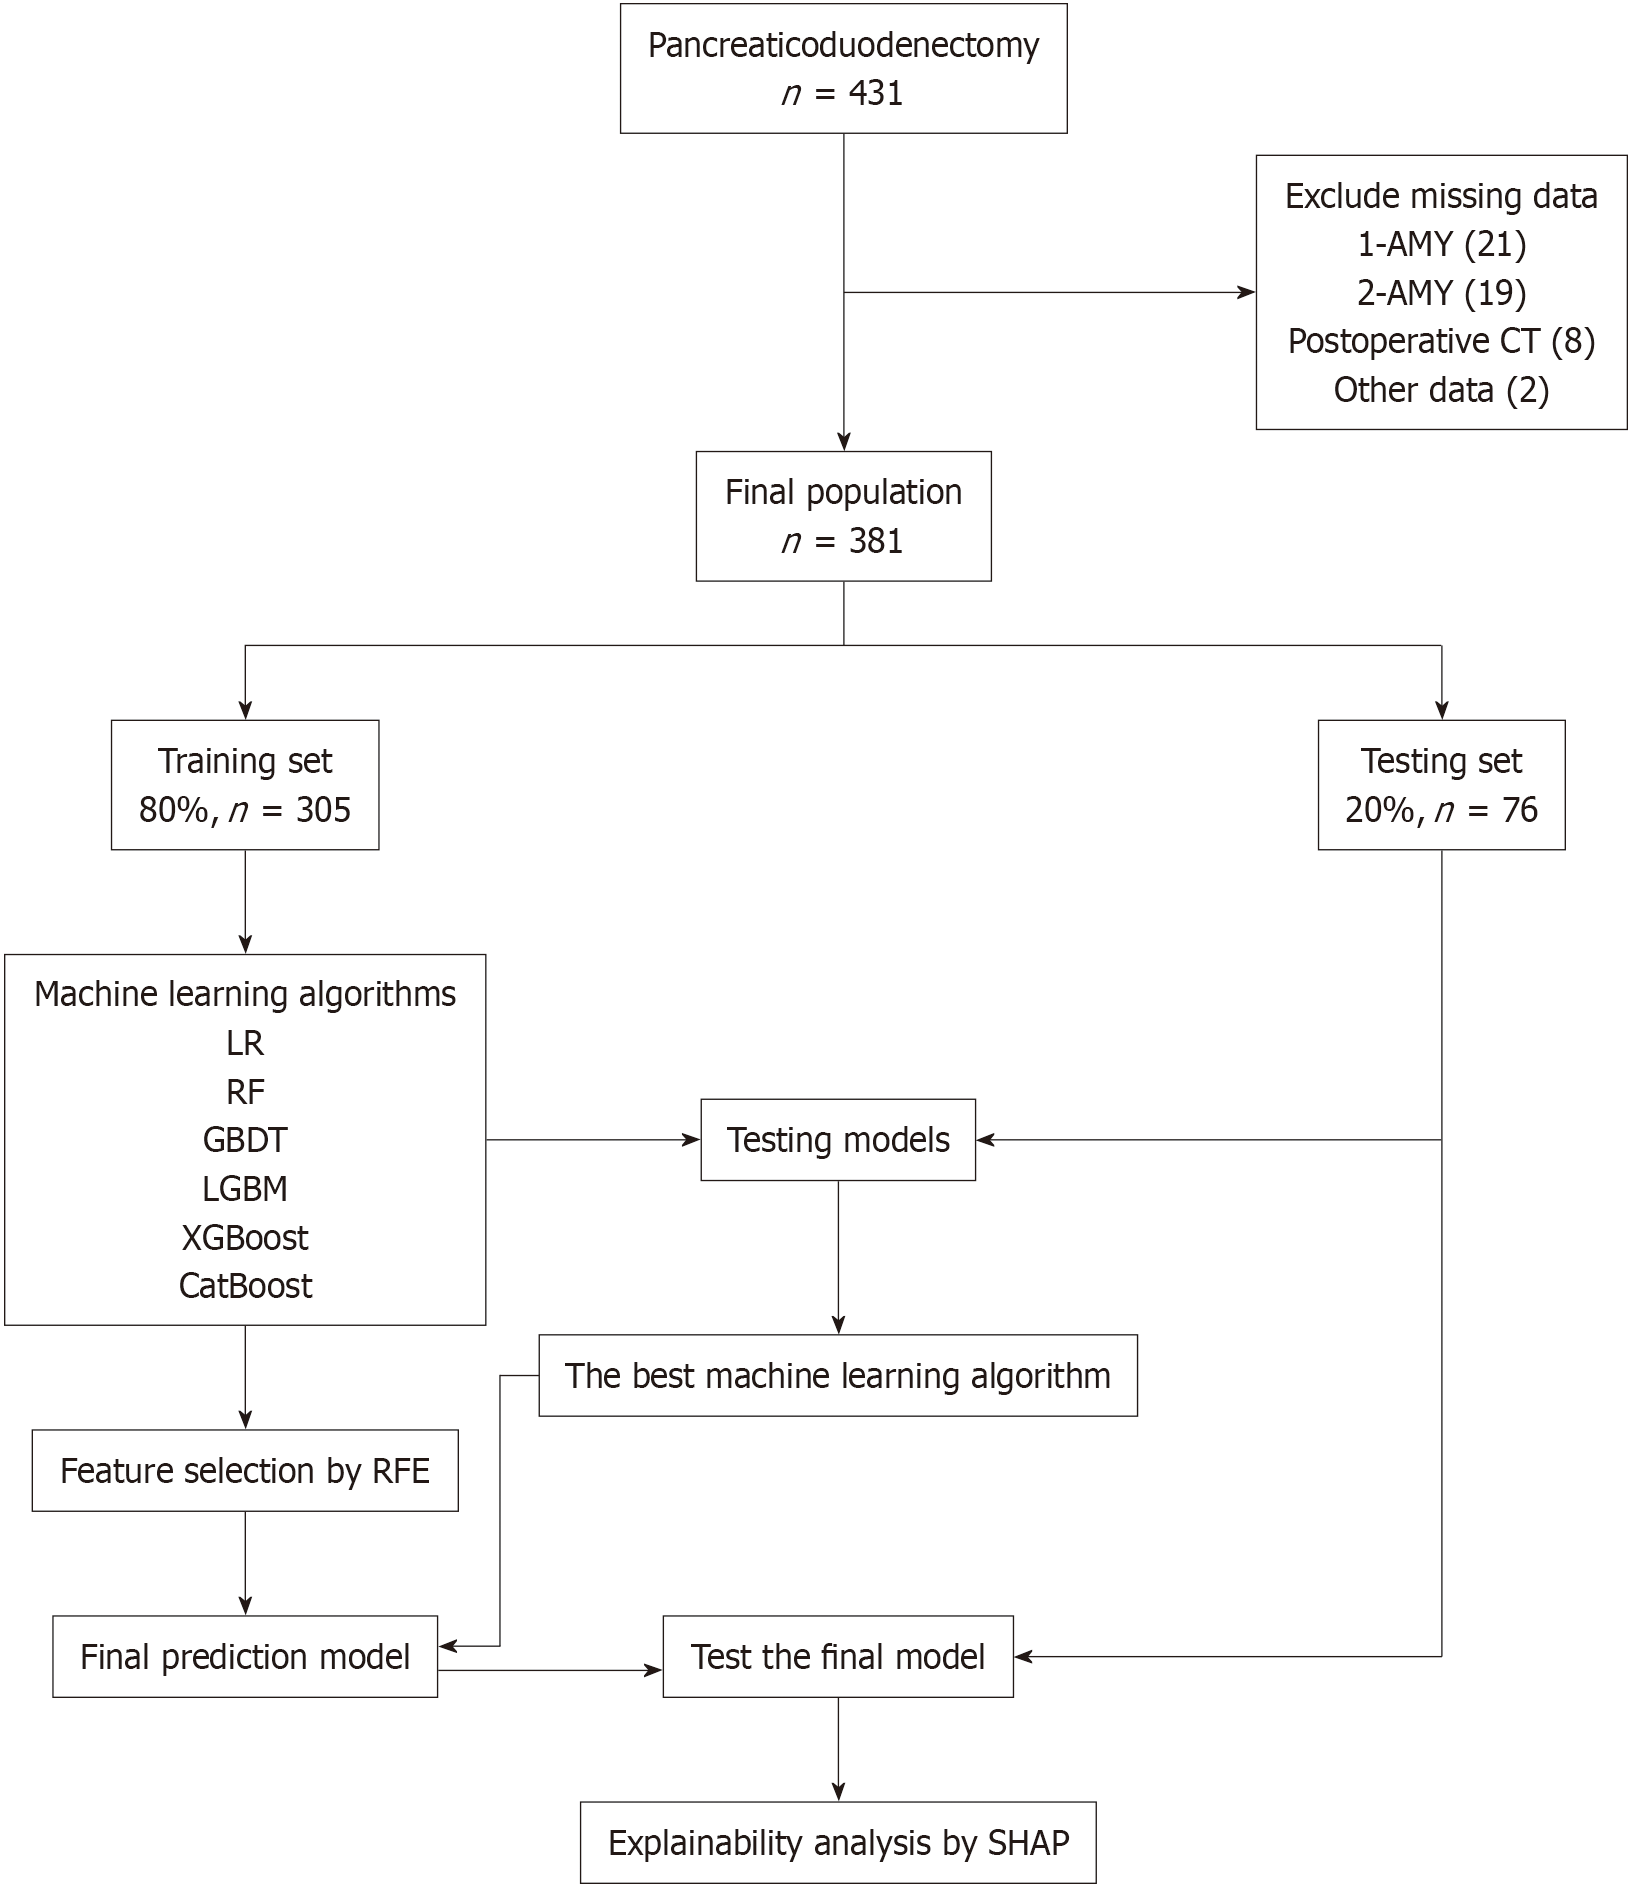
Figure 2 Flowchart: Method for sample selection, model training, validation, feature selection, and determination of the final model.
The overall process of data extraction, training, and testing. AMY: Amylase; CT: Computed tomography; LR: Logistic regression; RF: Random forest; GBDT: Gradient boosting decision tree; LGBM: Light gradient boosting machine; XGBoost: Extreme gradient boosting; CatBoost: Category boosting; RFE: Recursive feature elimination; SHAP: Shapley additive explanation.
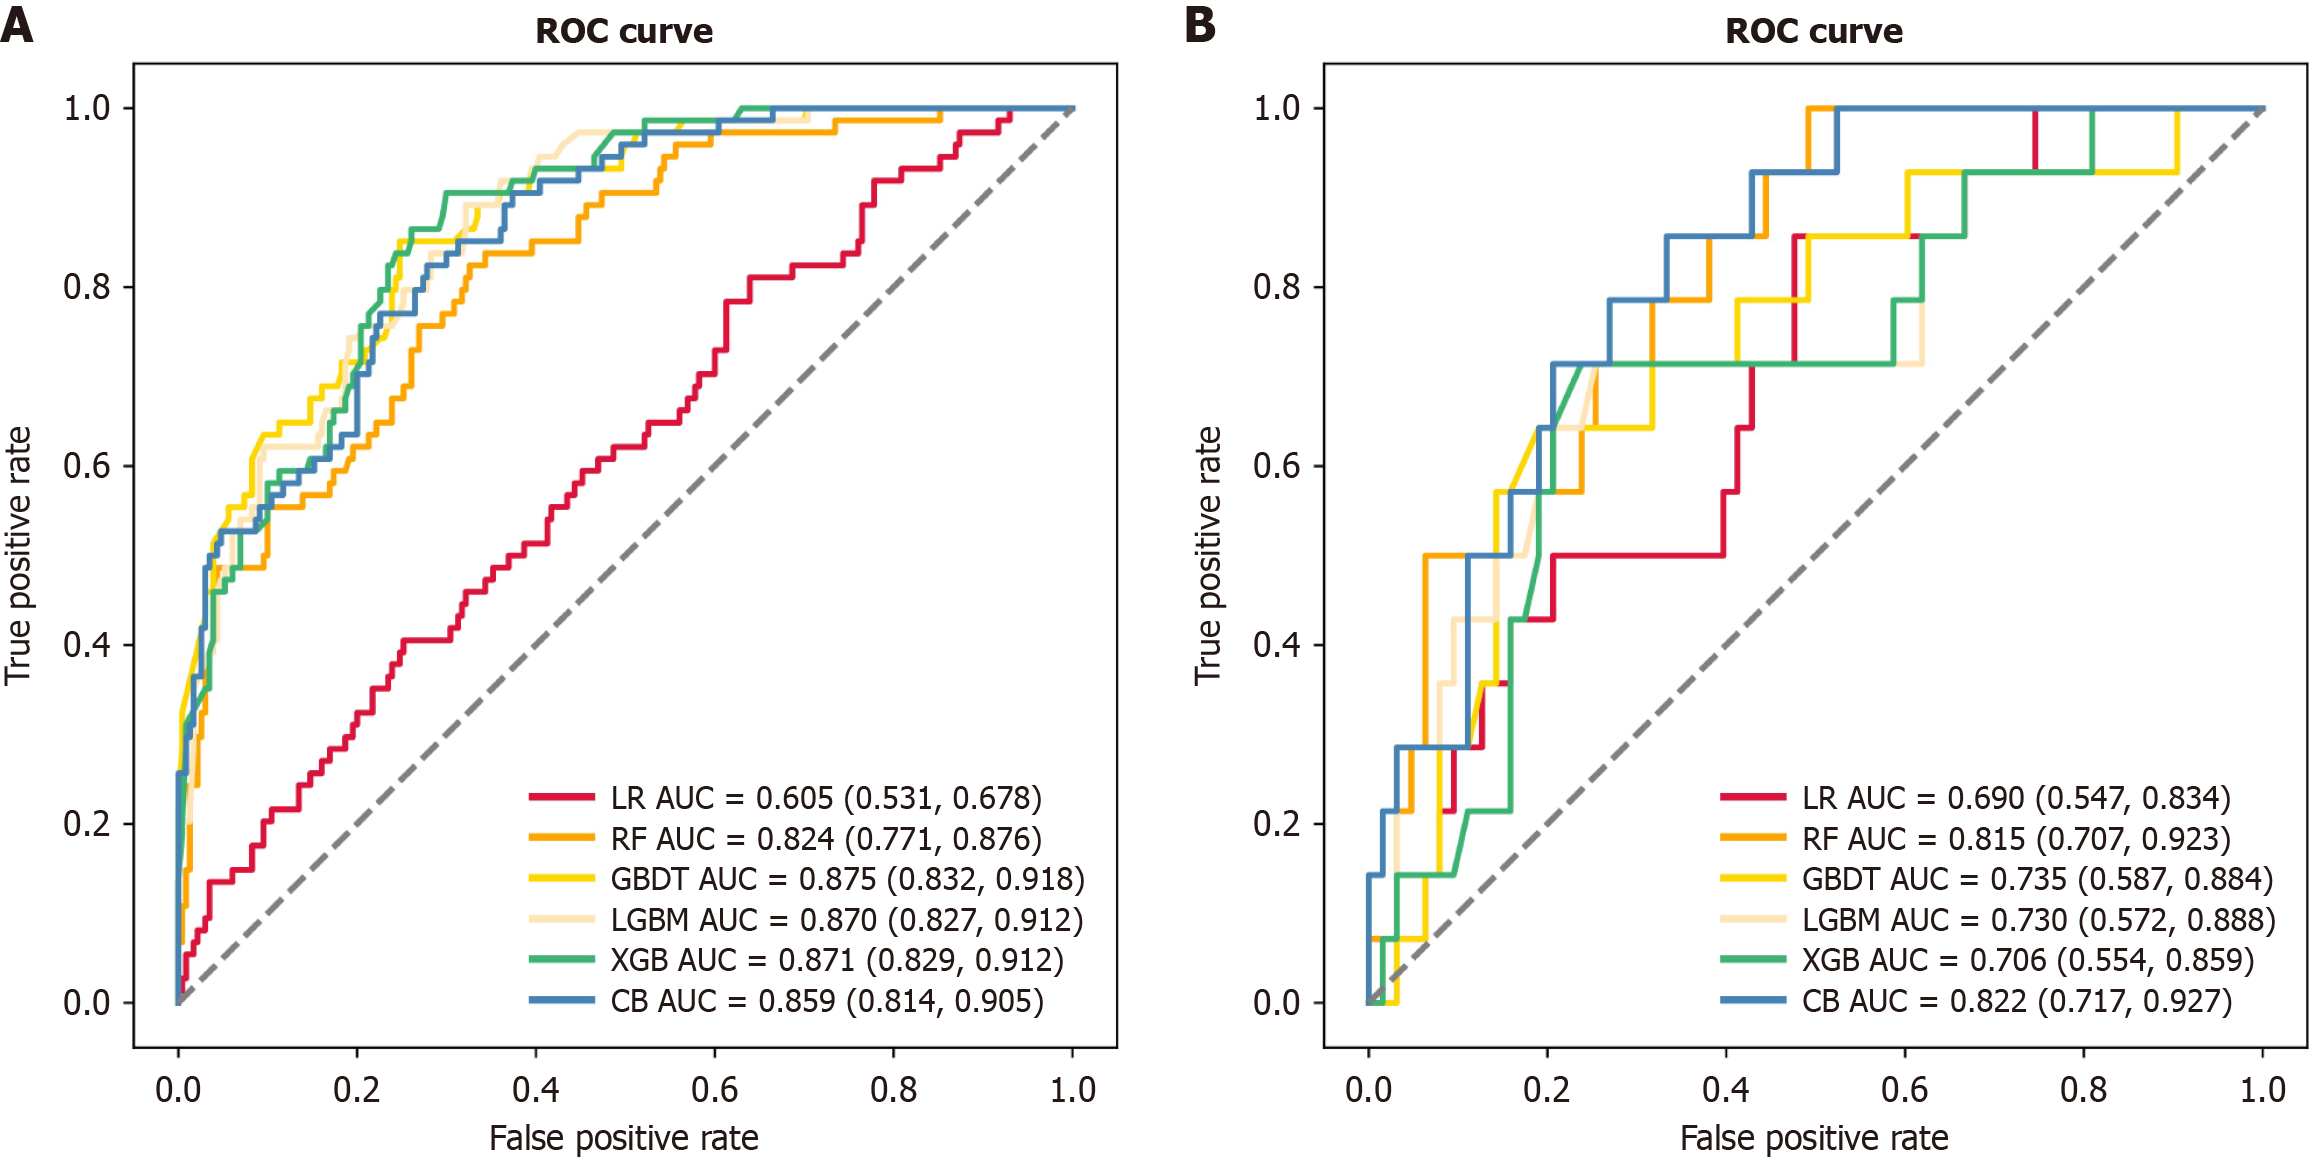
Figure 3 Evaluating the performance of six different machine learning algorithms using preoperative and postoperative variables in both training and testing datasets to predict postpancreatectomy acute pancreatitis.
A: Receiver operating characteristic curves of six machine learning algorithms in the training dataset; B: Receiver operating characteristic curves of six machine learning algorithms in the testing dataset. ROC: Receiver operating characteristic curves; AUC: Area under the receiver operating characteristic curve; LR: Logistic regression; RF: Random forest; GBDT: Gradient boosting decision tree; LGBM: Light gradient boosting machine; XGB: Extreme gradient boosting; CB: Category boosting.
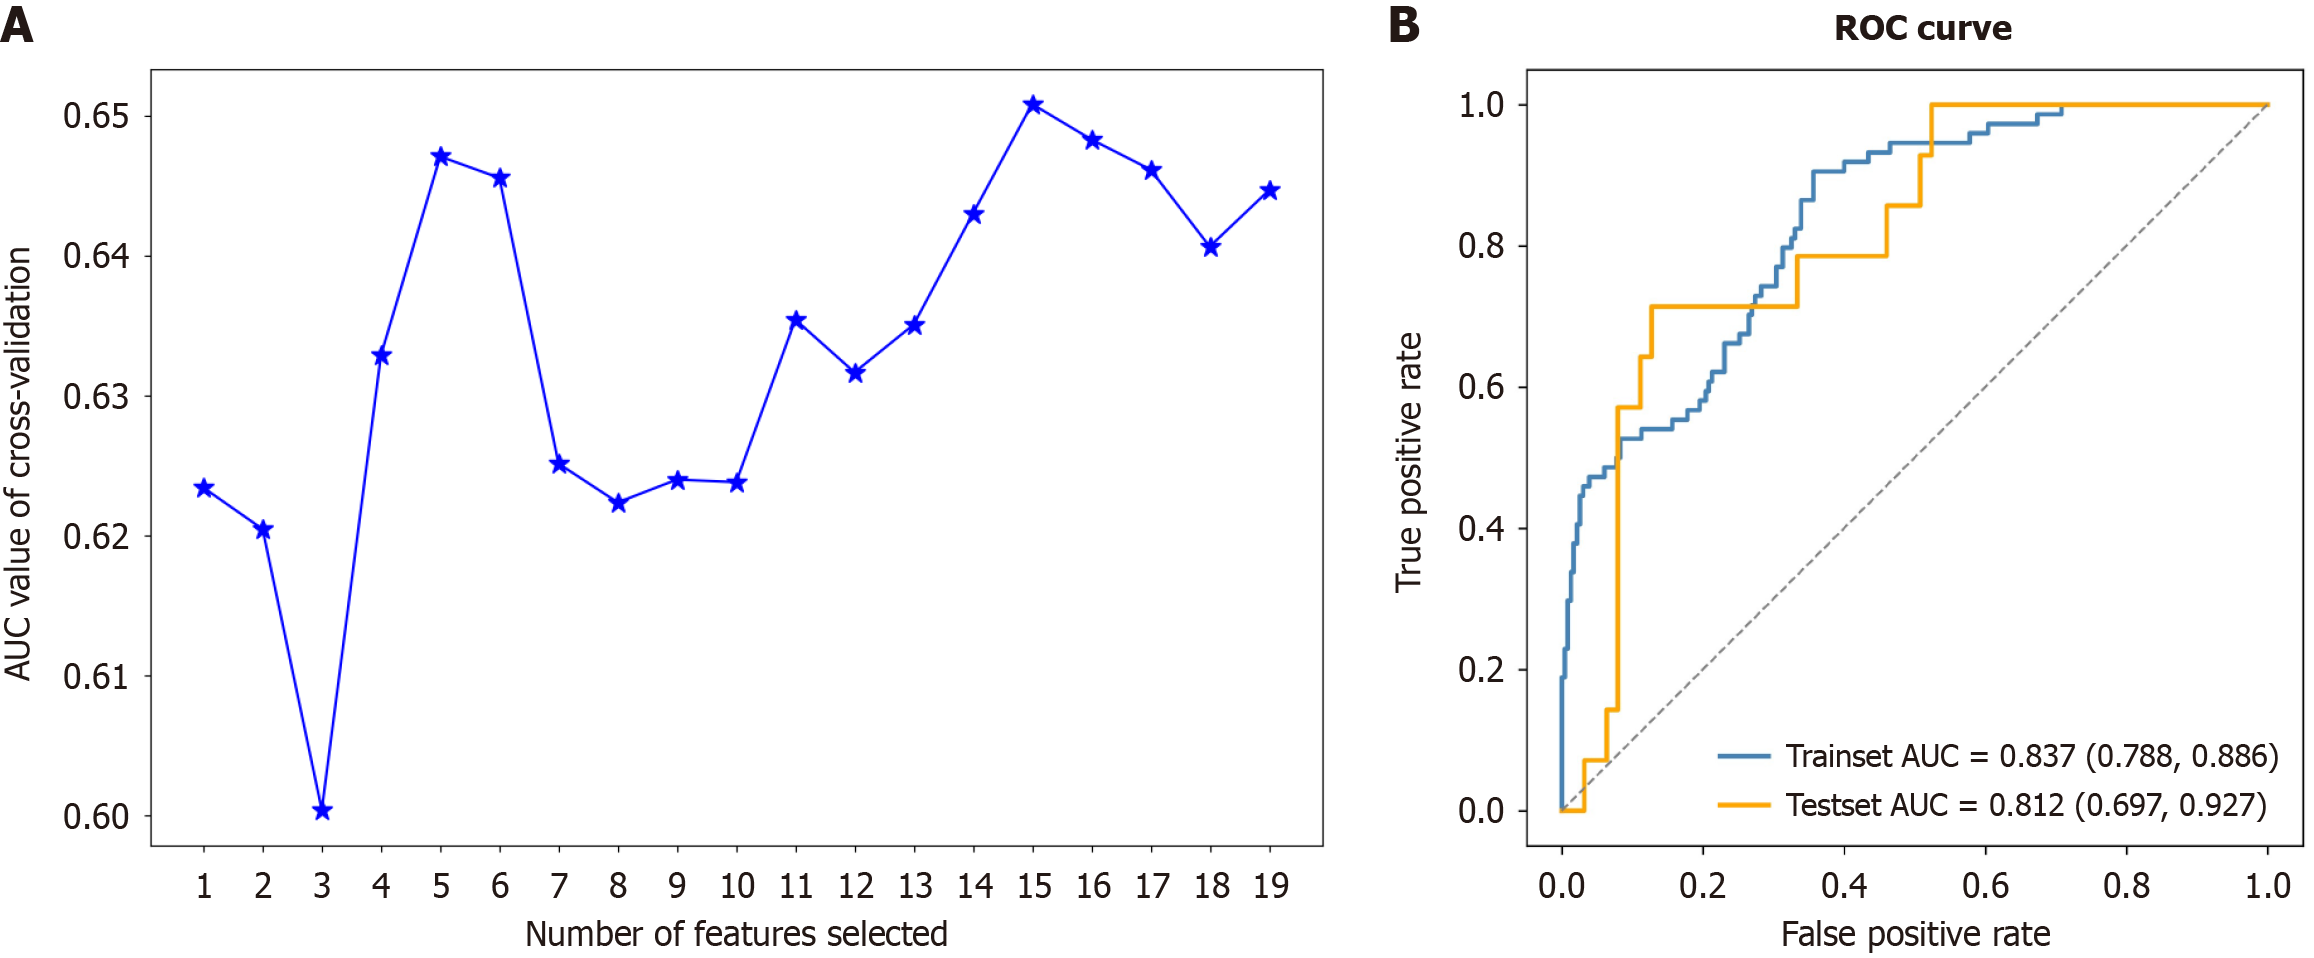
Figure 4 Using the recursive feature elimination method to identify the optimal variables.
A: Five variables were employed for the optimal category boosting algorithm; B: Receiver operating characteristic curves of the category boosting model based on selected variables. ROC: Receiver operating characteristic curves; AUC: Area under the receiver operating characteristic curve.
Figure 5 Five most important variables and their impact on the category boosting model output by shapley additive explanations analysis.
A: Summary of shapley additive explanations analysis on the dataset: Each dot represents a case, with the color indicating the feature’s value - blue for the lowest range and red for the highest range; B: The ranking of the five variables’ importance is determined by shapley additive explanations analysis. MPDD: Main pancreatic duct diameter; EBL: Estimated blood loss; BMI: Body mass; SHAP: Shapley additive explanations.
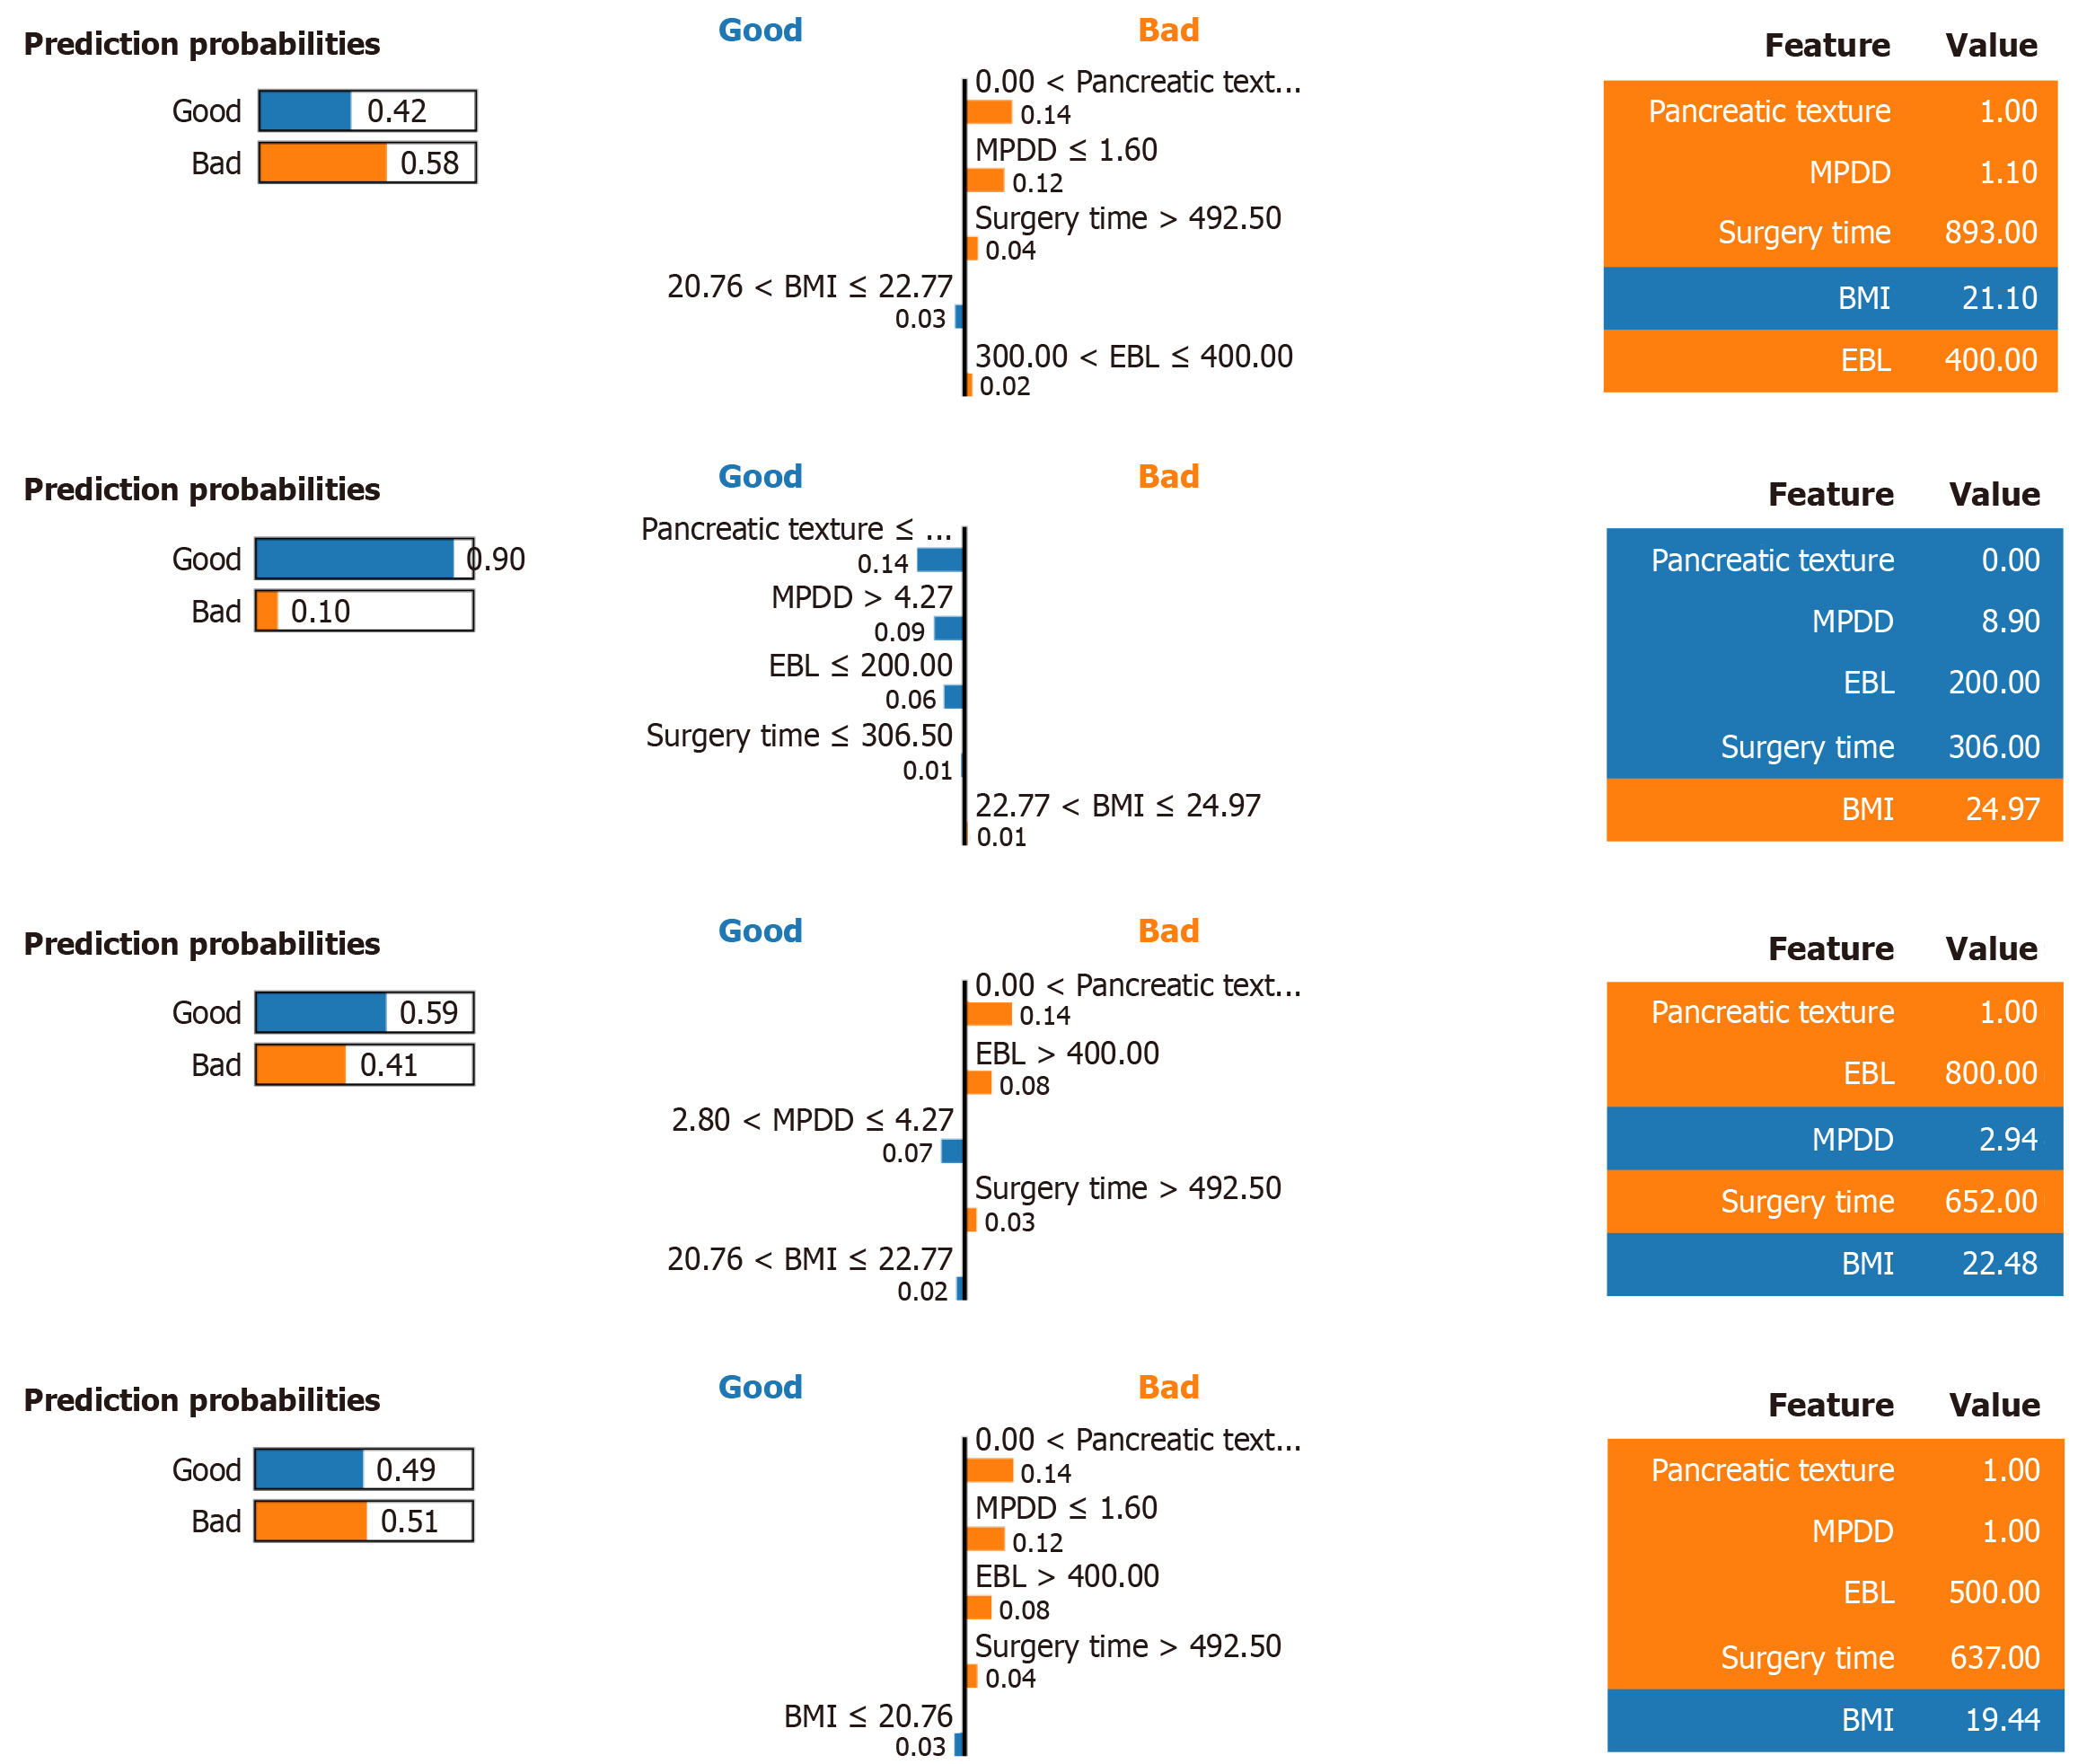
Figure 6 Results of local interpretable model-agnostic explanations applied to four randomly selected patients using category boosting model.
MPDD: Main pancreatic duct diameter; BMI: Body mass index; EBL: Estimated blood loss.
- Citation: Ma JM, Wang PF, Yang LQ, Wang JK, Song JP, Li YM, Wen Y, Tang BJ, Wang XD. Machine learning model-based prediction of postpancreatectomy acute pancreatitis following pancreaticoduodenectomy: A retrospective cohort study. World J Gastroenterol 2025; 31(8): 102071
- URL: https://www.wjgnet.com/1007-9327/full/v31/i8/102071.htm
- DOI: https://dx.doi.org/10.3748/wjg.v31.i8.102071


