Copyright
©The Author(s) 2025.
World J Gastroenterol. Feb 21, 2025; 31(7): 101672
Published online Feb 21, 2025. doi: 10.3748/wjg.v31.i7.101672
Published online Feb 21, 2025. doi: 10.3748/wjg.v31.i7.101672
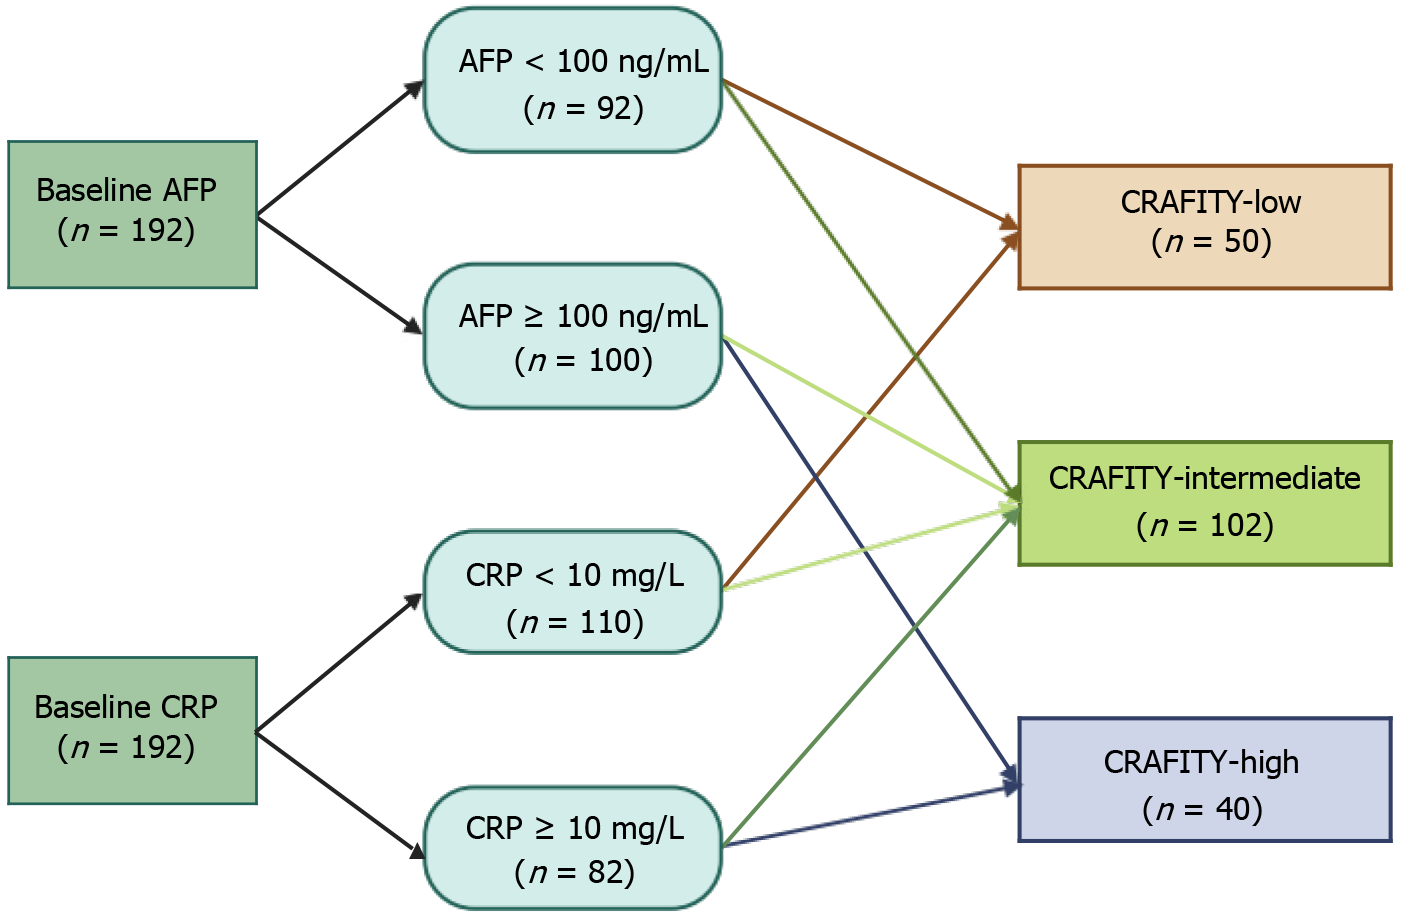
Figure 1 Flowchart of the CRAFITY score.
AFP: Alpha-fetoprotein; CRP: C-reactive protein.
Figure 2 Kaplan-Meier curves of progression-free survival and overall survival across different CRAFITY groups.
A: Kaplan-Meier curves of progression-free survival; B: Kaplan-Meier curves of overall survival. PFS: Progression-free survival; OS: Overall survival.
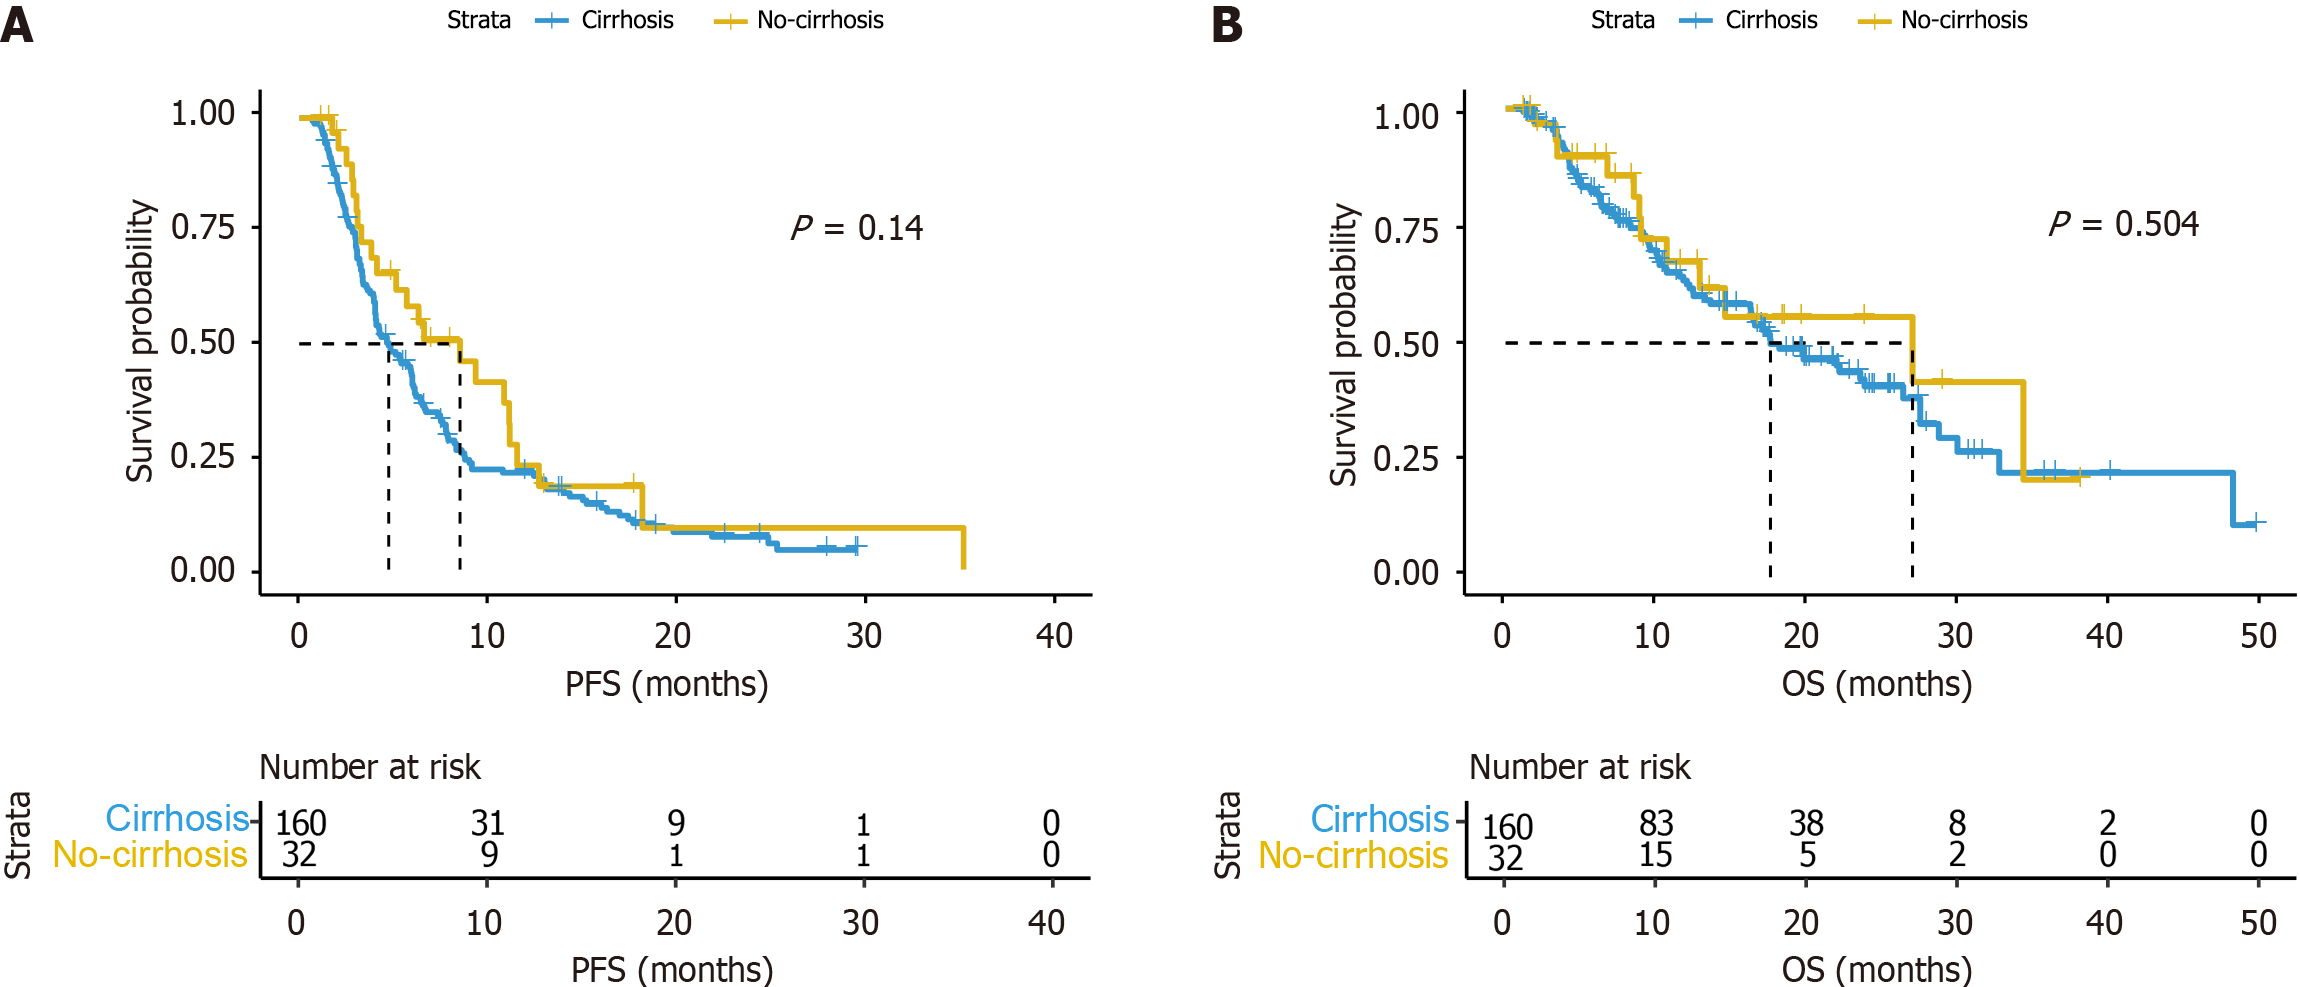
Figure 3 Kaplan-Meier curves of progression-free survival and overall survival in patients with or without cirrhosis.
A: Kaplan-Meier curves of progression-free survival; B: Kaplan-Meier curves of overall survival. PFS: Progression-free survival; OS: Overall survival.
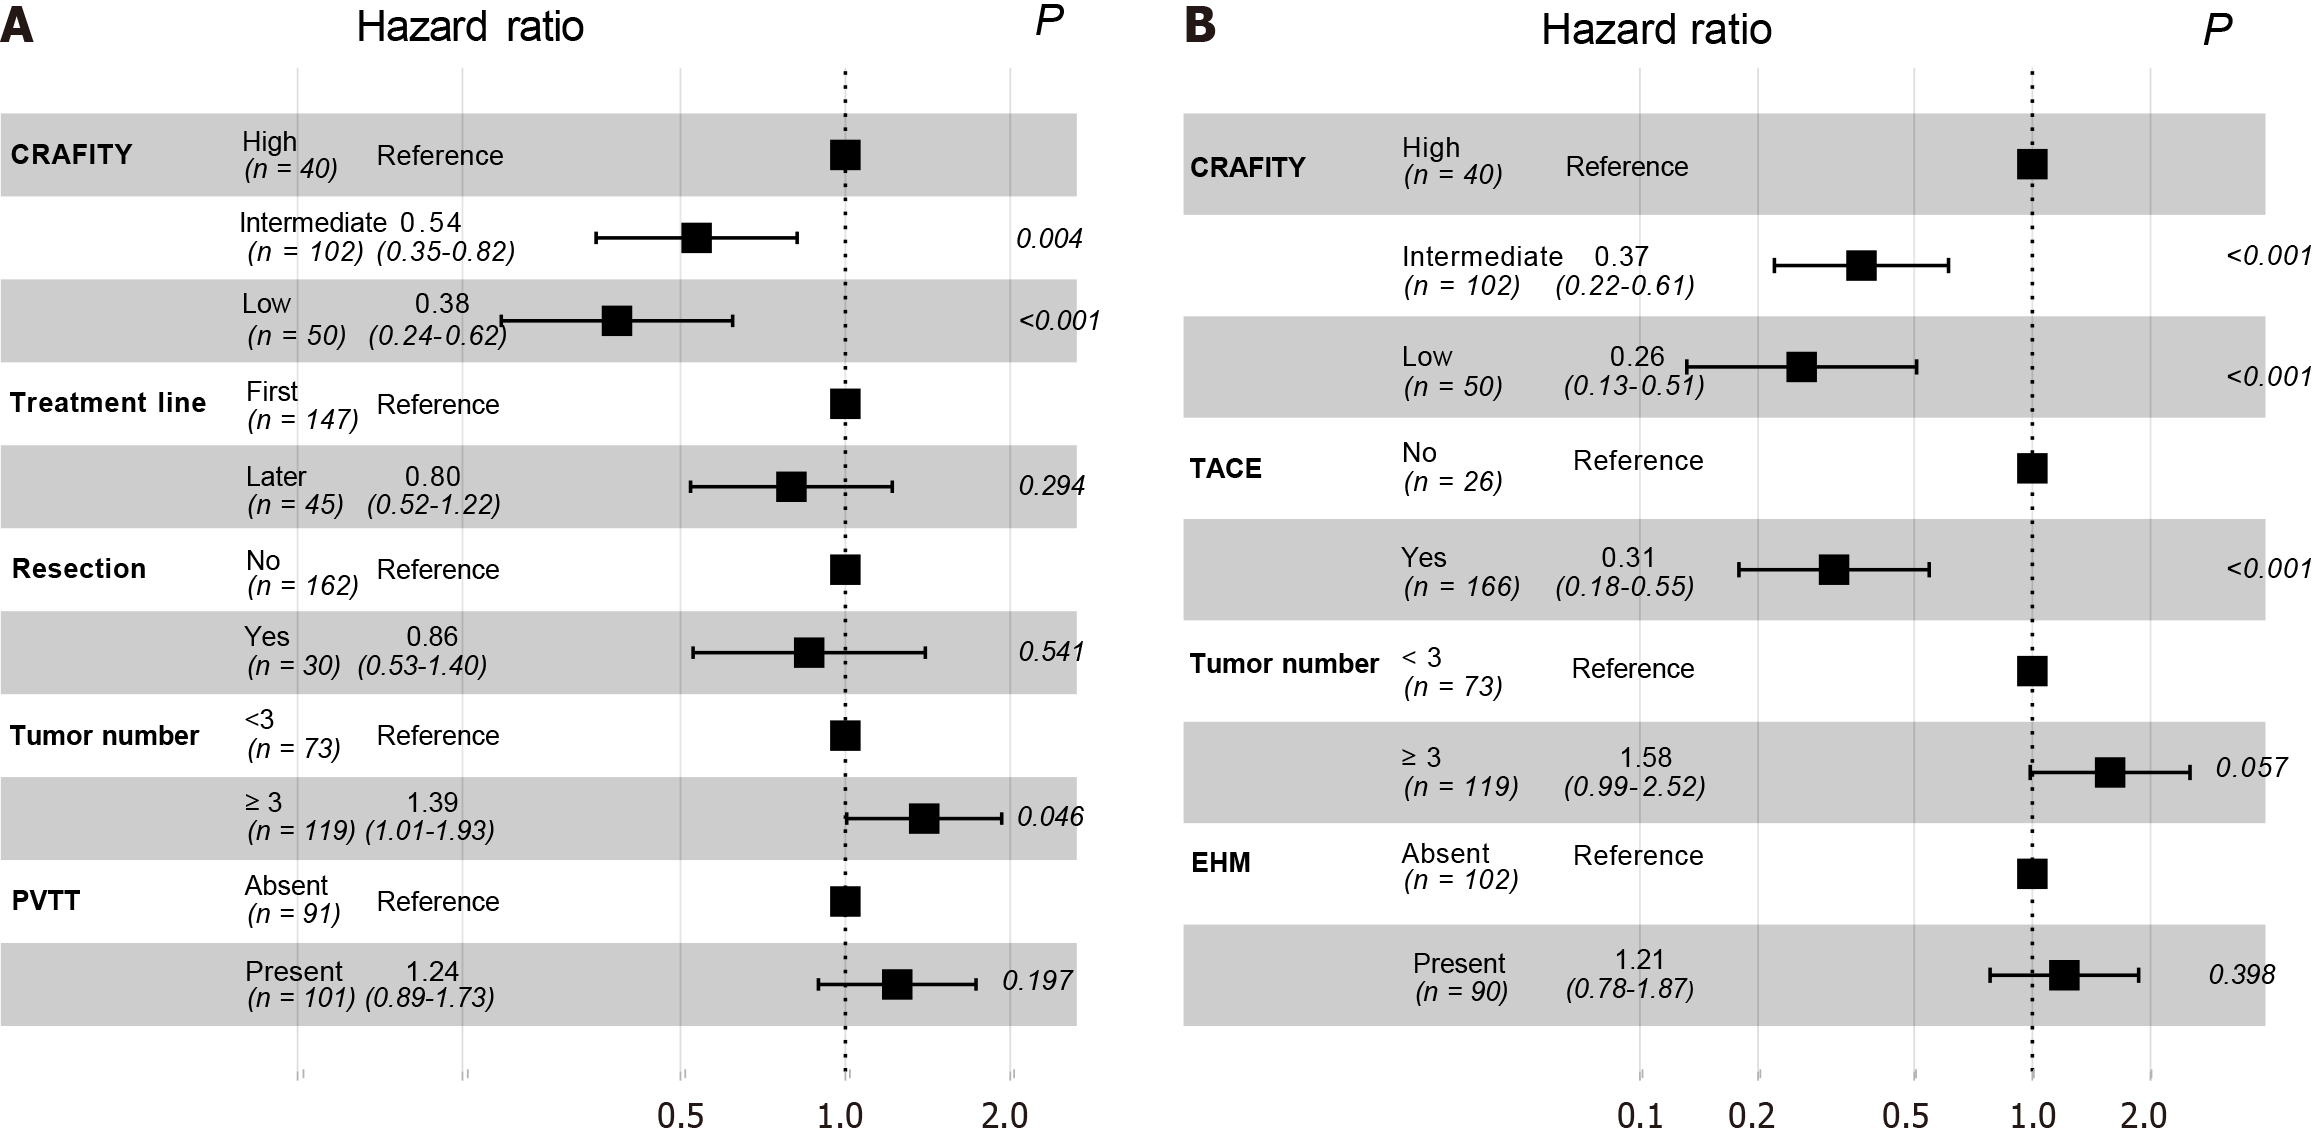
Figure 4 Forest plot of multivariate Cox regression for progression-free survival and overall survival.
A: Forest plot for progression-free survival; B: Forest plot for overall survival. PVTT: Portal vein tumor thrombus; TACE: Transarterial chemoembolization; EHM: Extrahepatic metastasis.
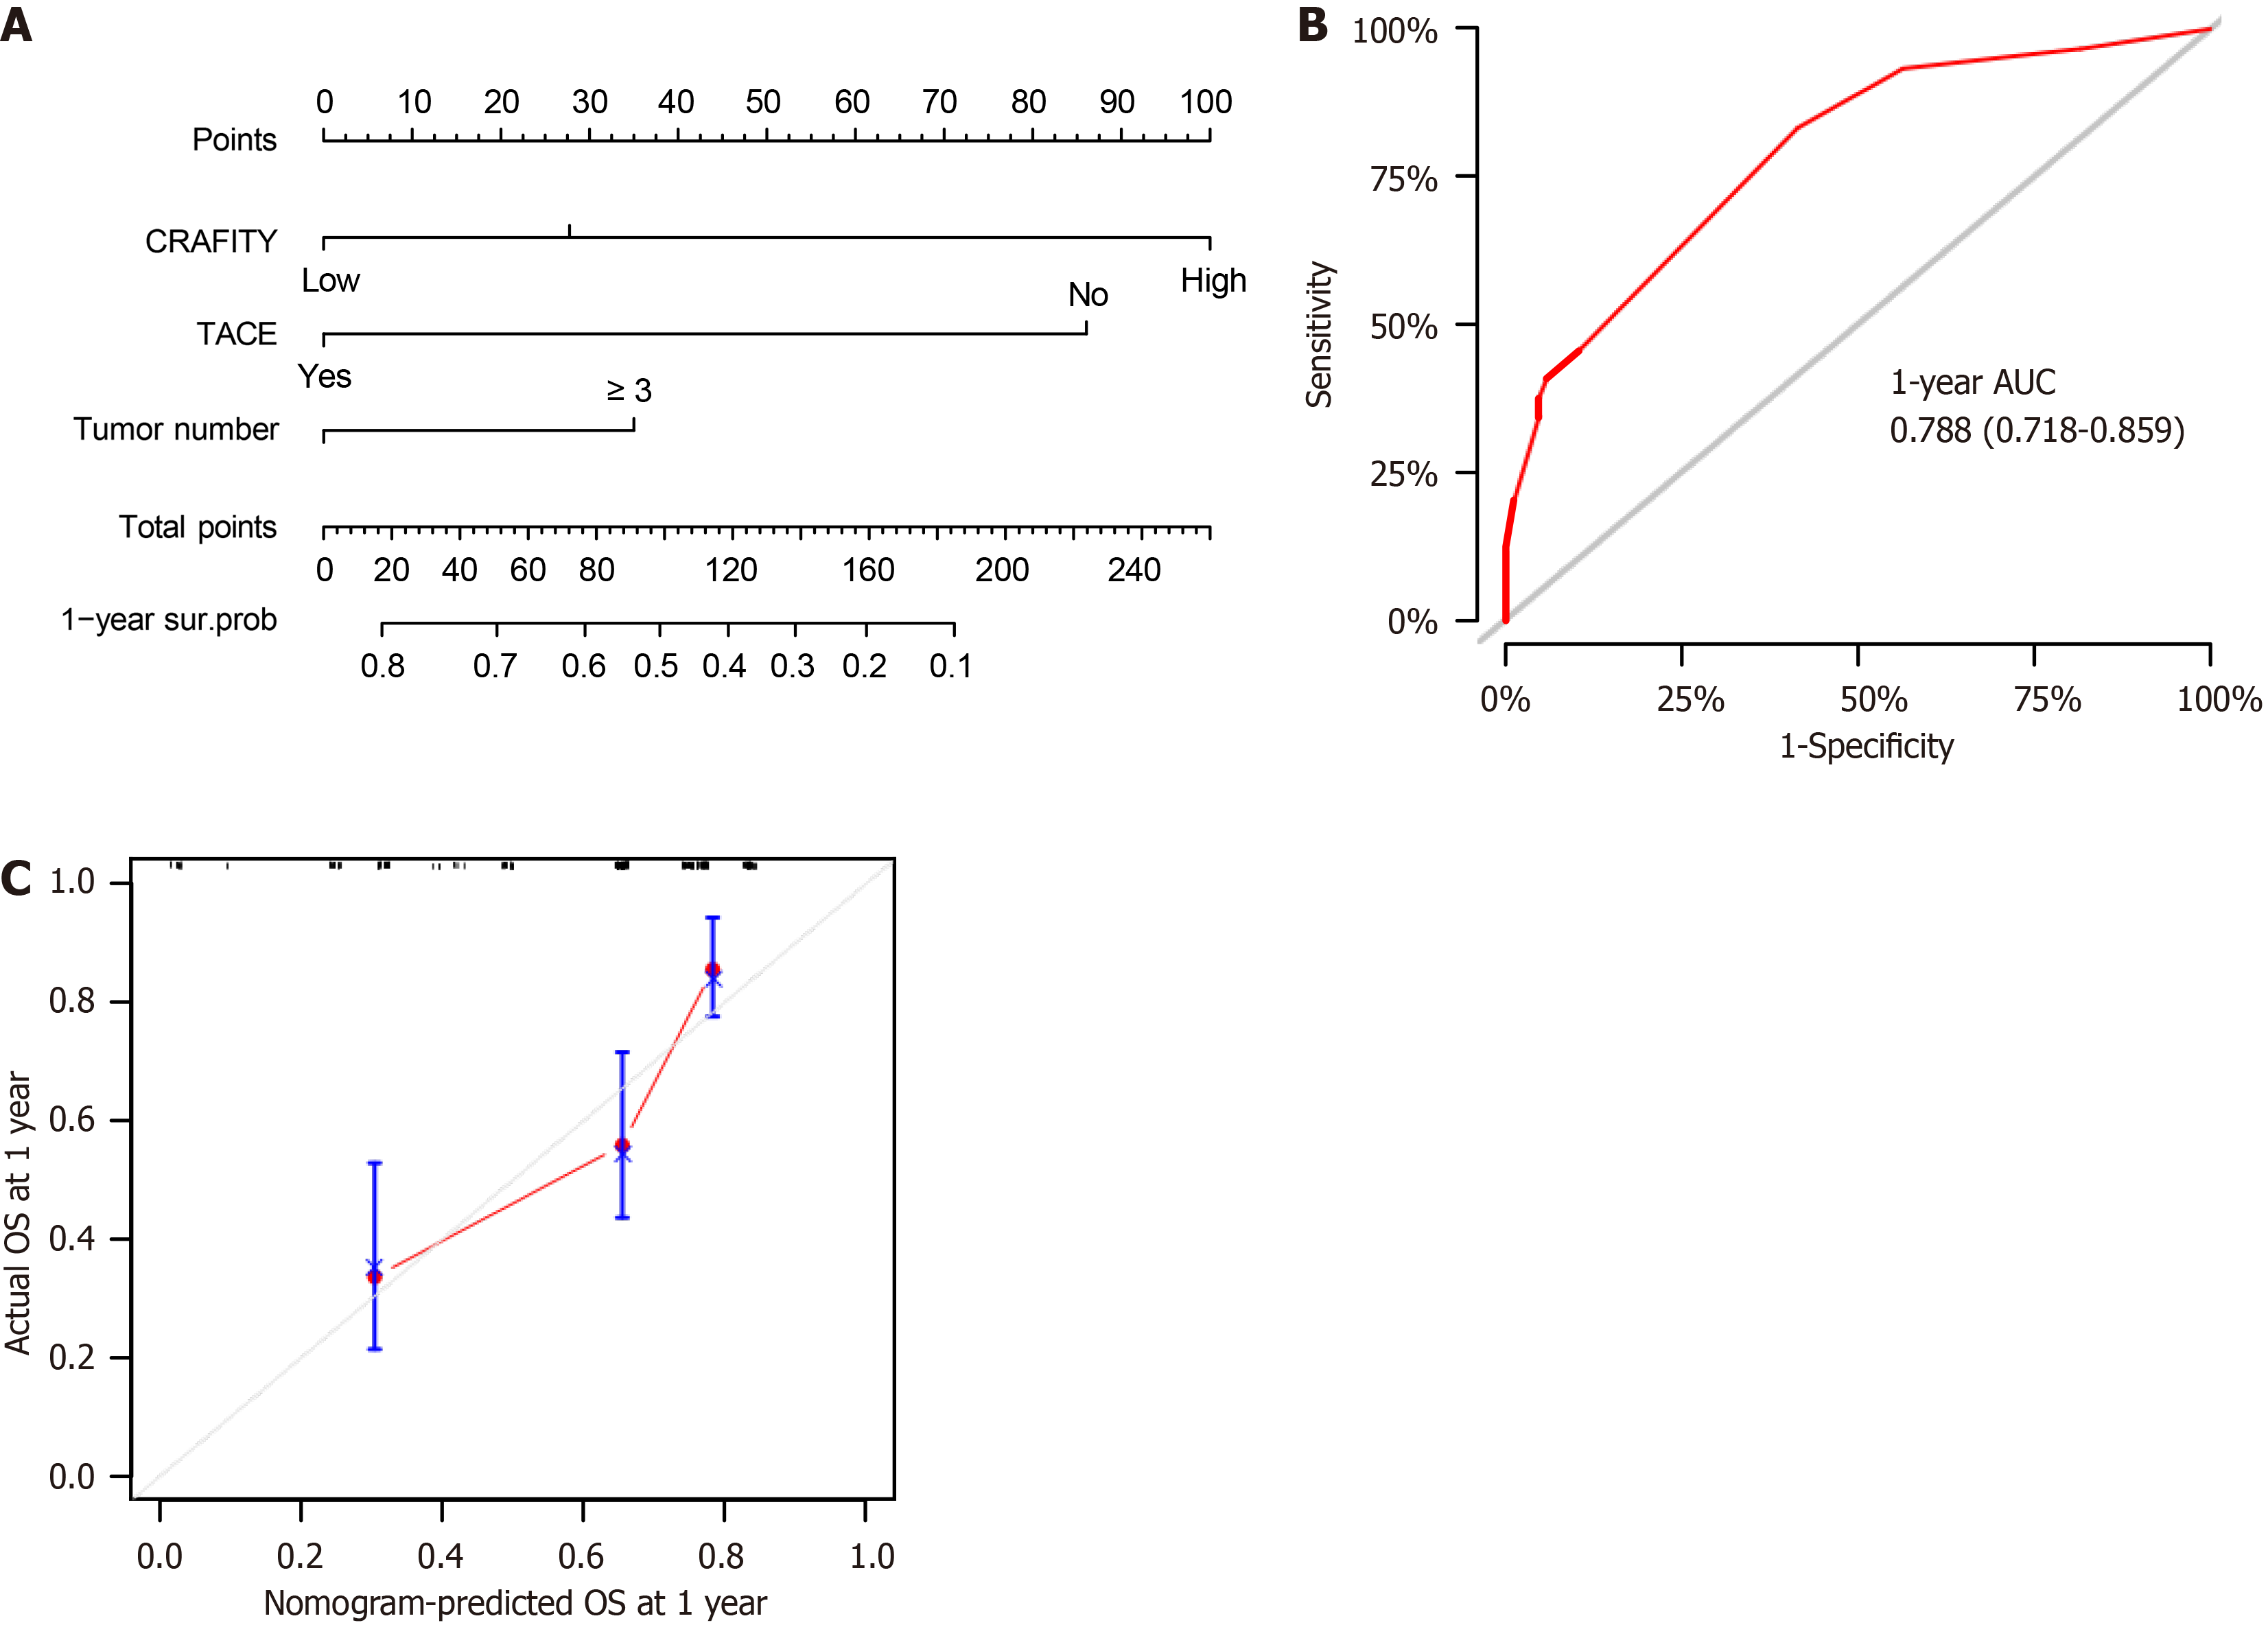
Figure 5 Predictive model.
A: Nomogram for predicting overall survival at 1-year; B: Receiver operating curve of the nomogram; C: Calibration curve of the nomogram. TACE: Transarterial chemoembolization; AUC: Area under the curve; OS: Overall survival.
- Citation: Yin X, Deng N, Ding XY, Chen JL, Sun W. CRAFITY score and nomogram predict the clinical efficacy of lenvatinib combined with immune checkpoint inhibitors in hepatocellular carcinoma. World J Gastroenterol 2025; 31(7): 101672
- URL: https://www.wjgnet.com/1007-9327/full/v31/i7/101672.htm
- DOI: https://dx.doi.org/10.3748/wjg.v31.i7.101672


