Copyright
©The Author(s) 2025.
World J Gastroenterol. Feb 21, 2025; 31(7): 101104
Published online Feb 21, 2025. doi: 10.3748/wjg.v31.i7.101104
Published online Feb 21, 2025. doi: 10.3748/wjg.v31.i7.101104
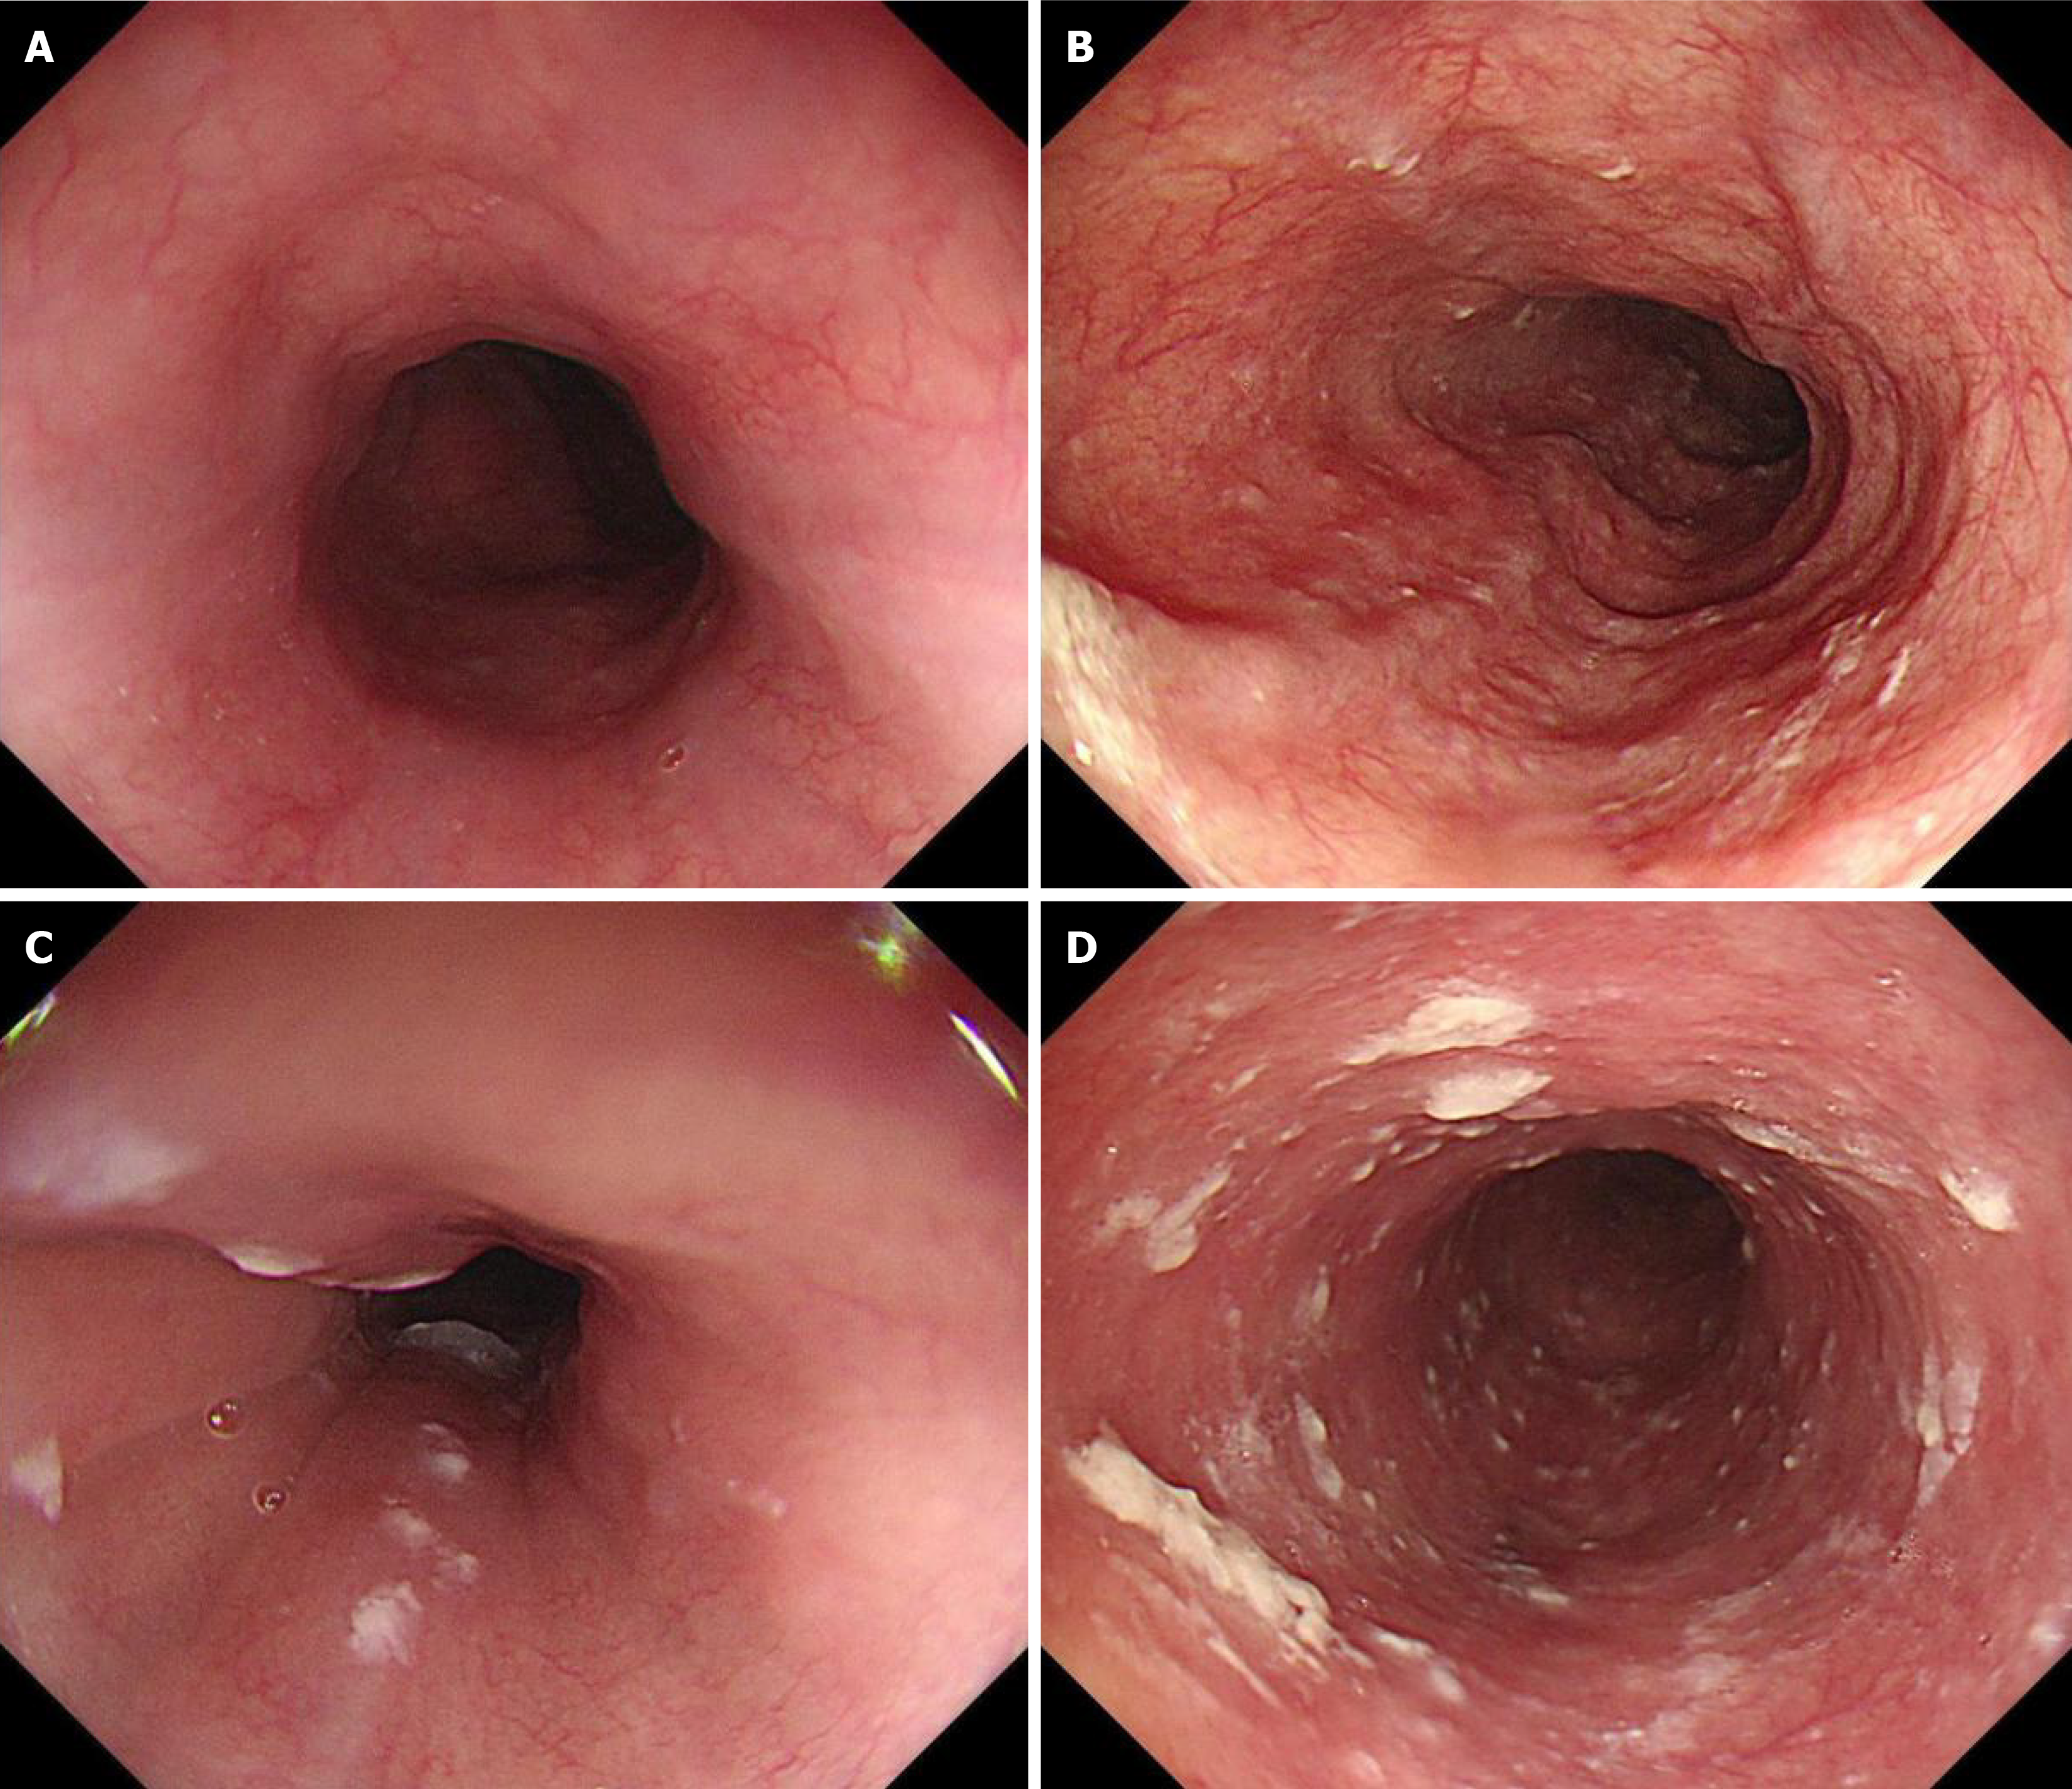
Figure 1 Endoscopic manifestations of fungal esophagitis and suspected fungal esophagitis.
A: Endoscopic esophageal manifestations in esophageal health patients; B: Kodsi grade I manifestations of fungal esophagitis (FE) and suspected FE; C: Kodsi grade II manifestations of FE and suspected FE; D: Kodsi grade III manifestations of FE.
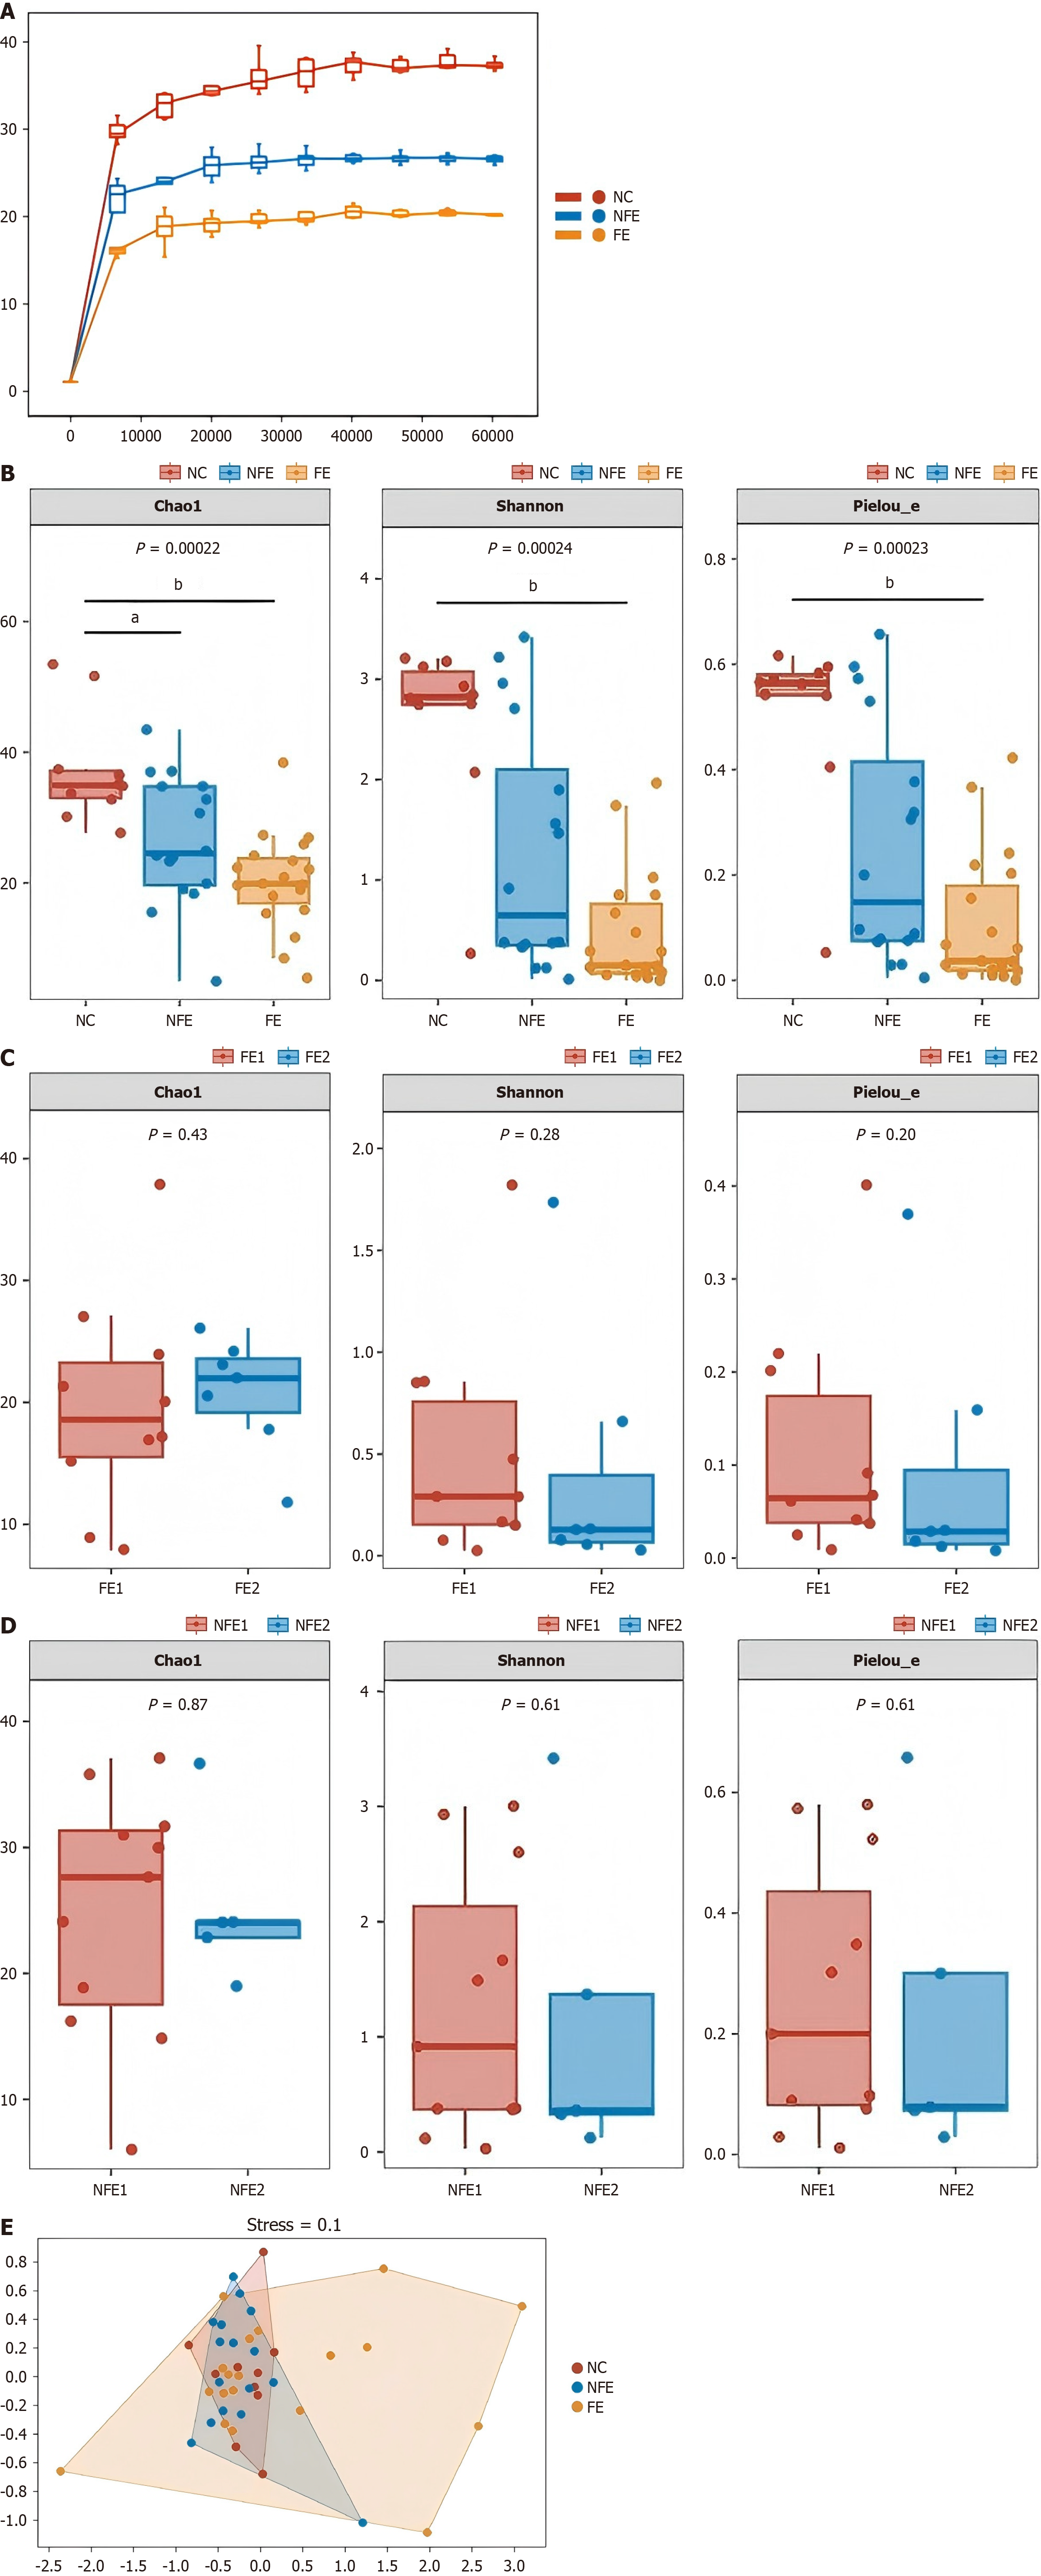
Figure 2 The mycobiota diversity in three groups.
A: A rarefaction curve based on species richness in the Chao1 index. The X-axis shows the drawing depth, and the Y-axis shows the median value of the alpha diversity index calculated 10 times vs the boxplot. The flatter the curve, indicating that the sequencing result is sufficient to reflect the diversity contained in the current sample; B: Comparison of alpha diversity analyses between groups in the esophageal normal controls, suspected fungal esophagitis (NFE), and FE groups; C: Comparison of alpha diversity analysis between Kodsi I and Kodsi II within the FE group; D: Comparison of alpha diversity analysis between Kodsi grade I and Kodsi grade II within the suspected FE group. The alpha-diversity was evaluated by the Chao1 index, Shannon, and Pielou’s evenness, Chao1 index, Shannon index and Pielou's evenness index represent richness, diversity and evenness within the community, respectively; E: Analysis of NMDS using the Bray-Curtis distance matrix (stress = 0.14). aP < 0.05, bP < 0.001. NC: The esophageal normal control; NFE: Suspected fungal esophagitis; FE: Fungal esophagitis.
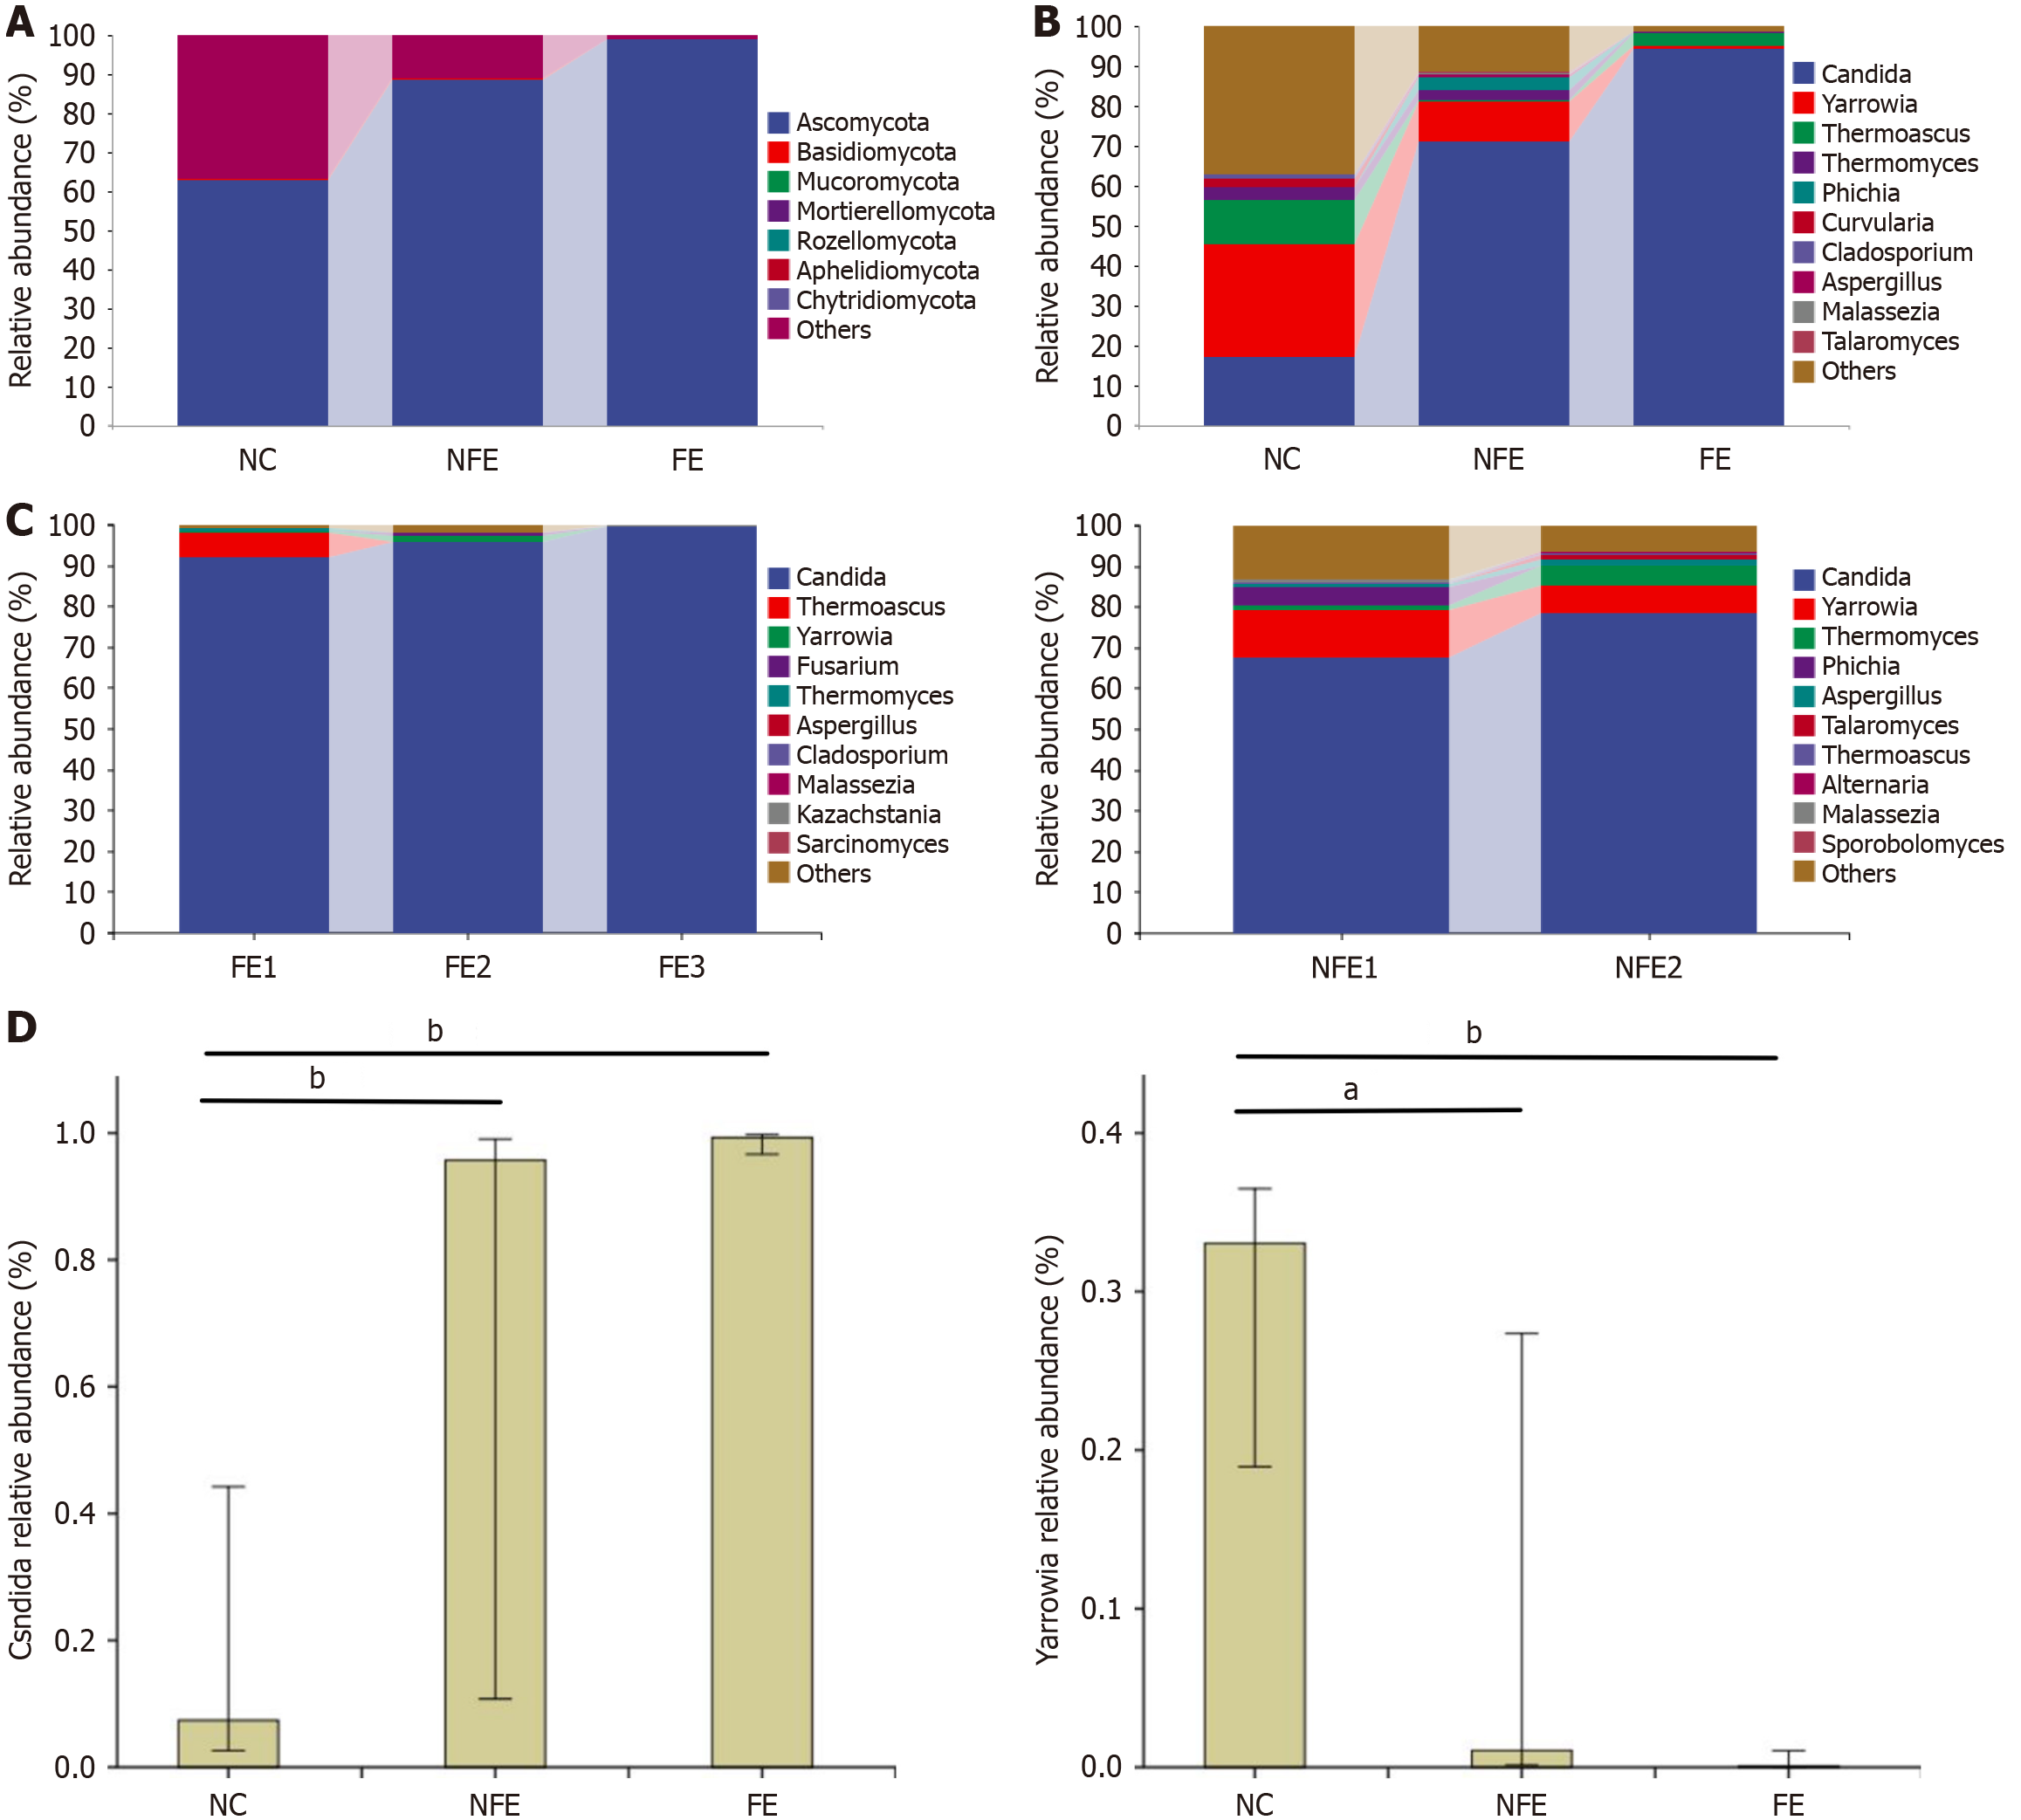
Figure 3 Taxonomic characteristics of esophageal fungi microflora in the esophageal normal control group, suspected fungal esophagitis group, and fungal esophagitis group.
A: Relative abundance at the phylum level in three groups; B: Relative abundance at the genus level in three groups; C: Relative abundance at the genus level of the Kodsi subgroup in the suspected fungal esophagitis (NFE) and FE groups; D: Relative abundance of Candida genera and Yarrowia genera in three groups. Diverse letters specify statistically significant differences among groups. aP < 0.05, bP < 0.001. NC: The esophageal normal control; NFE: Suspected fungal esophagitis; FE: Fungal esophagitis.
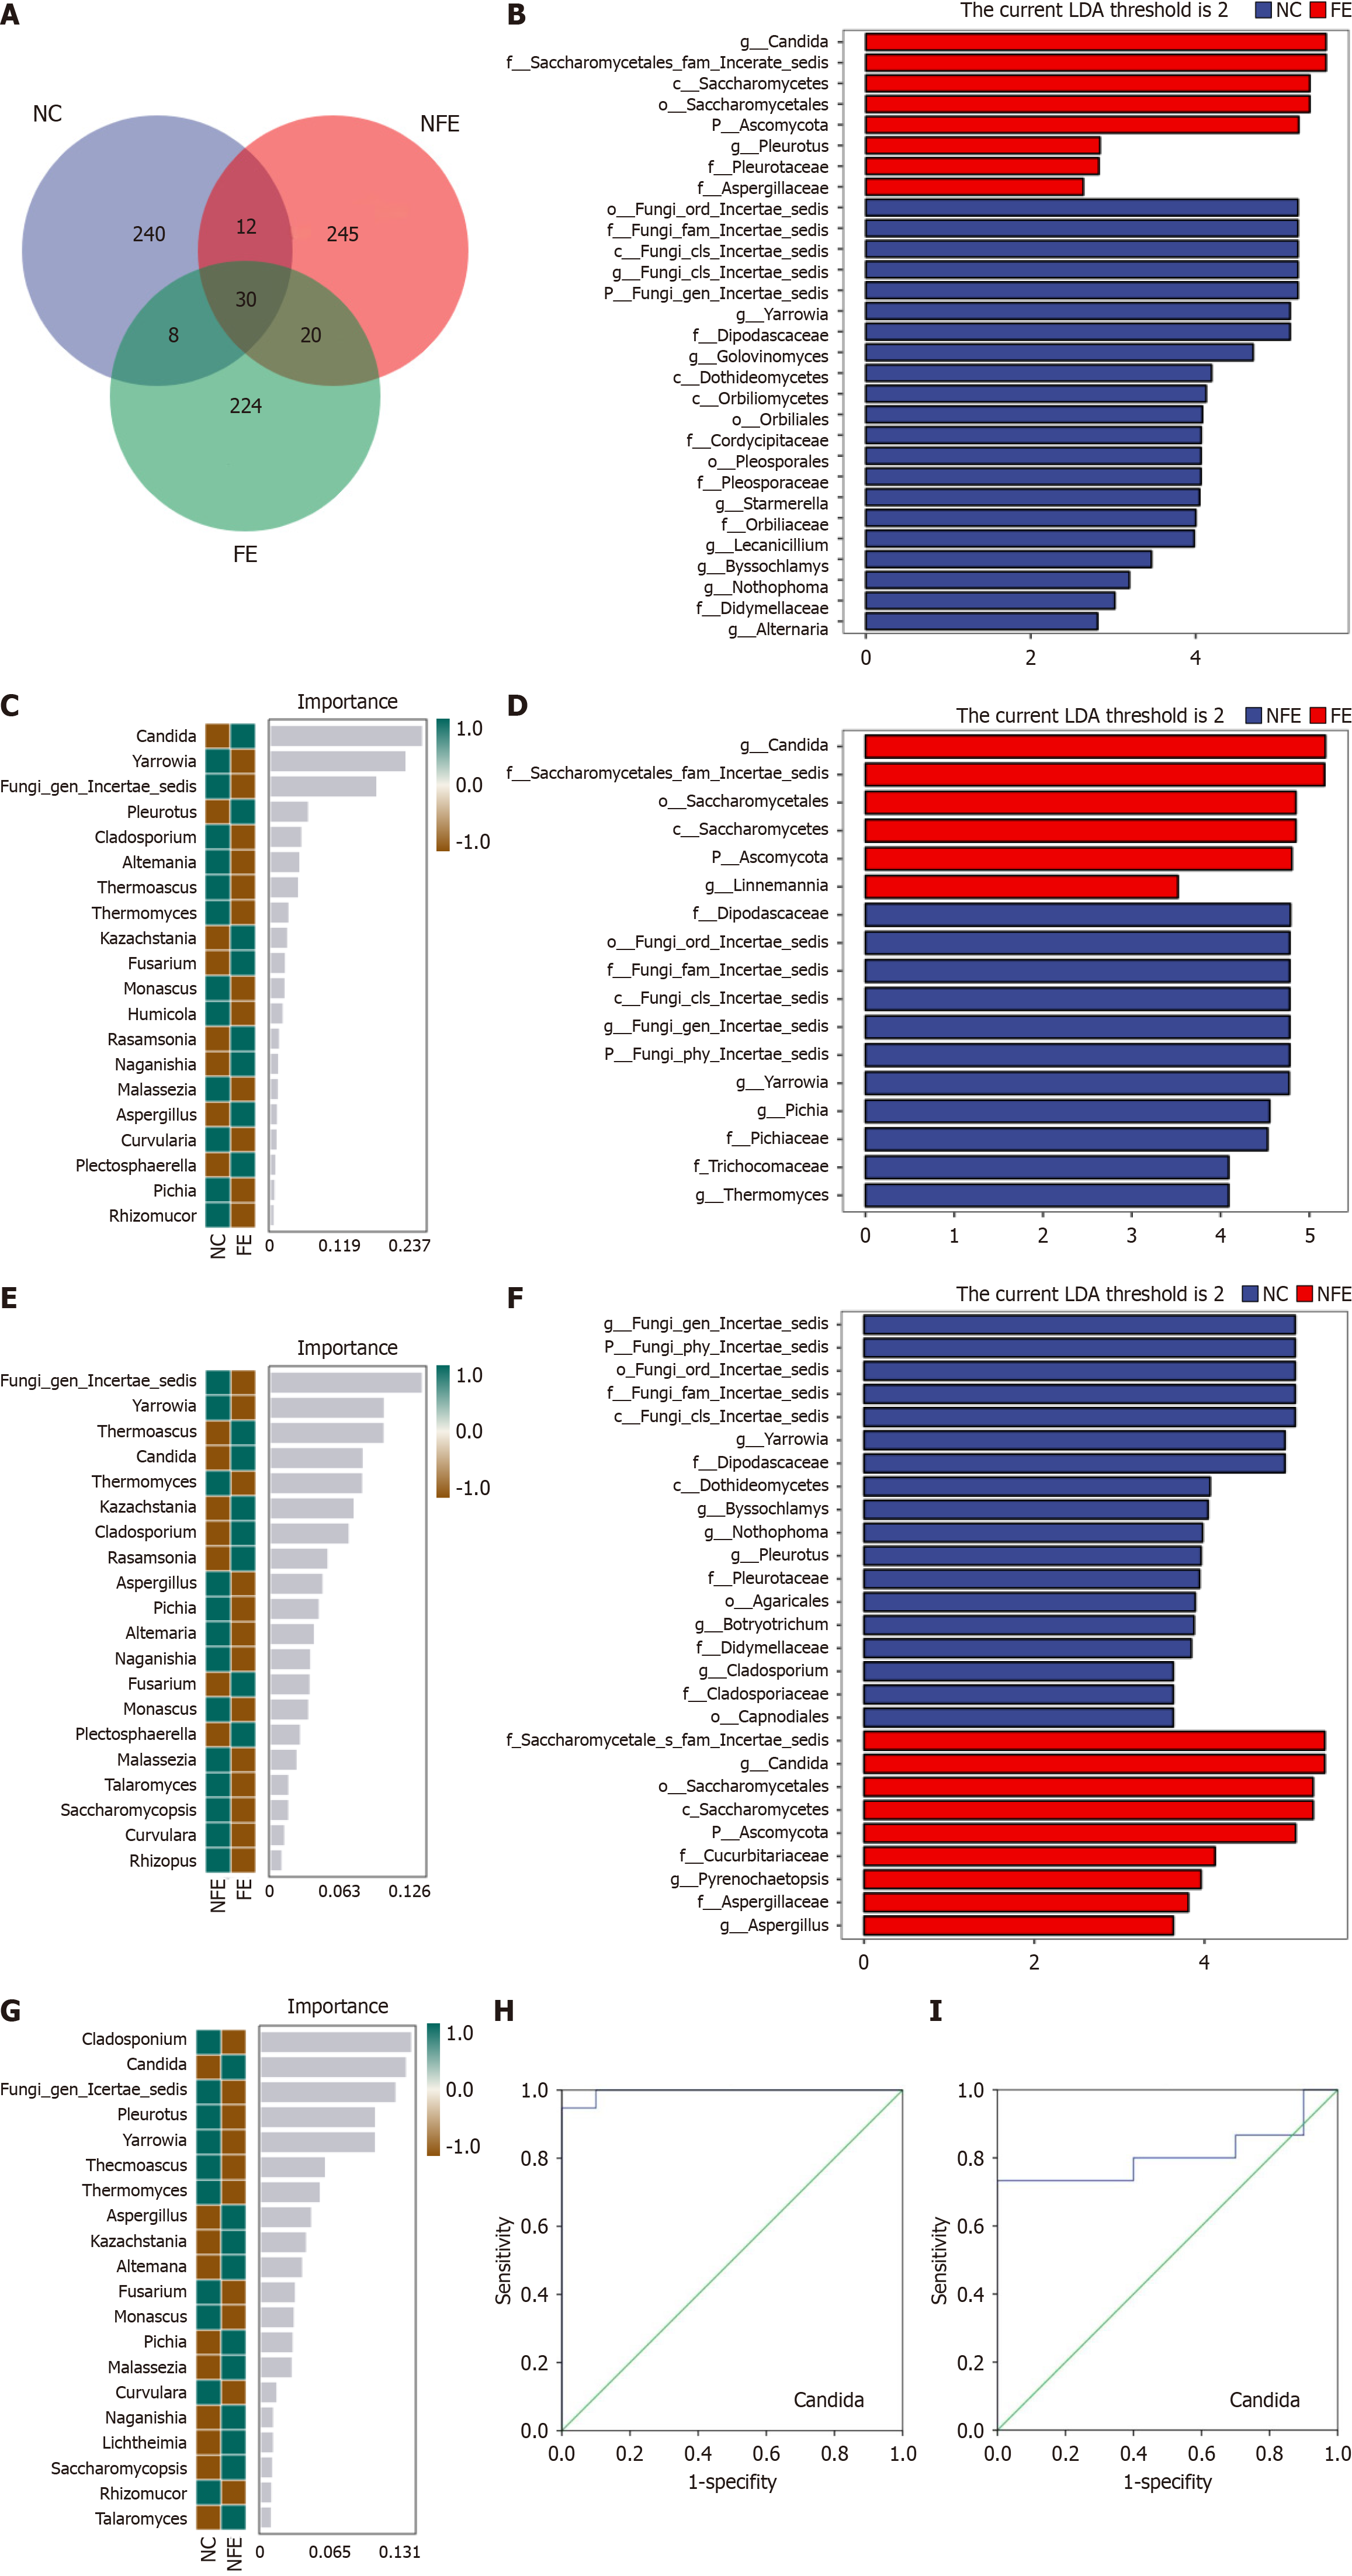
Figure 4 Specific species differences in the three groups.
A: Venn diagram based on amplicon sequence variant (ASV) level. Each color block represents a group, and the overlapping areas between the color blocks indicate the ASVs shared among the corresponding groups. The number of each block indicates the number of ASVs contained in that block; B: Linear discriminant analysis Effect Size (LEfSe) analysis of the esophageal normal controls (NCs) group and fungal esophagitis (FE) group at genus level; C: Random forest analysis of NCs group and FE group at genus level; D: LEfSe analysis of suspected FE group and FE group at genus level; E: Random forest analysis of suspected FE group and FE group at genus level; F: LEfSe analysis of suspected FE group and NCs group at genus level; G: Random forest analysis of suspected FE group and NCs group at genus level; H: Receiver operating characteristic (ROC) curve of Candida species relative abundance in the NCs group and FE group; I: ROC curve of Candida species relative abundance in the NCs group and suspected FE group. NC: The esophageal normal control; NFE: Suspected fungal esophagitis; FE: Fungal esophagitis.
- Citation: Song YK, Zheng L, Liu AX, Ma JJ. Internal transcribed spacer sequencing to explore the intrinsic composition of fungal communities in fungal esophagitis. World J Gastroenterol 2025; 31(7): 101104
- URL: https://www.wjgnet.com/1007-9327/full/v31/i7/101104.htm
- DOI: https://dx.doi.org/10.3748/wjg.v31.i7.101104


