Copyright
©The Author(s) 2025.
World J Gastroenterol. Jan 28, 2025; 31(4): 99014
Published online Jan 28, 2025. doi: 10.3748/wjg.v31.i4.99014
Published online Jan 28, 2025. doi: 10.3748/wjg.v31.i4.99014
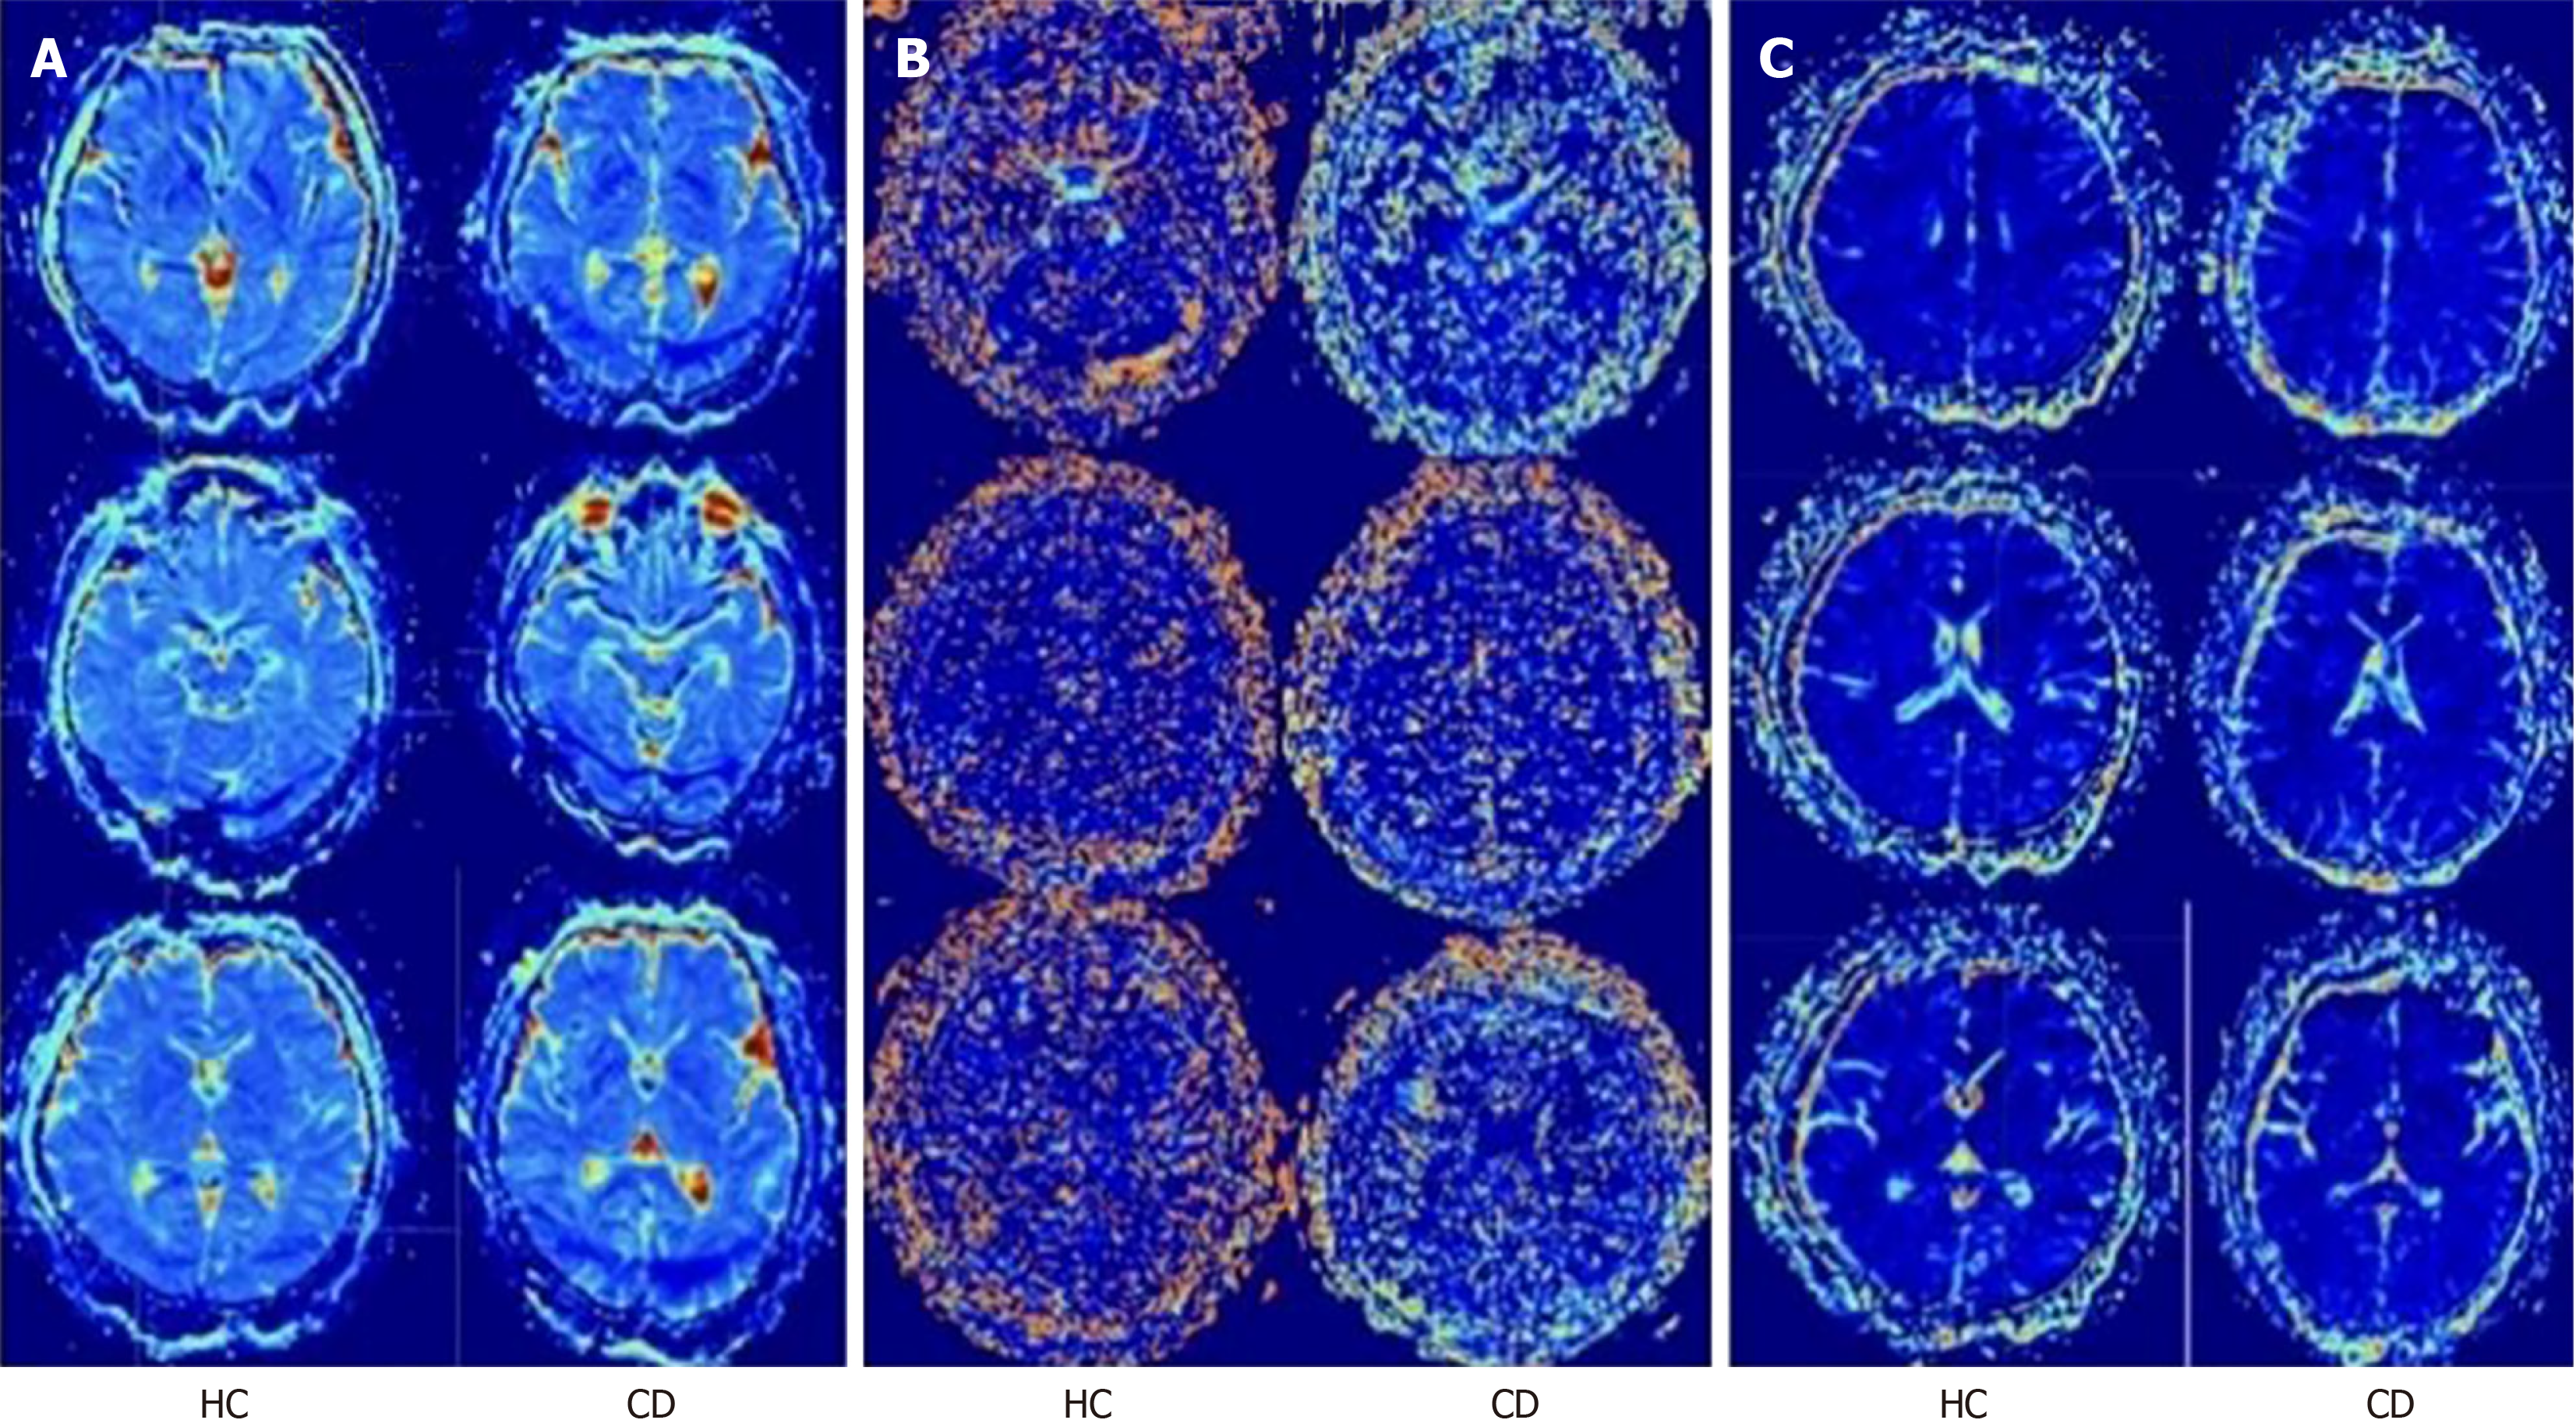
Figure 1 Intravoxel incoherent motion diffusion-weighted images from a 37-year-old man with Crohn’s disease and a 35-year-old healthy control man.
A: Slow apparent diffusion coefficient (ADCslow) map from biexponential fitting with 10 b-values. The left frontal ADCslow values were 0.000779326 in the healthy control (HC) group and 0.000832584 in the Crohn’s disease (CD) patients measured by SPM12. The color scale from blue to red represents the range of ADCslow values (0.000100-0.00250 × 10⁻³ mm2/second); B: Fast apparent diffusion coefficient (ADCfast) map from biexponential fitting with 10 b-values. The left frontal ADCfast values were 0.016722 in the HC group and 0.019411 in the CD patients measured by SPM12. The color scale from blue to red represents the range of ADCfast values (0.0100-0.0300 × 10⁻² mm2/seconds); C: Perfusion fraction (f) map from biexponential fitting with 10 b-values. The left frontal ADCfast values were 0.117279 in the HC group and 0.115245 in the CD patients measured by SPM12. The color scale from blue to red represents the range of f values (-0.180% to 0.266%). HC: Healthy control; CD: Crohn’s disease.
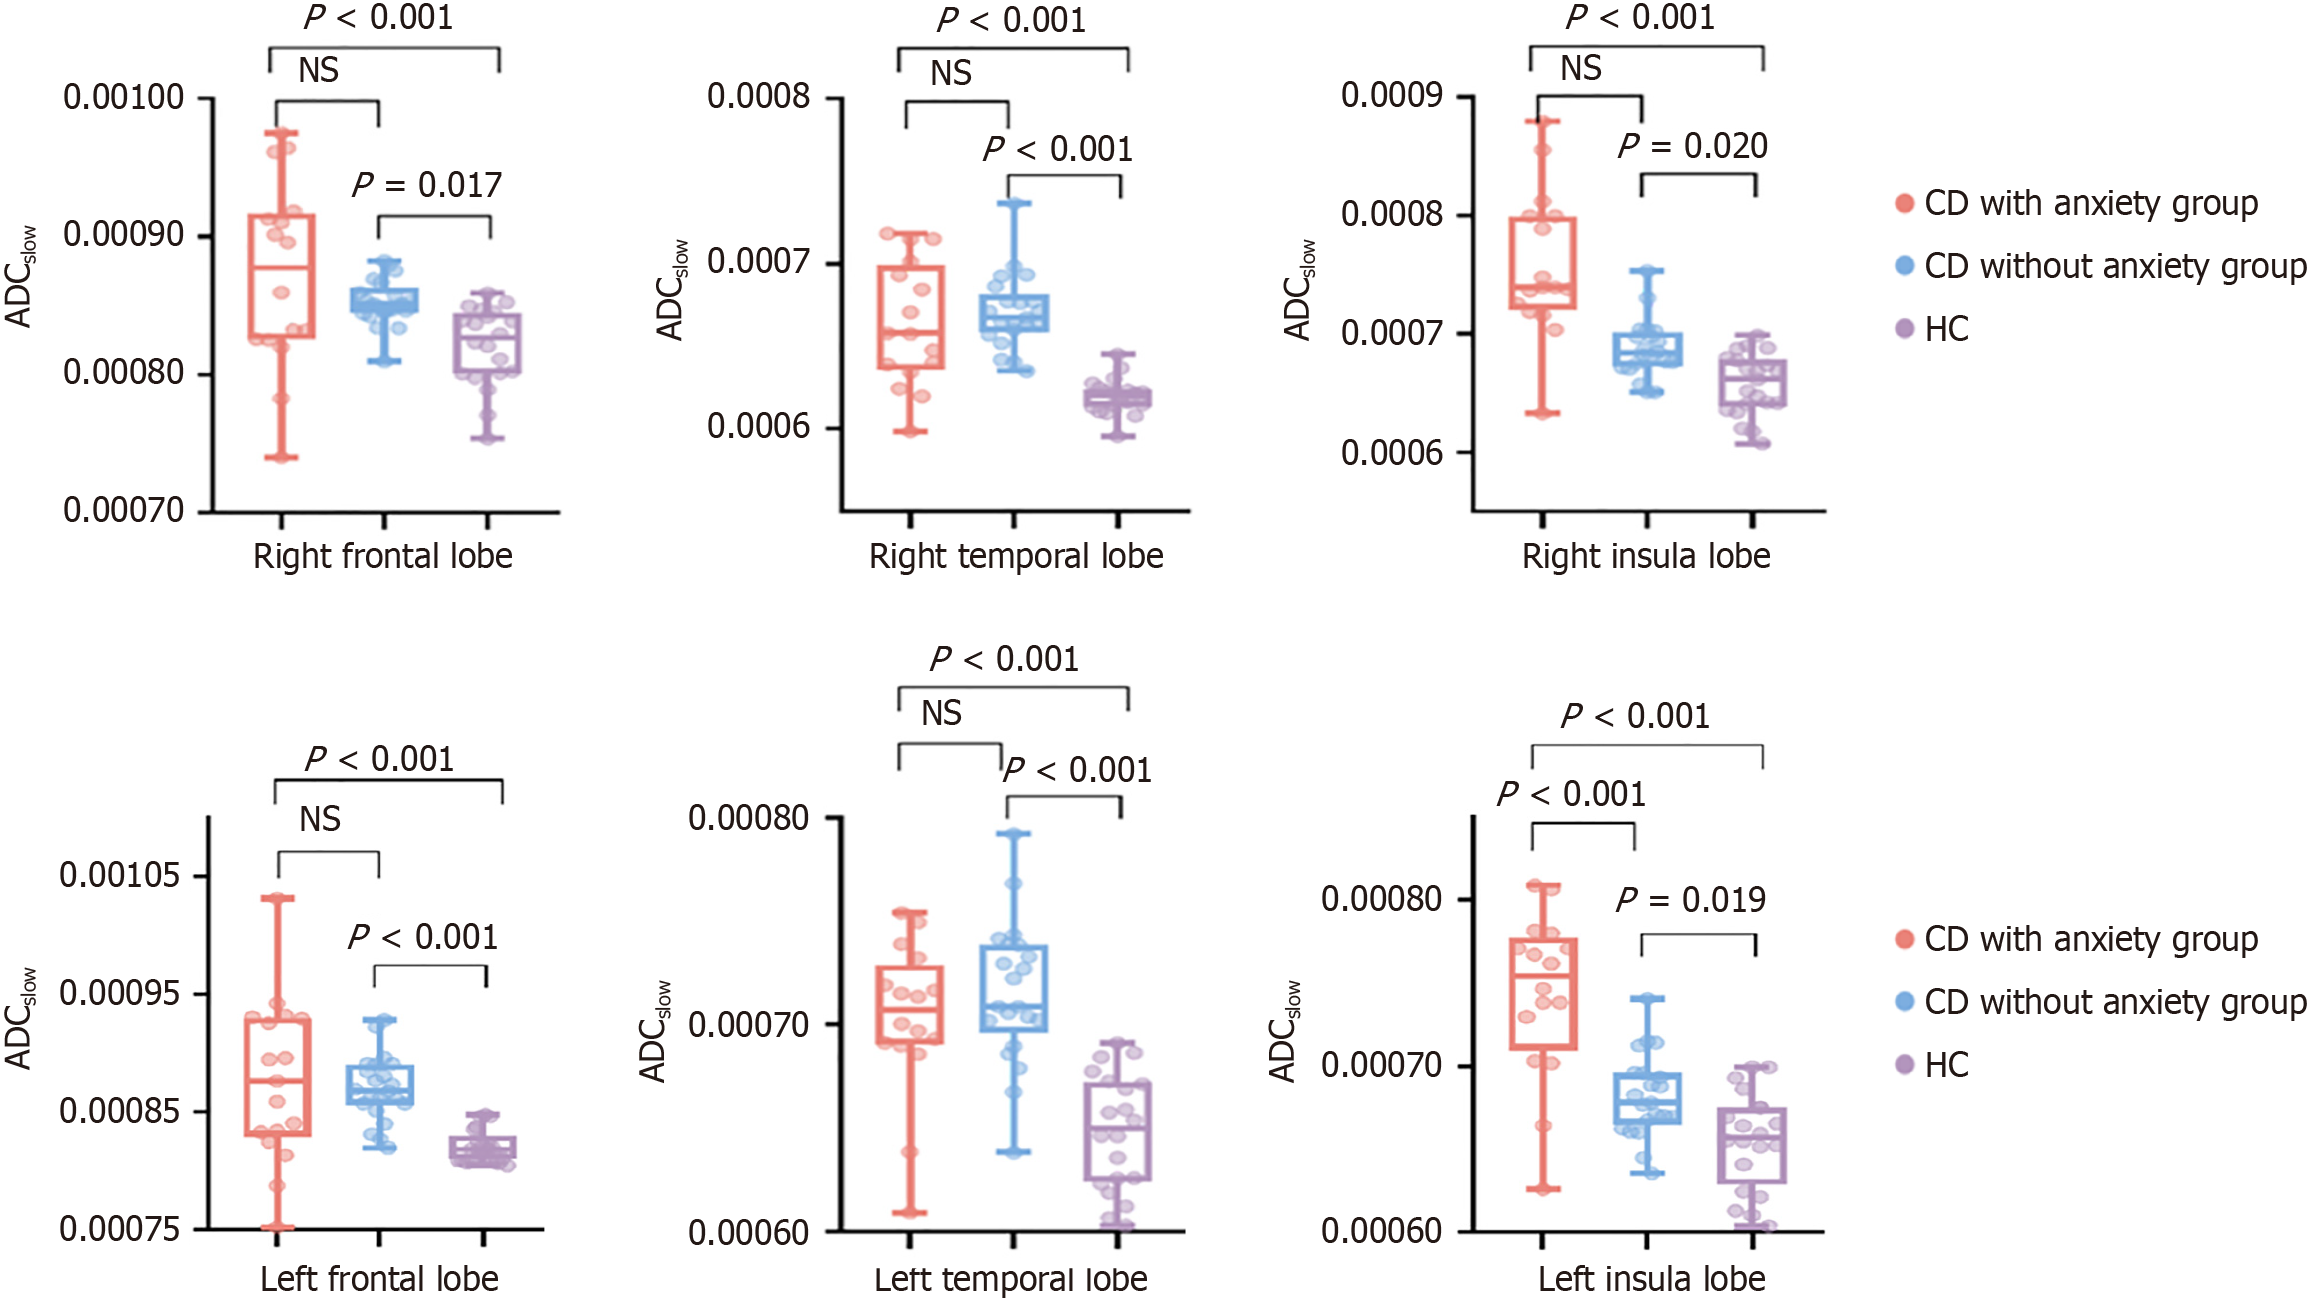
Figure 2 Differences in slow apparent diffusion coefficient values between Crohn’s disease patients with anxiety, Crohn’s disease patients without anxiety, and healthy control groups.
ADCslow: Slow apparent diffusion coefficient; CD: Crohn’s disease; HC: Healthy control; NS: Not statistically significant.
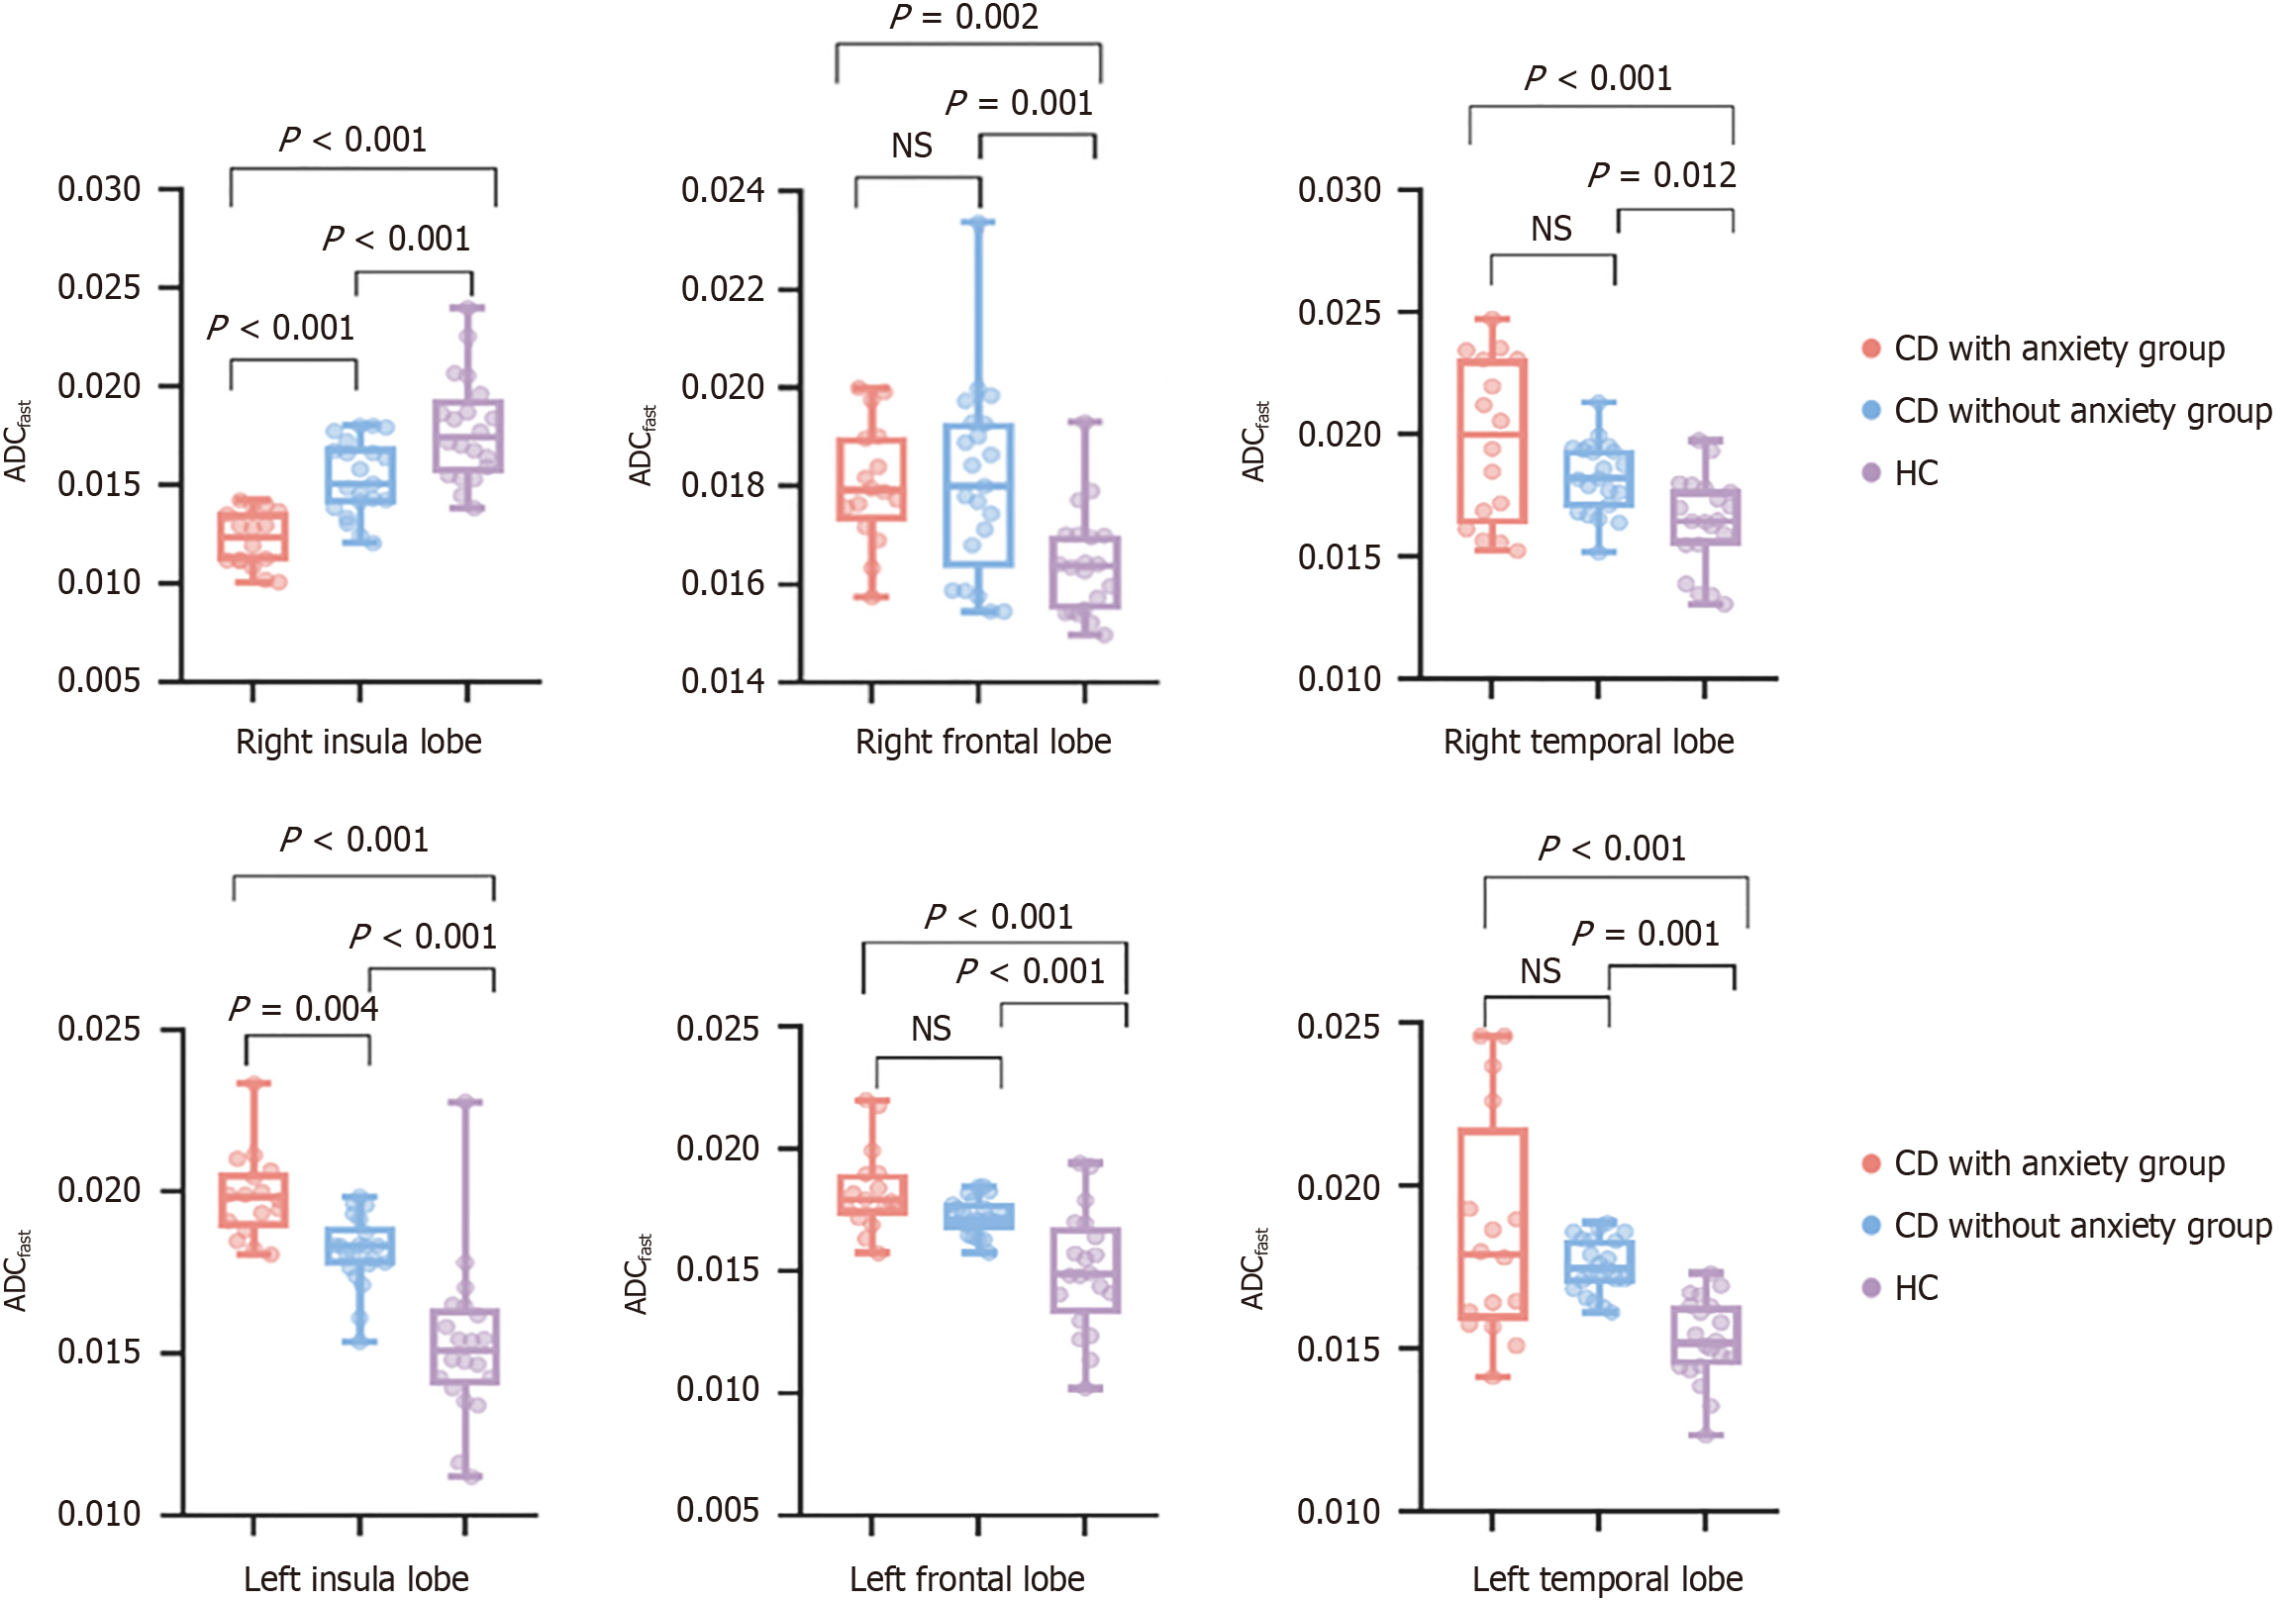
Figure 3 Differences in fast apparent diffusion coefficient values between Crohn’s disease patients with anxiety, Crohn’s disease patients without anxiety and healthy control groups.
ADCfast: Fast apparent diffusion coefficient; CD: Crohn’s disease; HC: Healthy control; NS: Not statistically significant.
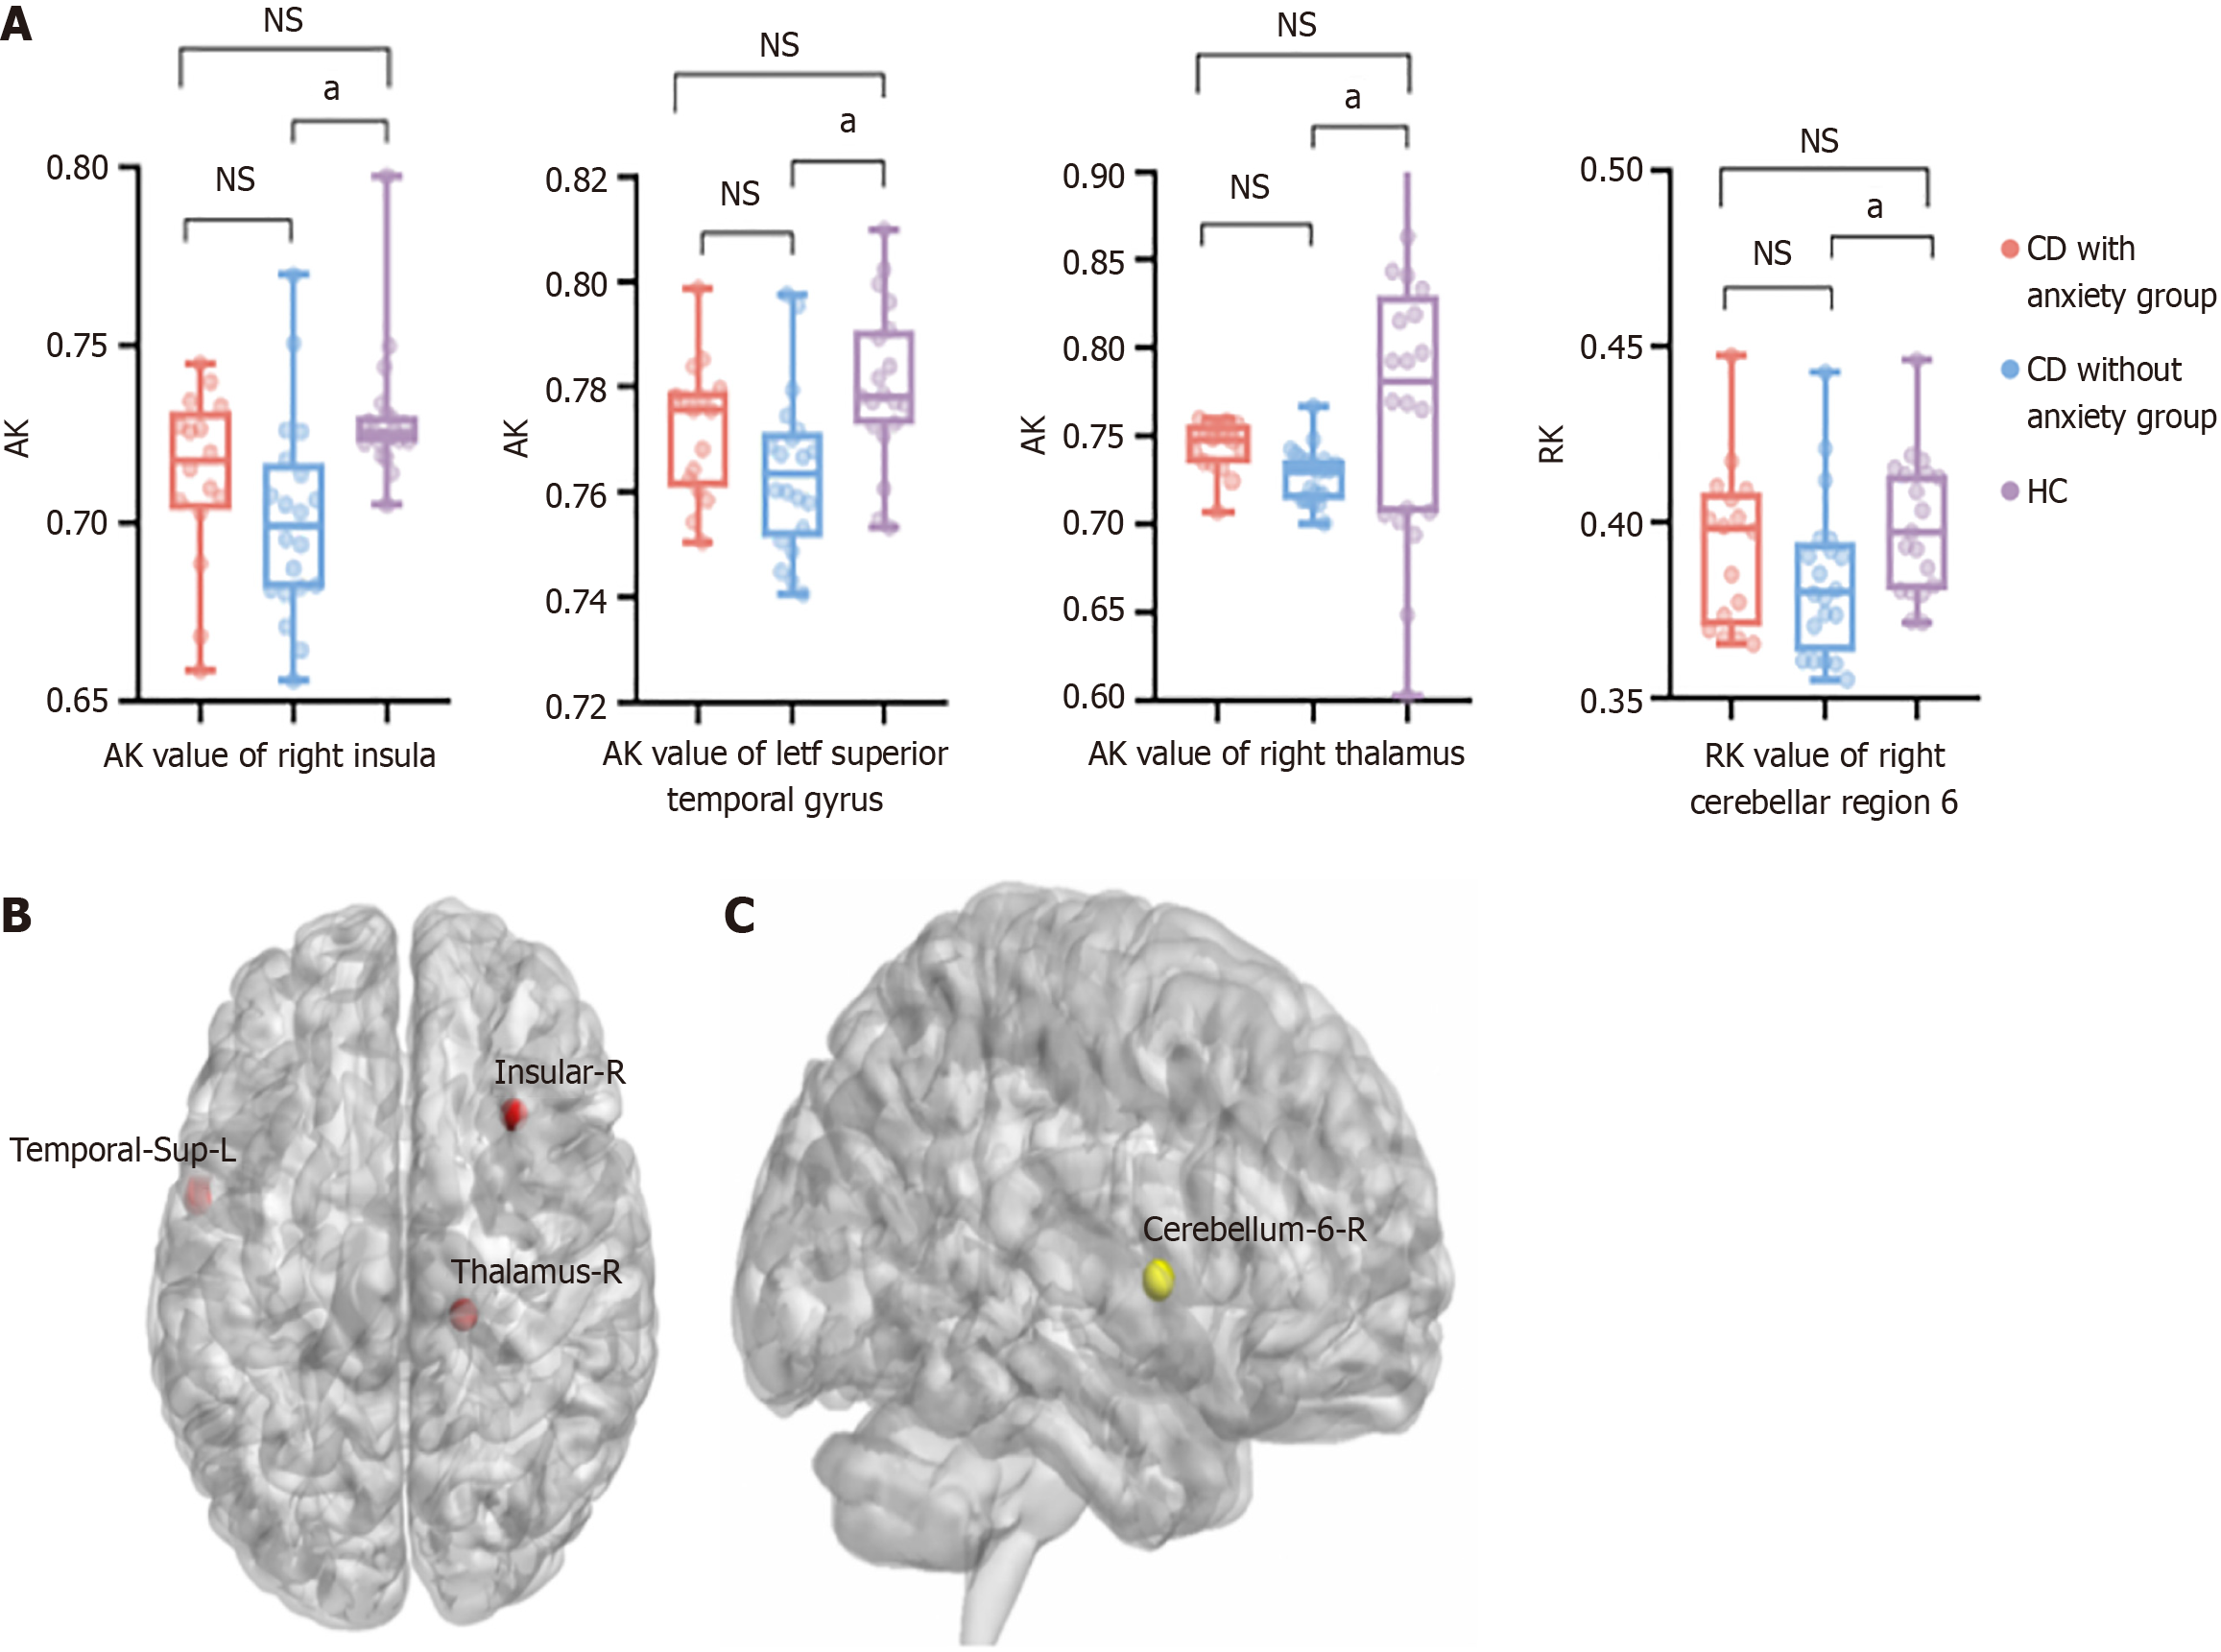
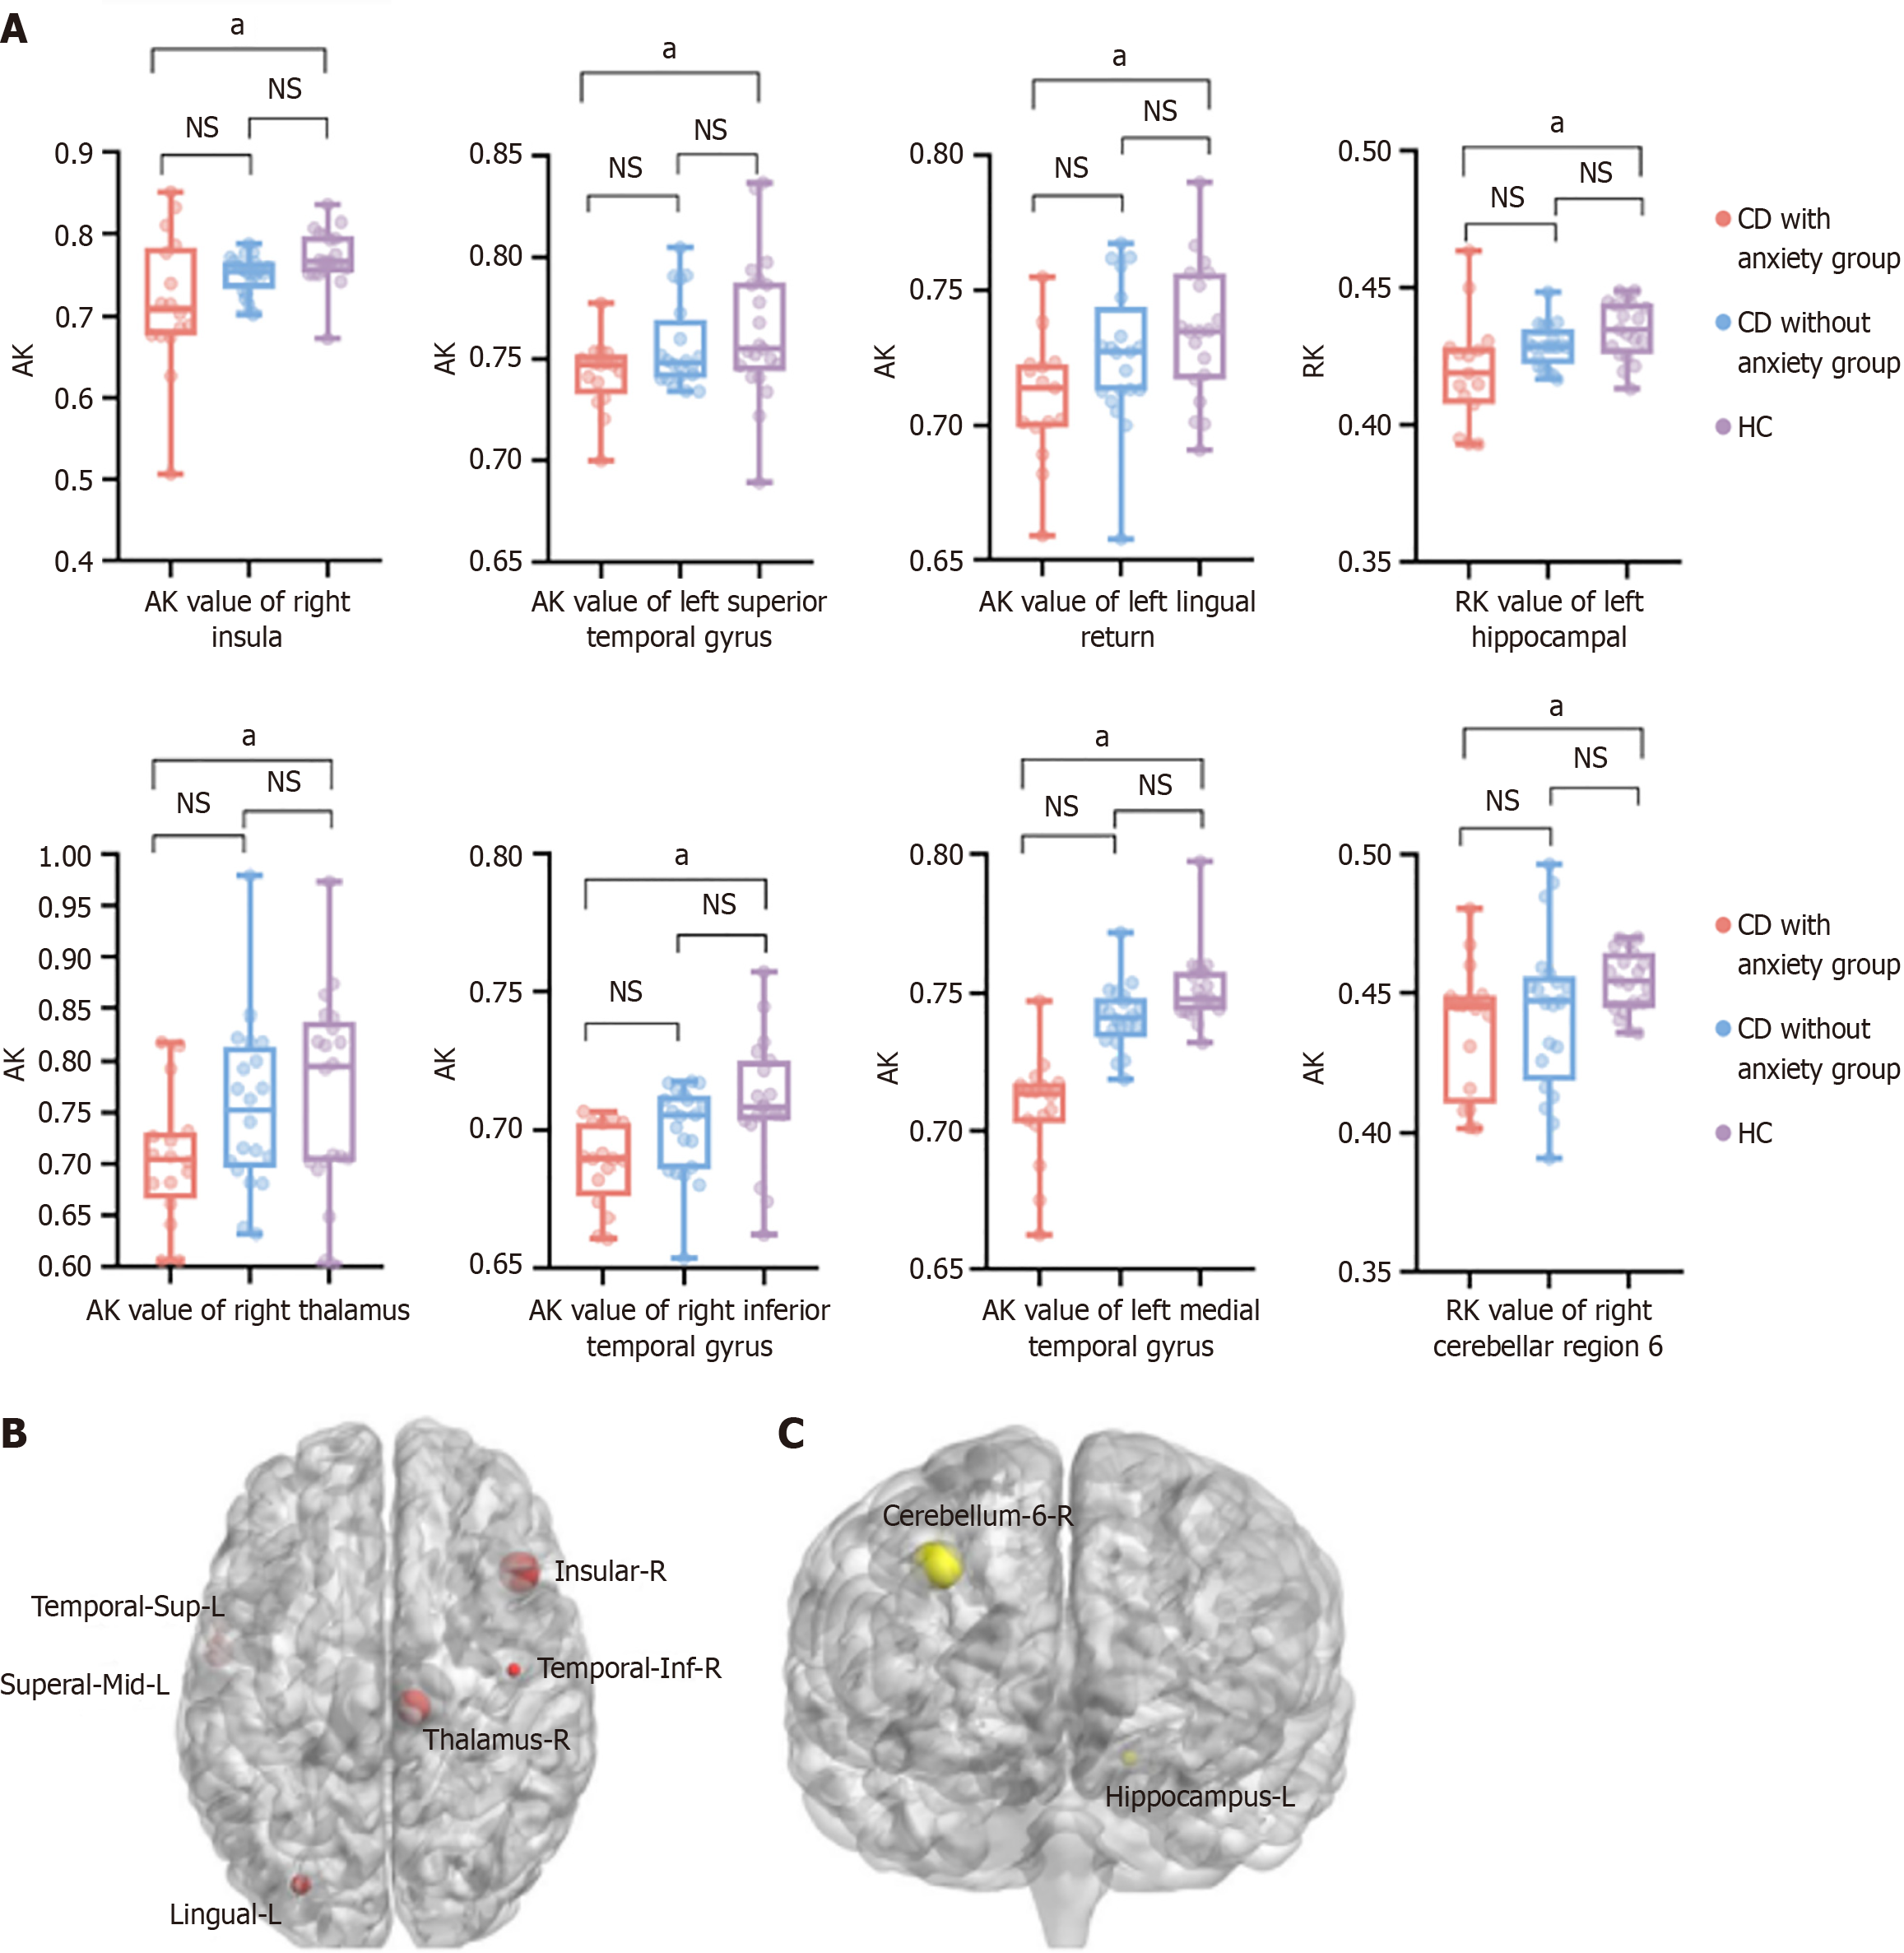
Figure 4 Brain regions with decreased diffusion kurtosis imaging parameters in Crohn’s disease patients without anxiety compared to healthy controls.
A: Comparison of the axial kurtosis (AK) and radial kurtosis (RK) values among patients without anxiety Crohn’s disease (CD), patients with anxiety CD, and healthy controls (HC); B: AK values of brain regions were significantly lower in patients with CD without anxiety compared with HC; C: RK values of brain regions were significantly lower in patients with CD without anxiety compared with HC. aP < 0.05; NS: Not statistically significant; CD: Crohn’s disease; HC: Healthy control; AK: Axial kurtosis.
Figure 5 Brain regions with decreased diffusion kurtosis imaging parameters in Crohn’s disease patients with anxiety compared to healthy controls.
A: Comparison of the axial kurtosis (AK) and radial kurtosis (RK) values among patients without anxiety Crohn’s disease (CD), patients with anxiety CD, and healthy controls (HC); B: AK values of brain regions were significantly lower in patients with CD without anxiety compared with HC; C: RK values of brain regions were significantly lower in patients with CD without anxiety compared with HC. aP < 0.05; NS: Not statistically significant; CD: Crohn’s disease; HC: Healthy control; AK: Axial kurtosis; RK: Radial kurtosis.
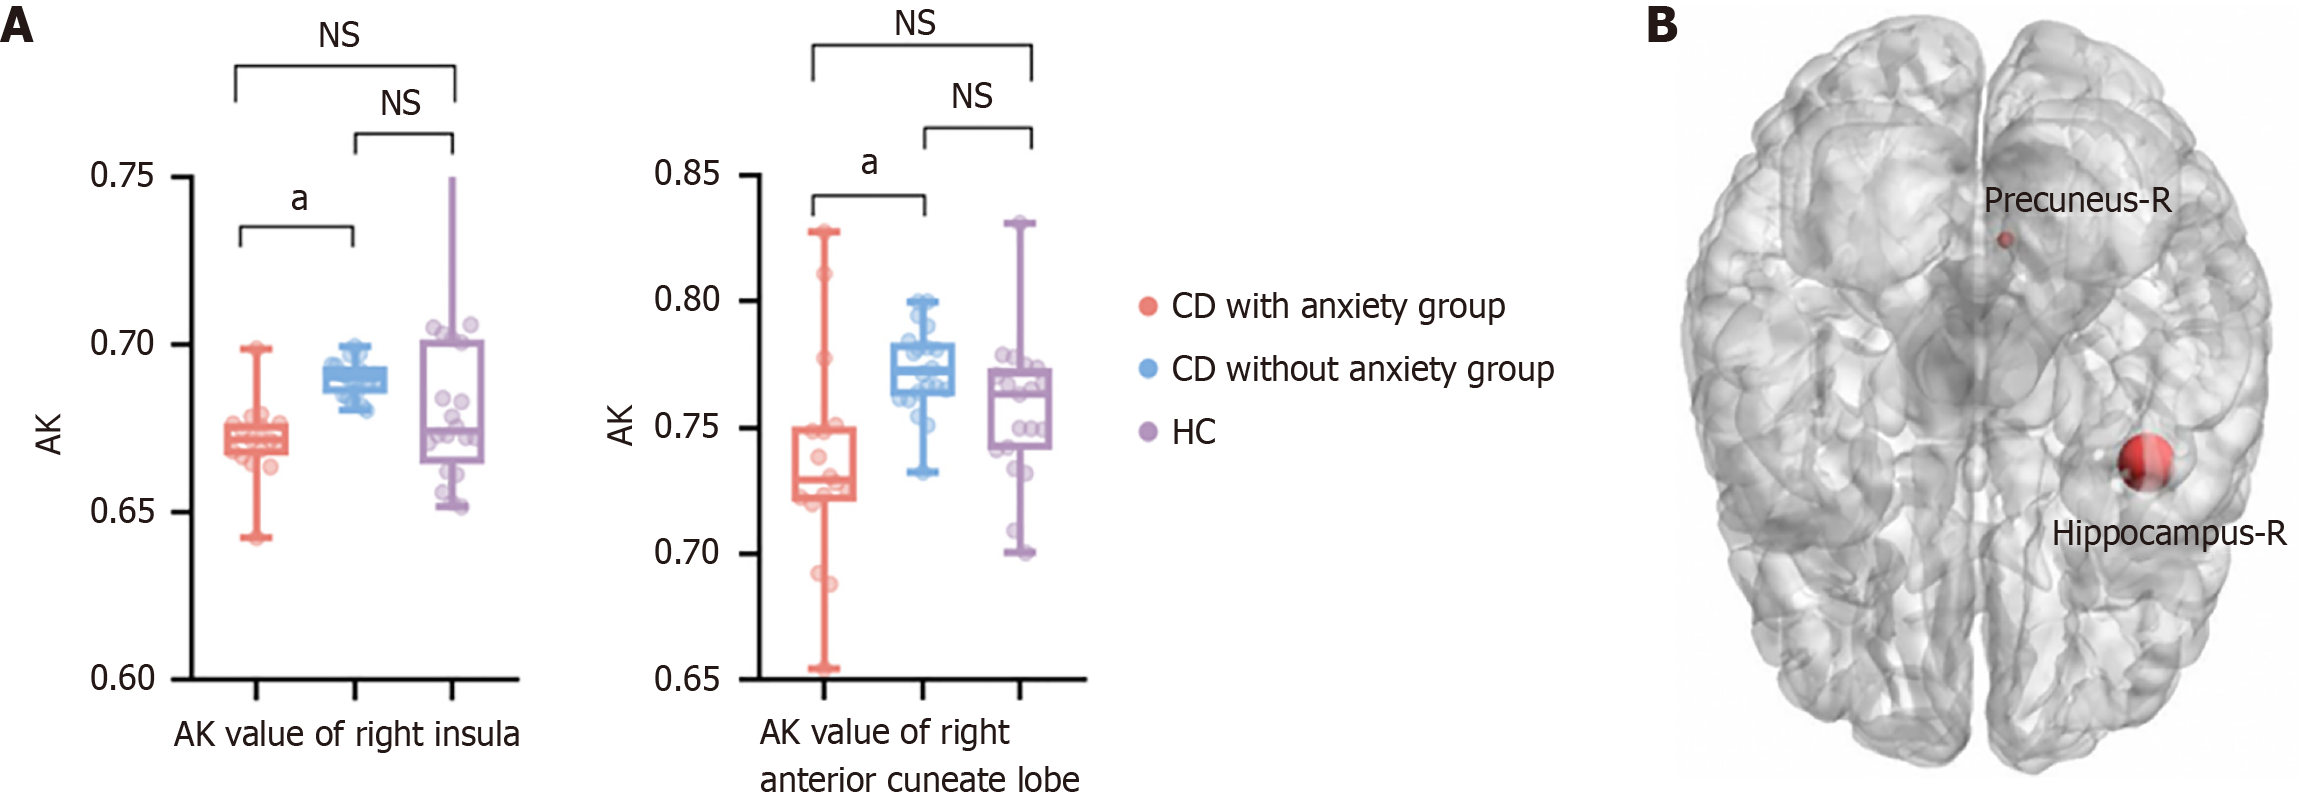
Figure 6 Brain regions with decreased diffusion kurtosis imaging parameters in Crohn’s disease patients with anxiety compared to Crohn’s disease patients without anxiety.
A: Comparison of diffusion kurtosis imaging parameters among patients without anxiety Crohn’s disease (CD), patients with anxiety CD, and healthy controls; B: Brain regions with decreased axial kurtosis value in patients without anxiety CD compared with those with anxiety CD. aP < 0.05; NS: Not statistically significant; CD: Crohn’s disease; HC: Healthy control; AK: Axial kurtosis; RK: Radial kurtosis.
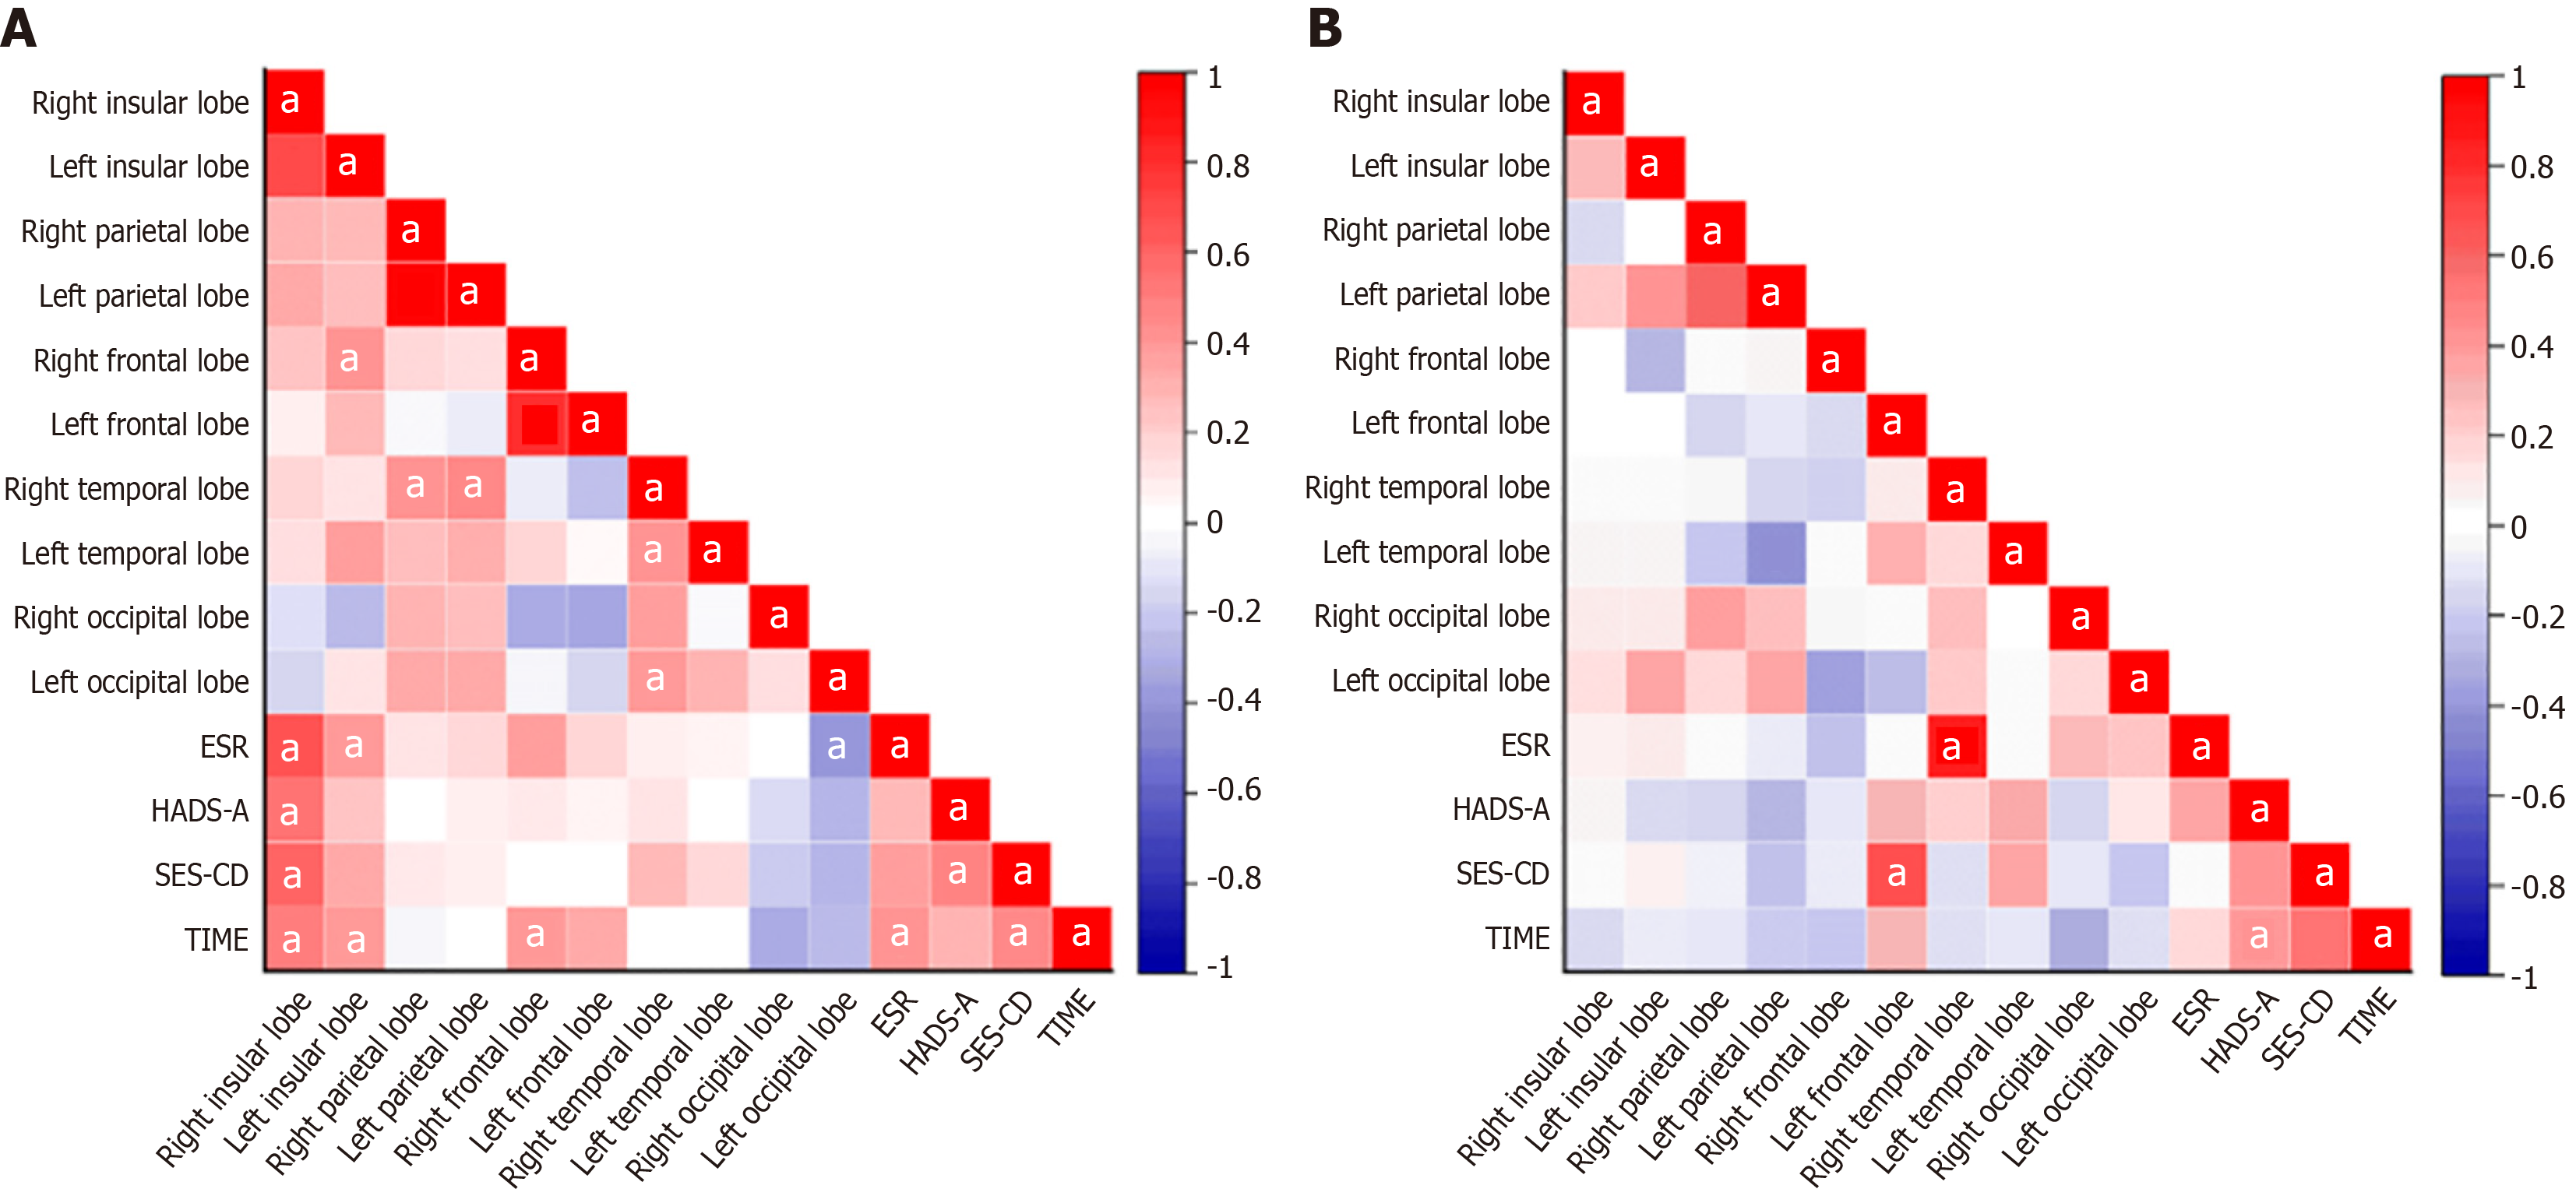
Figure 7 The correlation between intravoxel incoherent motion parameters and clinical features and psychological scores in patients with Crohn’s disease.
A: Slow apparent diffusion coefficient (ADCslow) values in various brain regions and clinical features and psychological scores in patients with Crohn’s disease (CD); B: The correlation between fast apparent diffusion coefficient (ADCfast) values in each brain region and clinical features and psychological scores in patients with CD. The color scale from blue to red represents the r value from -1 to 1. aP < 0.05; ESR: Erythrocyte sedimentation rate; HADS-A: Hospital Anxiety and Depression Scale, Anxiety subscale; SES-CD: Simplified endoscopic score for Crohn’s disease; TIME: Disease duration.
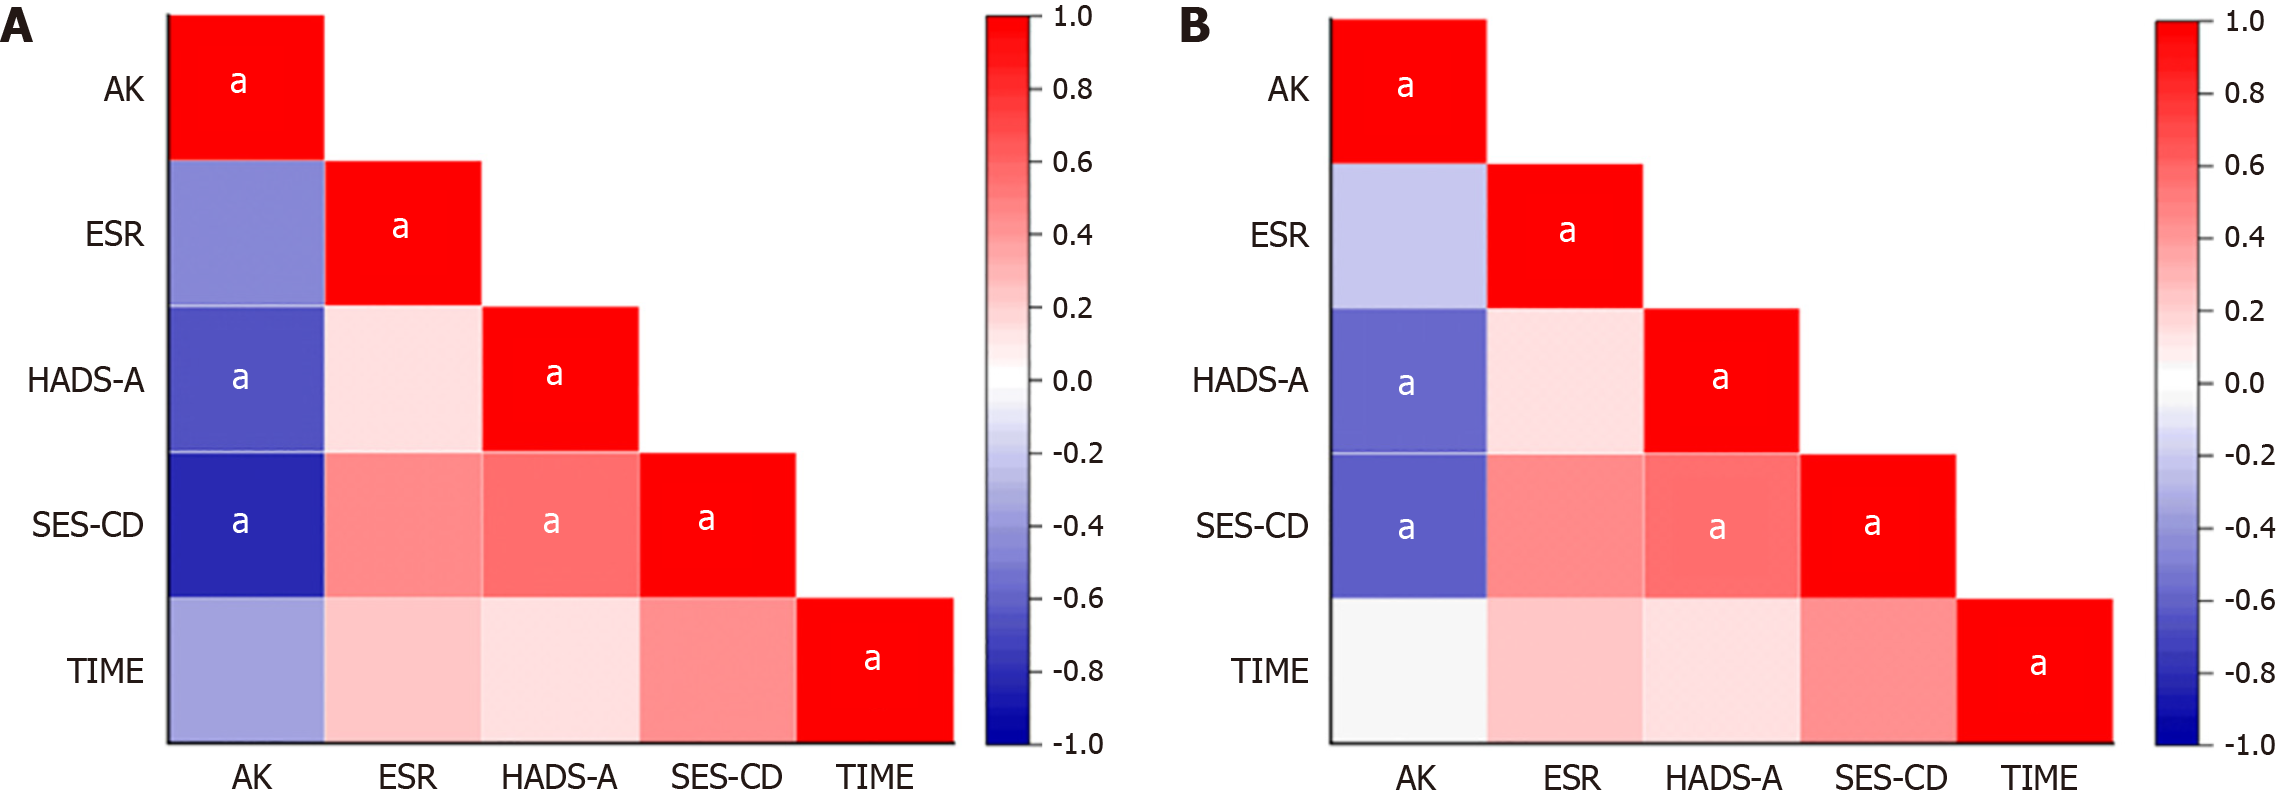
Figure 8 The correlation between diffusion kurtosis imaging parameters and clinical features and psychological scores in patients with Crohn’s disease.
A: The correlation between axial kurtosis (AK) values of the right insula and clinical features and psychological scores in patients with Crohn’s disease (CD); B: The correlation between AK values of the left superior temporal gyrus and clinical features and psychological scores in patients with CD. The color scale from blue to red represents the r value from -1 to 1. aP < 0.05; ESR: Erythrocyte sedimentation rate; HADS-A: Hospital Anxiety and Depression Scale, Anxiety subscale; SES-CD: Simplified endoscopic score for Crohn’s disease; TIME: Disease duration.
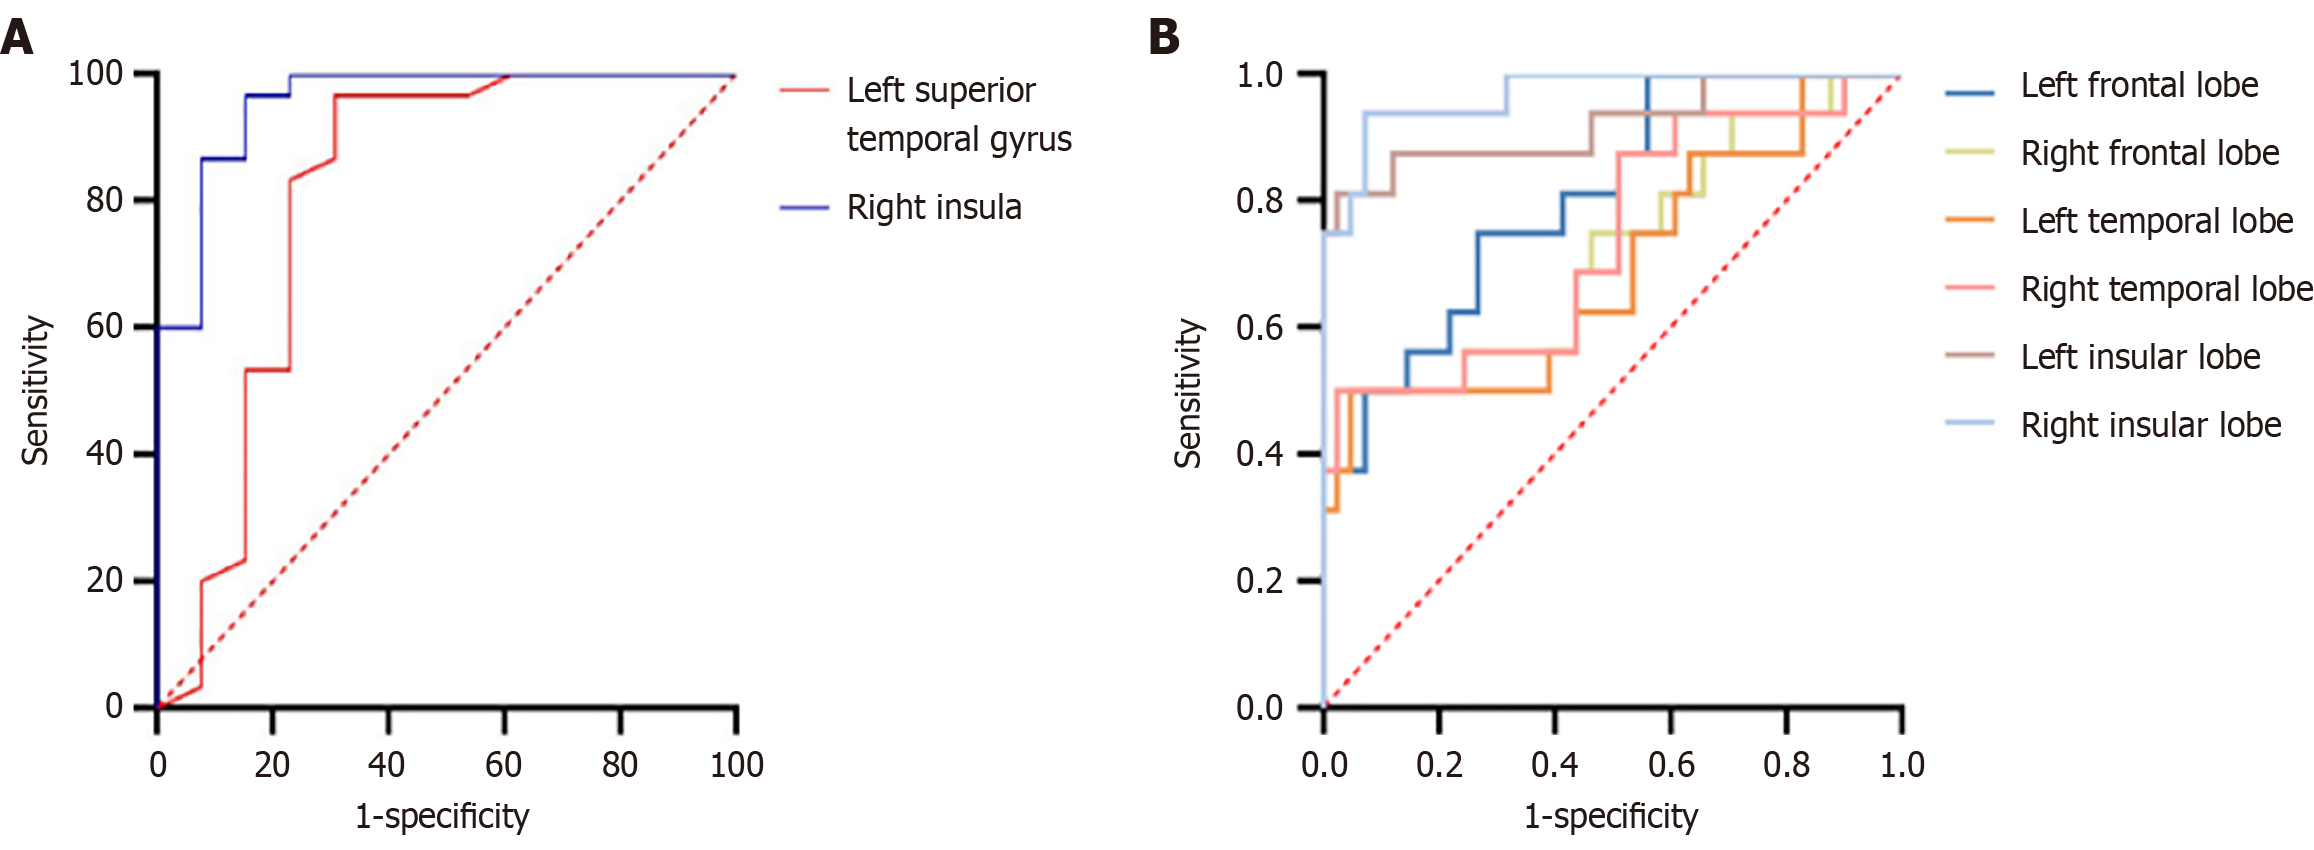
Figure 9 Receiver operating characteristic curves for diagnostic efficacy of diffusion kurtosis imaging parameters and intravoxel incoherent motion parameters in patients with Crohn’s disease who had anxiety.
A: The areas under the curve (AUC) for axial kurtosis values in the right insula and left superior temporal gyrus were 0.956 and 0.808, respectively; B: The receiver operating characteristic curves for slow apparent diffusion coefficient values and fast apparent diffusion coefficient values of the left frontal lobe, right frontal lobe, left temporal lobe, right temporal lobe, left insular lobe, and right insular lobe demonstrated AUC of 0.806, 0.718, 0.692, 0.736, 0.921, and 0.968 respectively.
- Citation: Yue KC, Zhu YY, Sun JW, Wu XT, Liu WJ, Shi HF. Imaging characteristics of brain microstructure and cerebral perfusion in Crohn’s disease patients with anxiety: A prospective comparative study. World J Gastroenterol 2025; 31(4): 99014
- URL: https://www.wjgnet.com/1007-9327/full/v31/i4/99014.htm
- DOI: https://dx.doi.org/10.3748/wjg.v31.i4.99014


