Copyright
©The Author(s) 2025.
World J Gastroenterol. Jan 28, 2025; 31(4): 93179
Published online Jan 28, 2025. doi: 10.3748/wjg.v31.i4.93179
Published online Jan 28, 2025. doi: 10.3748/wjg.v31.i4.93179
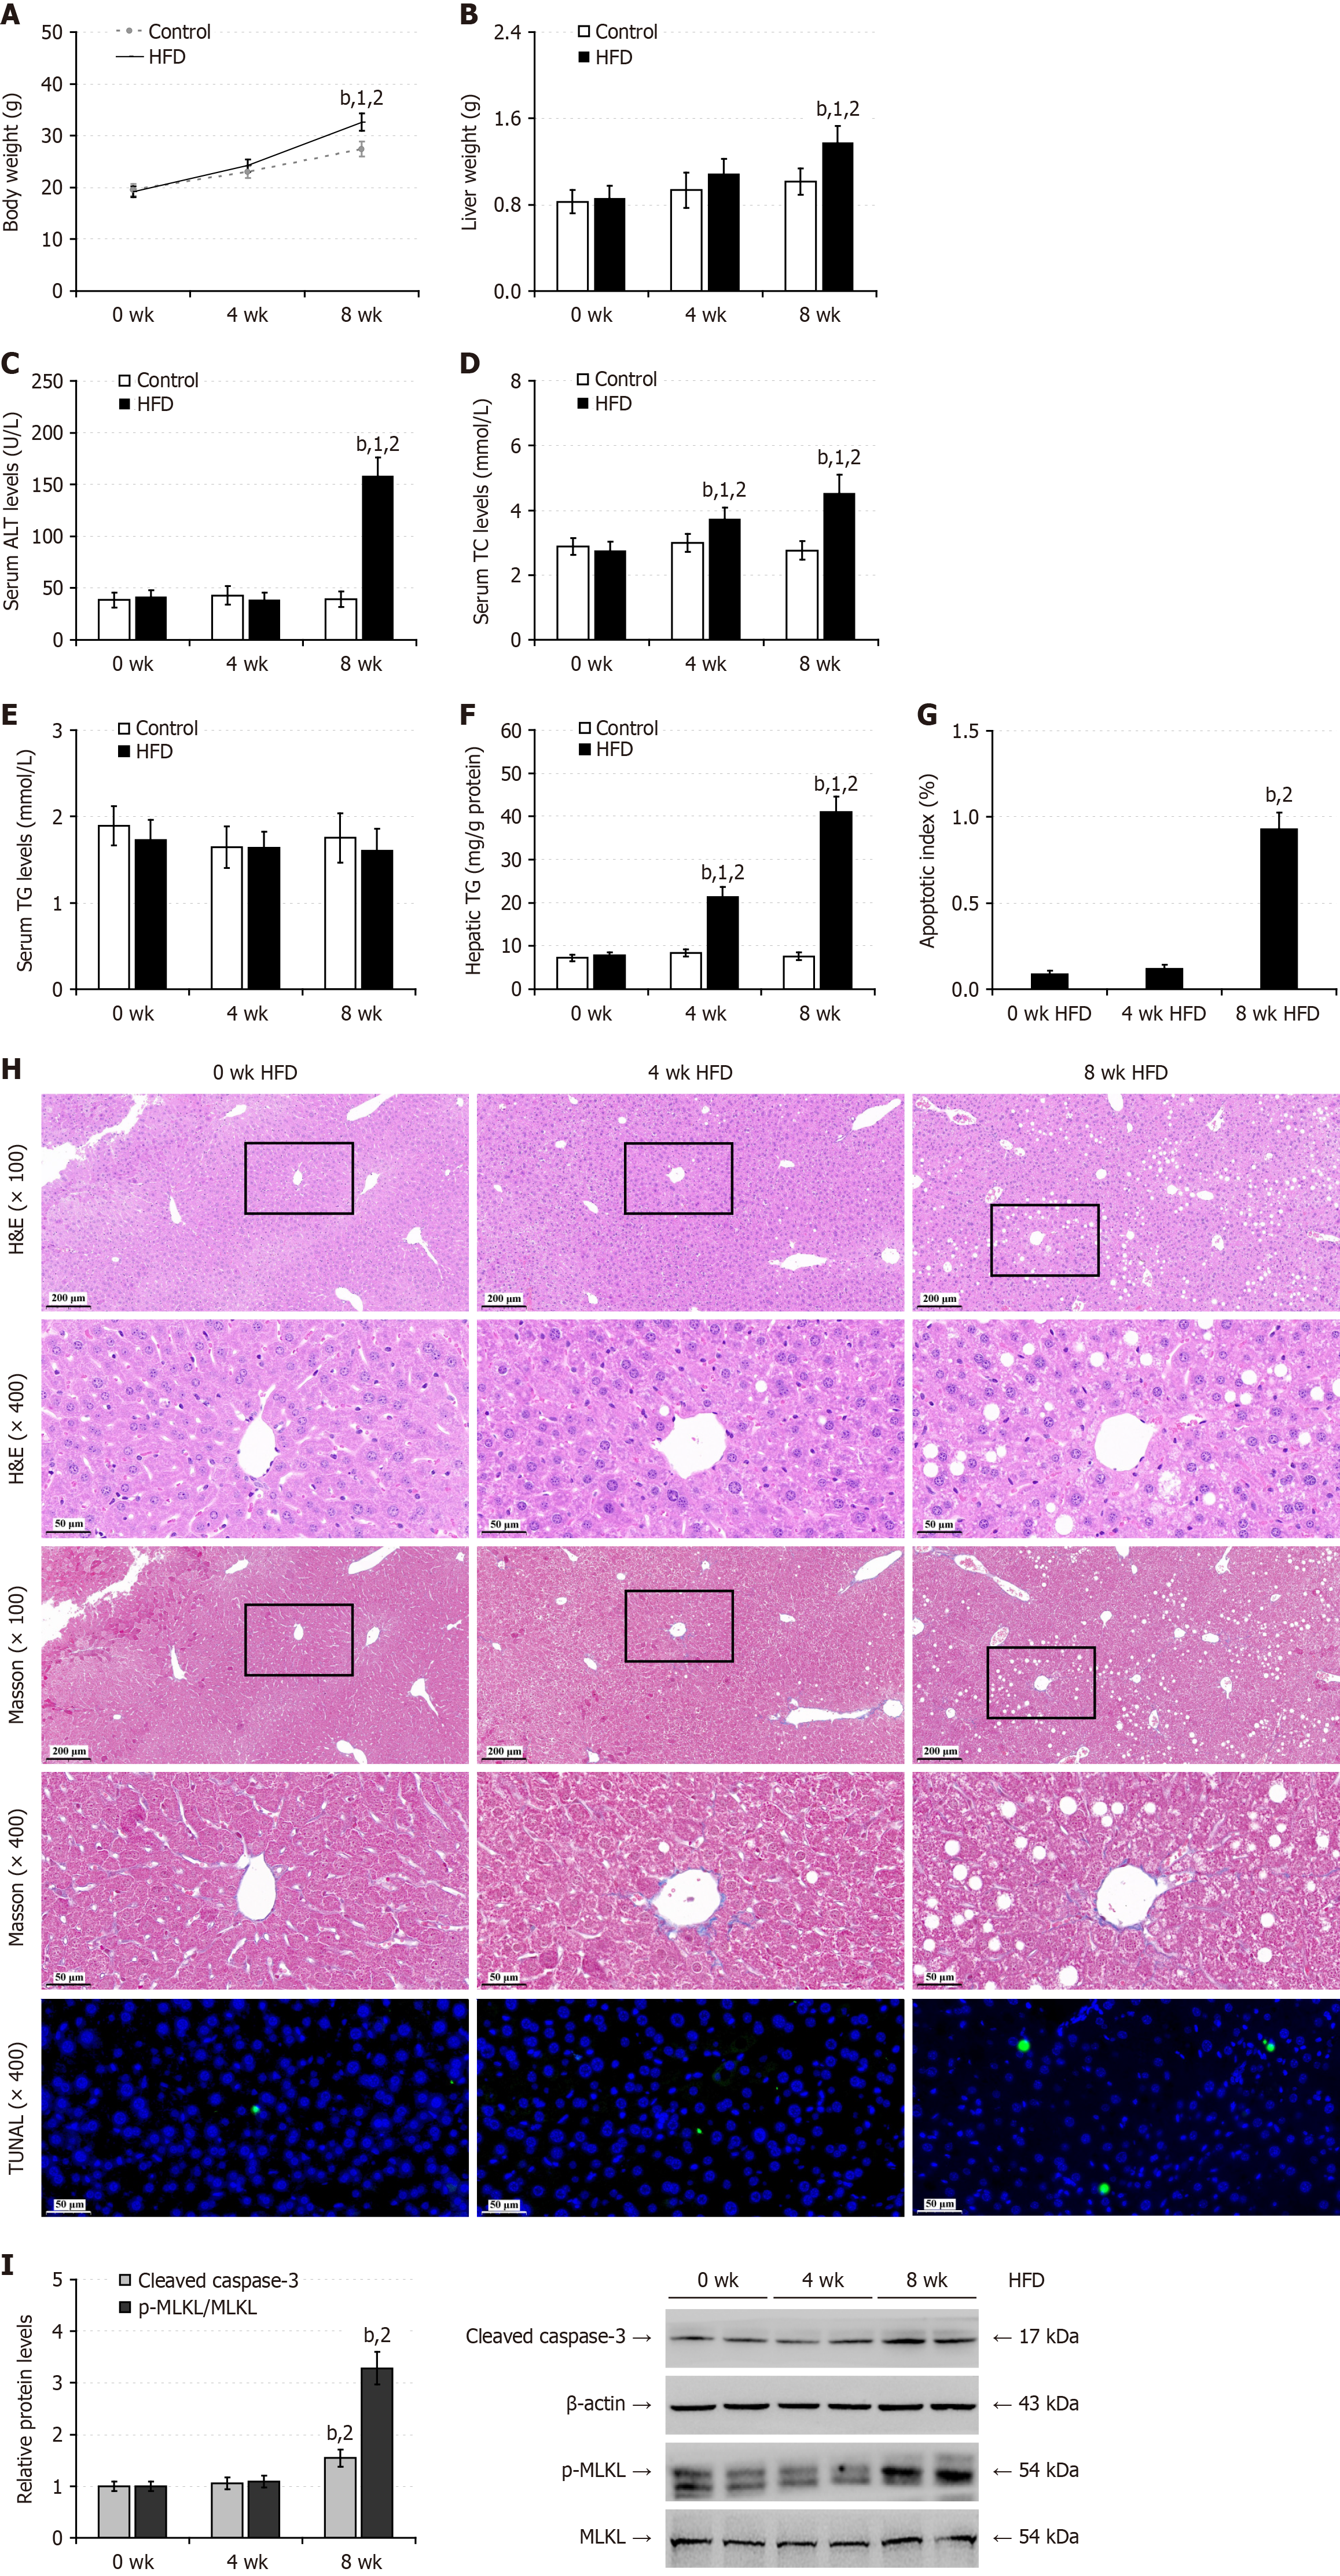
Figure 1 High-fat-diet feeding induces hepatic steatosis in mice.
Male C57BL/6 mice were fed with normal chow (control) or high-fat-diet (60% fat, 20% carbohydrates, 20% protein) for 0, 4, or 8 weeks (n = 12; 72 mice in total), and their body weights were measured and their fasting serum samples were prepared. A: Body weights; B: Liver weights; C: The levels of serum alanine aminotransferase; D: The levels of serum total cholesterol; E: The levels of serum triglycerides (TG); F: Intrahepatic TG contents; G: Apoptosis index; H: Hematoxylin and eosin, Masson and transferase-mediated deoxyuridine triphosphate-nick end labeling (TUNEL) staining of liver tissue sections; I: Western blot analysis of cleaved caspase-3 and mixed lineage kinase domain-like protein phosphorylation. Data are representative images or expressed as the mean ± SD of each group of mice from at least three separate experiments. bP < 0.01. 1P < 0.01 vs the control group. 2P < 0.01 vs the 0 weeks group. HFD: High-fat-diet; ALT: Alanine aminotransferase; TC: Total cholesterol; TG: Triglycerides; HE: Hematoxylin and eosin; MLKL: Mixed lineage kinase domain-like protein; TUNEL: Transferase-mediated deoxyuridine triphosphate-nick end labeling; wk: Week.
Figure 2 Lipid metabolism remodeling, and nuclear factor kappa B p65/hepatocyte nuclear factor-1 alpha signaling damage in mouse liver with steatosis.
Liver lipids were extracted from the control and high-fat-diet-fed mice and subjected to liposome analyses using extensive targeted lipidomics techniques. The underlying causes of lipid metabolism remodeling and validation of differential lipid biological functions were explored. A: A scatter plot of differential lipids; B: Z-value plot of differential lipids; C: The number of triglycerides with average carbon atom and double bonds; D: Differential abundance scores of the sphingolipid metabolism pathway. The size of the circles represents the number of differential lipid species; E: Differential abundance scores of phosphatidylcholine, phosphatidylinositol and reduced coenzyme Q10; F: Hepatic malondialdehyde levels; G: Hepatic reduced glutathione levels; H: Transmission electron microscopy analysis of liver tissue ultrastructure; I: Western blot analysis of the relative levels of lipid metabolism-related protein expression; J: Western blot analysis of nuclear factor kappa B p65, and hepatocyte nuclear factor-1 alpha protein expression; K: Western blot analysis of endoplasmic reticulum stress-related protein expression levels. Data are representative images or expressed as the mean ± SD of each group (n = 10-12) of mice from at least three separate experiments. bP < 0.01. 1P < 0.01 vs the corresponding control or total triglycerides group. 2P < 0.01 vs the 0-week group. HFD: High-fat-diet; TG: Triglycerides; SM: Sphingomyelin; Cer: Ceramide; SPH: Sphingosine; PC: Phosphatidylcholine; PI: Phosphatidylinositol; CoQ10: Reduced coenzyme Q10; ER: Endoplasmic reticulum; L: Lipid droplet; M: Mitochondria; N: Nucleus; VIP: Variable importance in projection; wk: Week; SREBP1c: Cleaved sterol regulatory element-binding protein 1; MTP: Microsomal triglyceride transfer protein; MCAD: Medium-chain acyl-CoA dehydrogenase; GPX4: Glutathione peroxidase 4; HNF1α: Hepatocyte nuclear factor-1 alpha; GRP78: 78-kDa glucose-regulated protein; CHOP: CCAAT-enhancer-binding protein homologous protein; HRD1: 3-hydroxy-3-methyl glutaryl coenzyme A reductase degradation 1 homolog; ATF4: Activating transcription factor 4; RelA: Nuclear factor kappa B p65.
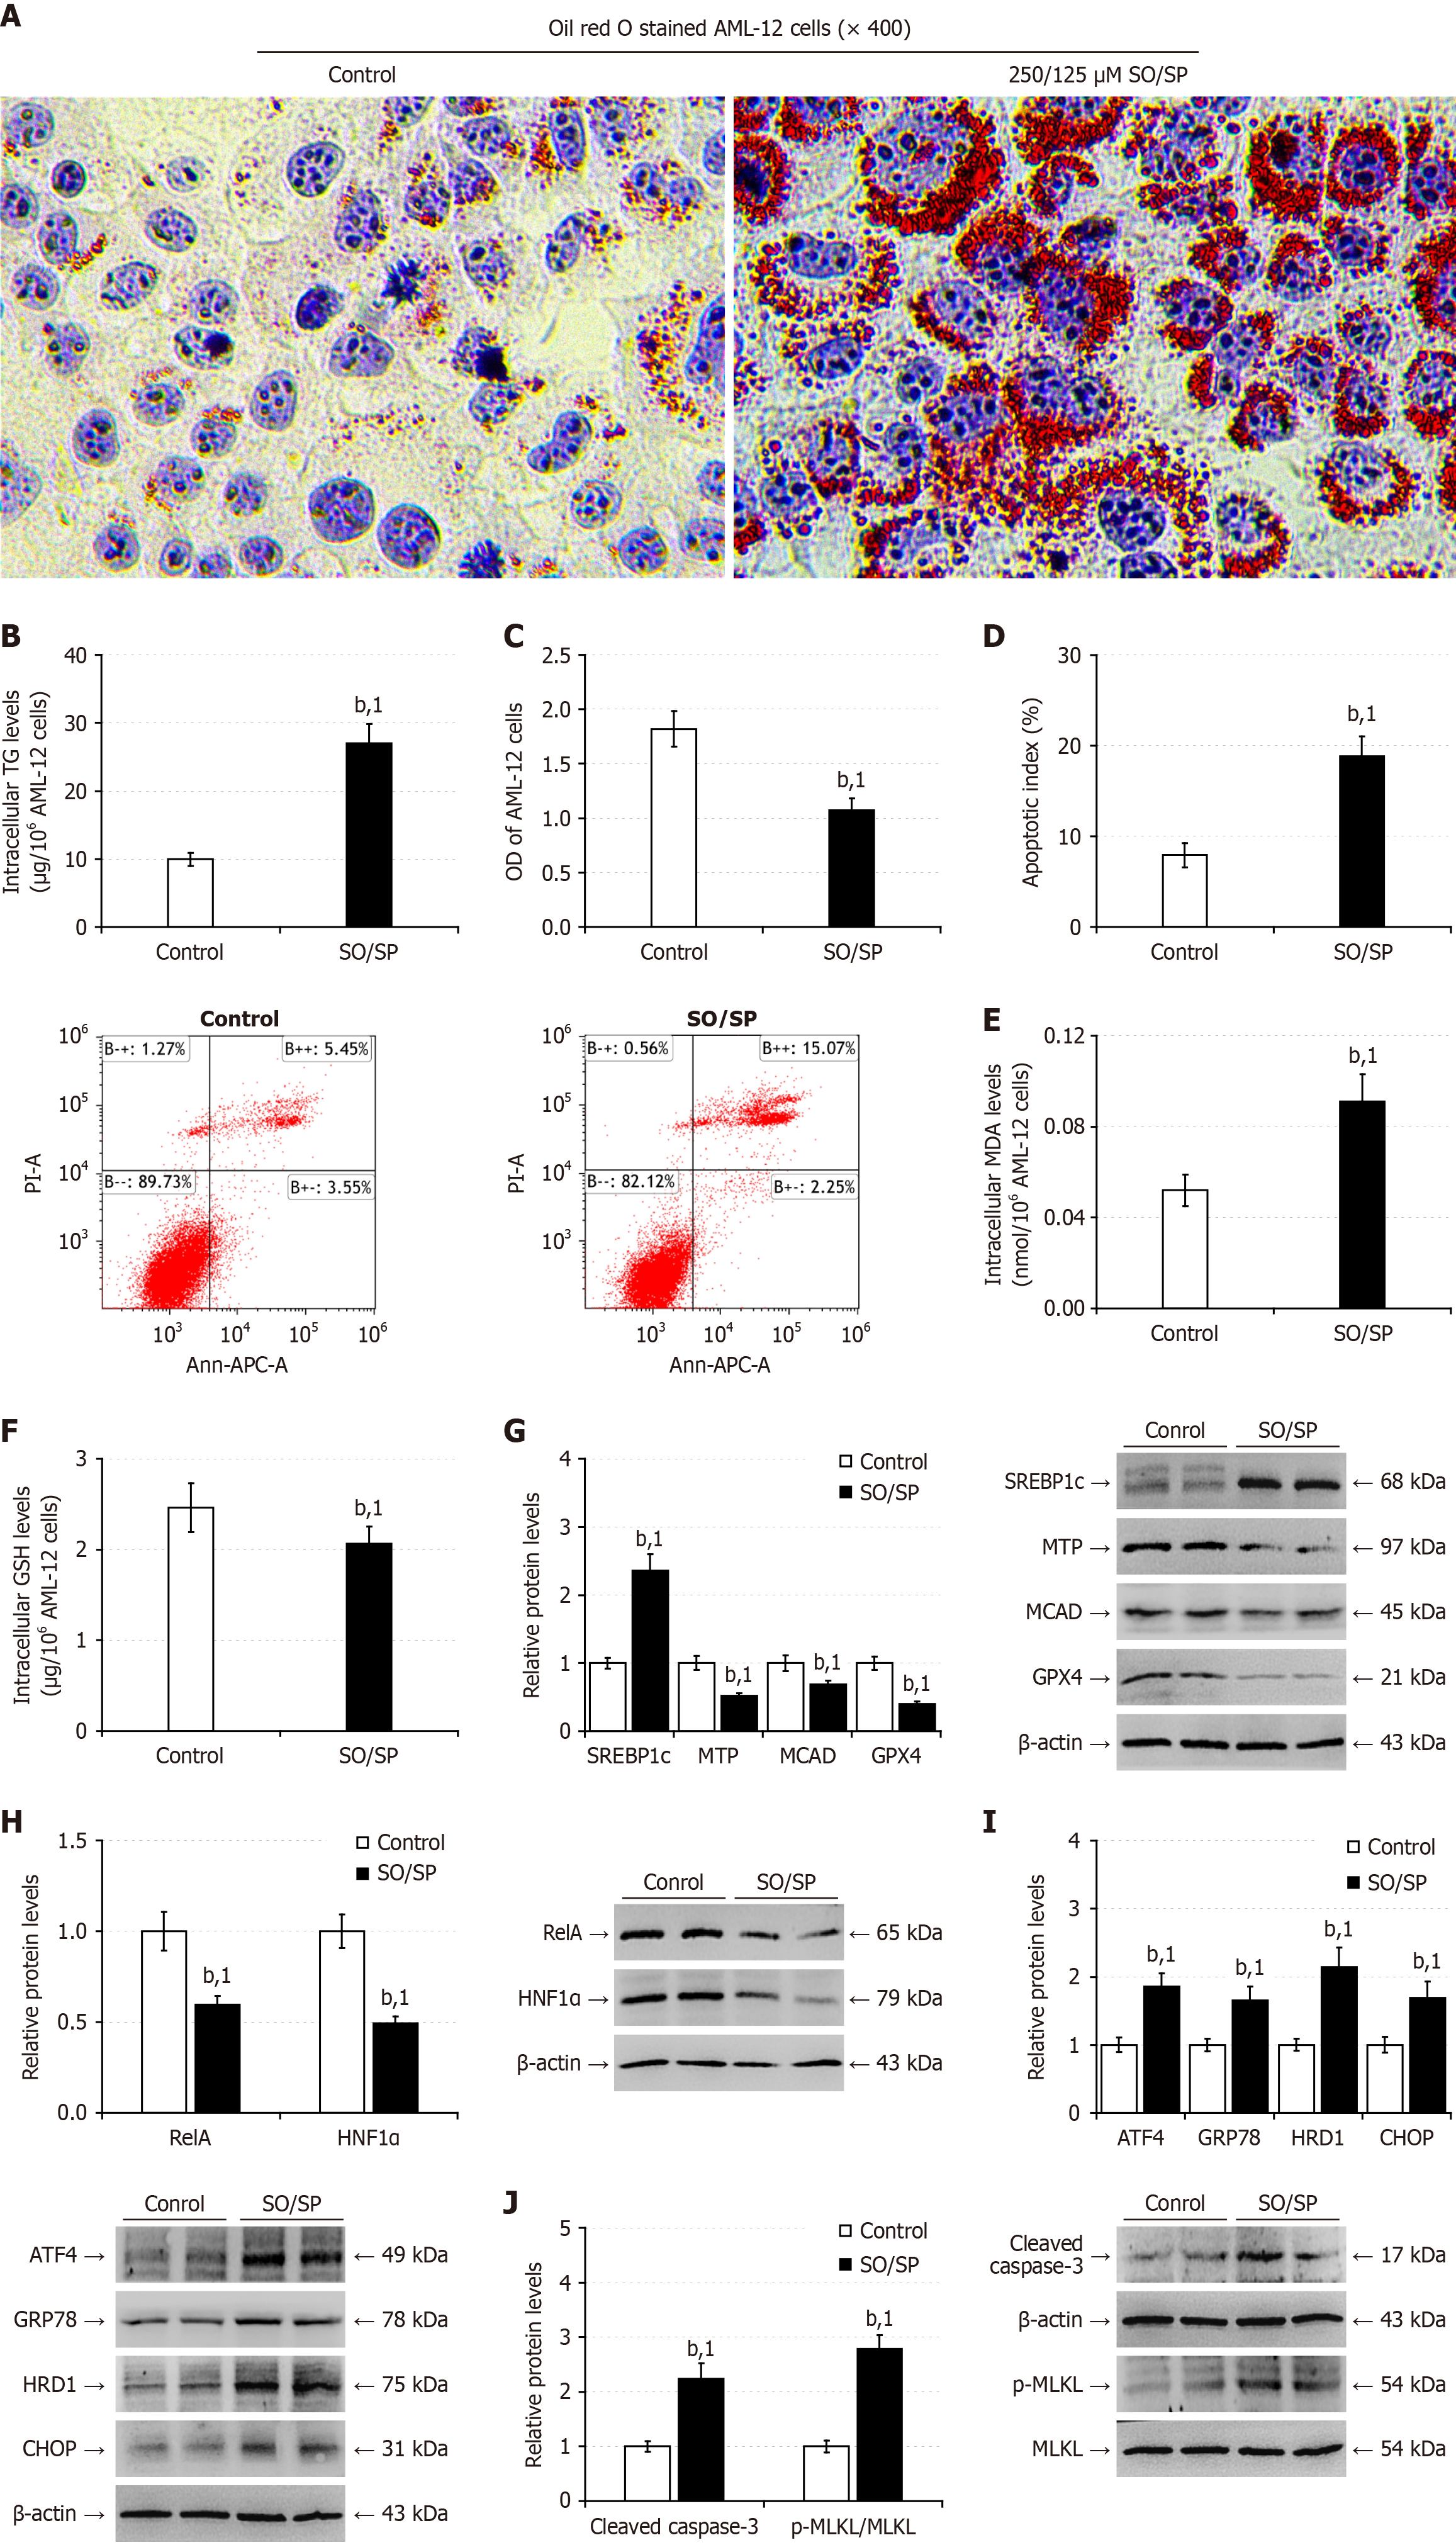
Figure 3 Stimulation with sodium oleate/sodium palmitate induces steatosis, and impairs nuclear factor kappa B p65/hepatocyte nuclear factor-1 alpha signaling in AML-12 cells.
AML-12 cells were stimulated in triplicate with control bovine serum albumin, 250/125 μmol/L sodium oleate/sodium palmitate for 48 hours. A: Oil red O staining of lipids; B: Intracellular triglycerides content; C: Cell counting kit-8 analysis of cell viability; D: Flow cytometry analysis of the frequency of apoptotic cells; E: Intracellular malondialdehyde levels; F: Reduced glutathione levels; G: Western blot analysis of the relative levels of lipid metabolism-related protein expression; H: Western blot analysis of the relative levels of nuclear factor kappa B p65 and hepatocyte nuclear factor-1 alpha expression; I: Western blot analysis of the relative levels of endoplasmic reticulum stress-related protein expression; J: Western blot analysis of the relative levels of apoptosis-, and necroptosis-related protein expression. Data are representative images or expressed as the mean ± SD of each group from three separate experiments. bP < 0.01. 1P < 0.01 vs the respective control group. SO/SP: Sodium oleate/sodium palmitate; TG: Triglycerides; MDA: Malondialdehyde; GSH: Glutathione; APC: Allophycocyanin conjugate; MLKL: Mixed lineage kinase domain-like protein; SREBP1c: Cleaved sterol regulatory element-binding protein 1; TG: Triglycerides; MTP: Microsomal triglyceride transfer protein; MCAD: Medium-chain acyl-CoA dehydrogenase; GPX4: Glutathione peroxidase 4; HNF1α: Hepatocyte nuclear factor-1 alpha; GRP78: 78-kDa glucose-regulated protein; CHOP: CCAAT-enhancer-binding protein homologous protein; HRD1: 3-hydroxy-3-methyl glutaryl coenzyme A reductase degradation 1 homolog; ATF4: Activating transcription factor 4; RelA: Nuclear factor kappa B p65.
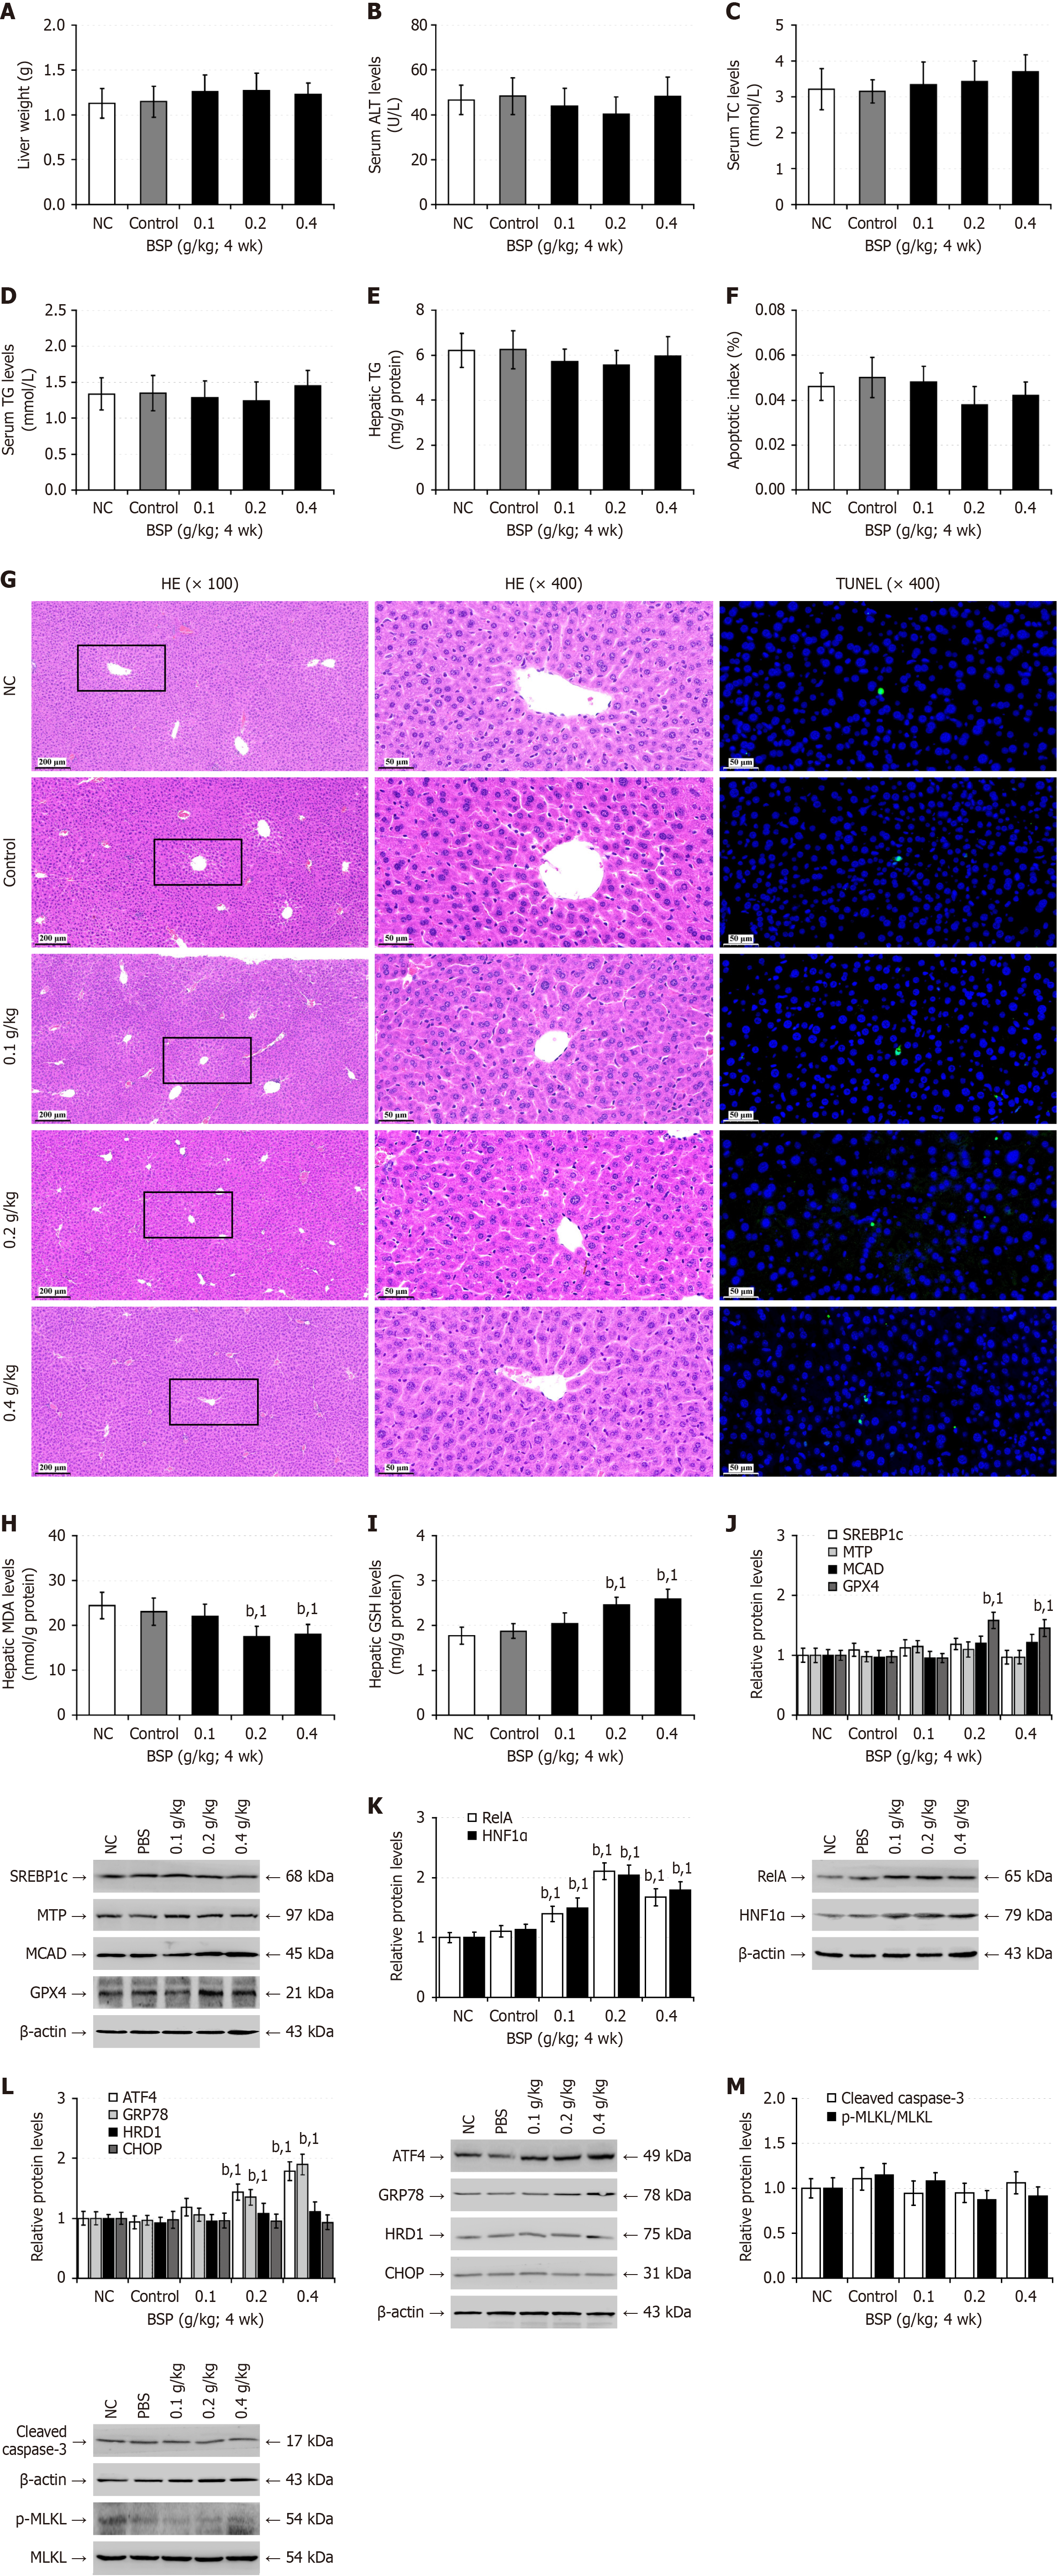
Figure 4 Treatment with Bletilla striata polysaccharides is relatively safe in healthy mice.
All mice were randomized into five groups (12 individuals each) including the normal control group (untreated); solvent control group (control; phosphate buffer saline: 20 mL/kg; quaque die; irrigation; 4 weeks); simple Bletilla striata polysaccharides group (0.1, 0.2, 0.4 g/kg; quaque die; irrigation; 4 weeks) (n = 12). Twelve hours after the final treatment, the mice were fasted for 6 h and their blood and liver samples were collected. A: Liver weights; B: Serum alanine aminotransferase levels; C: Serum total cholesterol levels; D: Serum triglyceride levels; E: Liver tissue triglyceride contents; F: Apoptotic index; G: Hematoxylin and eosin staining analysis of liver tissue pathology and transferase-mediated deoxyuridine triphosphate-nick end labeling analysis of liver cell apoptosis; H: Hepatic malondialdehyde levels; I: Hepatic reduced glutathione levels; J: Western blot analysis of the relative levels of hepatic lipid metabolism-related protein expression; K: Western blot analysis of relative hepatic nuclear factor kappa B p65, and hepatocyte nuclear factor-1 alpha protein levels; L: Western blot analysis of hepatic endoplasmic reticulum stress-related protein expression; M: Western blot analysis of hepatic cleaved caspase-3 and mixed lineage kinase domain-like protein phosphorylation. Data are representative images or expressed as the mean ± SD of each group of mice from at least three separate experiments. bP < 0.01. 1P < 0.01 vs the untreated group. NC: Normal control; ALT: Alanine aminotransferase; TC: Total cholesterol; TG: Triglycerides; BSP: Bletilla striata polysaccharides; HE: Hematoxylin and eosin; MLKL: Mixed lineage kinase domain-like protein; TUNEL: Transferase-mediated deoxyuridine triphosphate-nick end labeling; wk: Week; MDA: Malondialdehyde; GSH: Glutathione; PBS: Phosphate buffer saline; SREBP1c: Cleaved sterol regulatory element-binding protein 1; MTP: Microsomal triglyceride transfer protein; MCAD: Medium-chain acyl-CoA dehydrogenase; GPX4: Glutathione peroxidase 4; HNF1α: Hepatocyte nuclear factor-1 alpha; GRP78: 78-kDa glucose-regulated protein; CHOP: CCAAT-enhancer-binding protein homologous protein; HRD1: 3-hydroxy-3-methyl glutaryl coenzyme A reductase degradation 1 homolog; ATF4: Activating transcription factor 4; RelA: Nuclear factor kappa B p65.
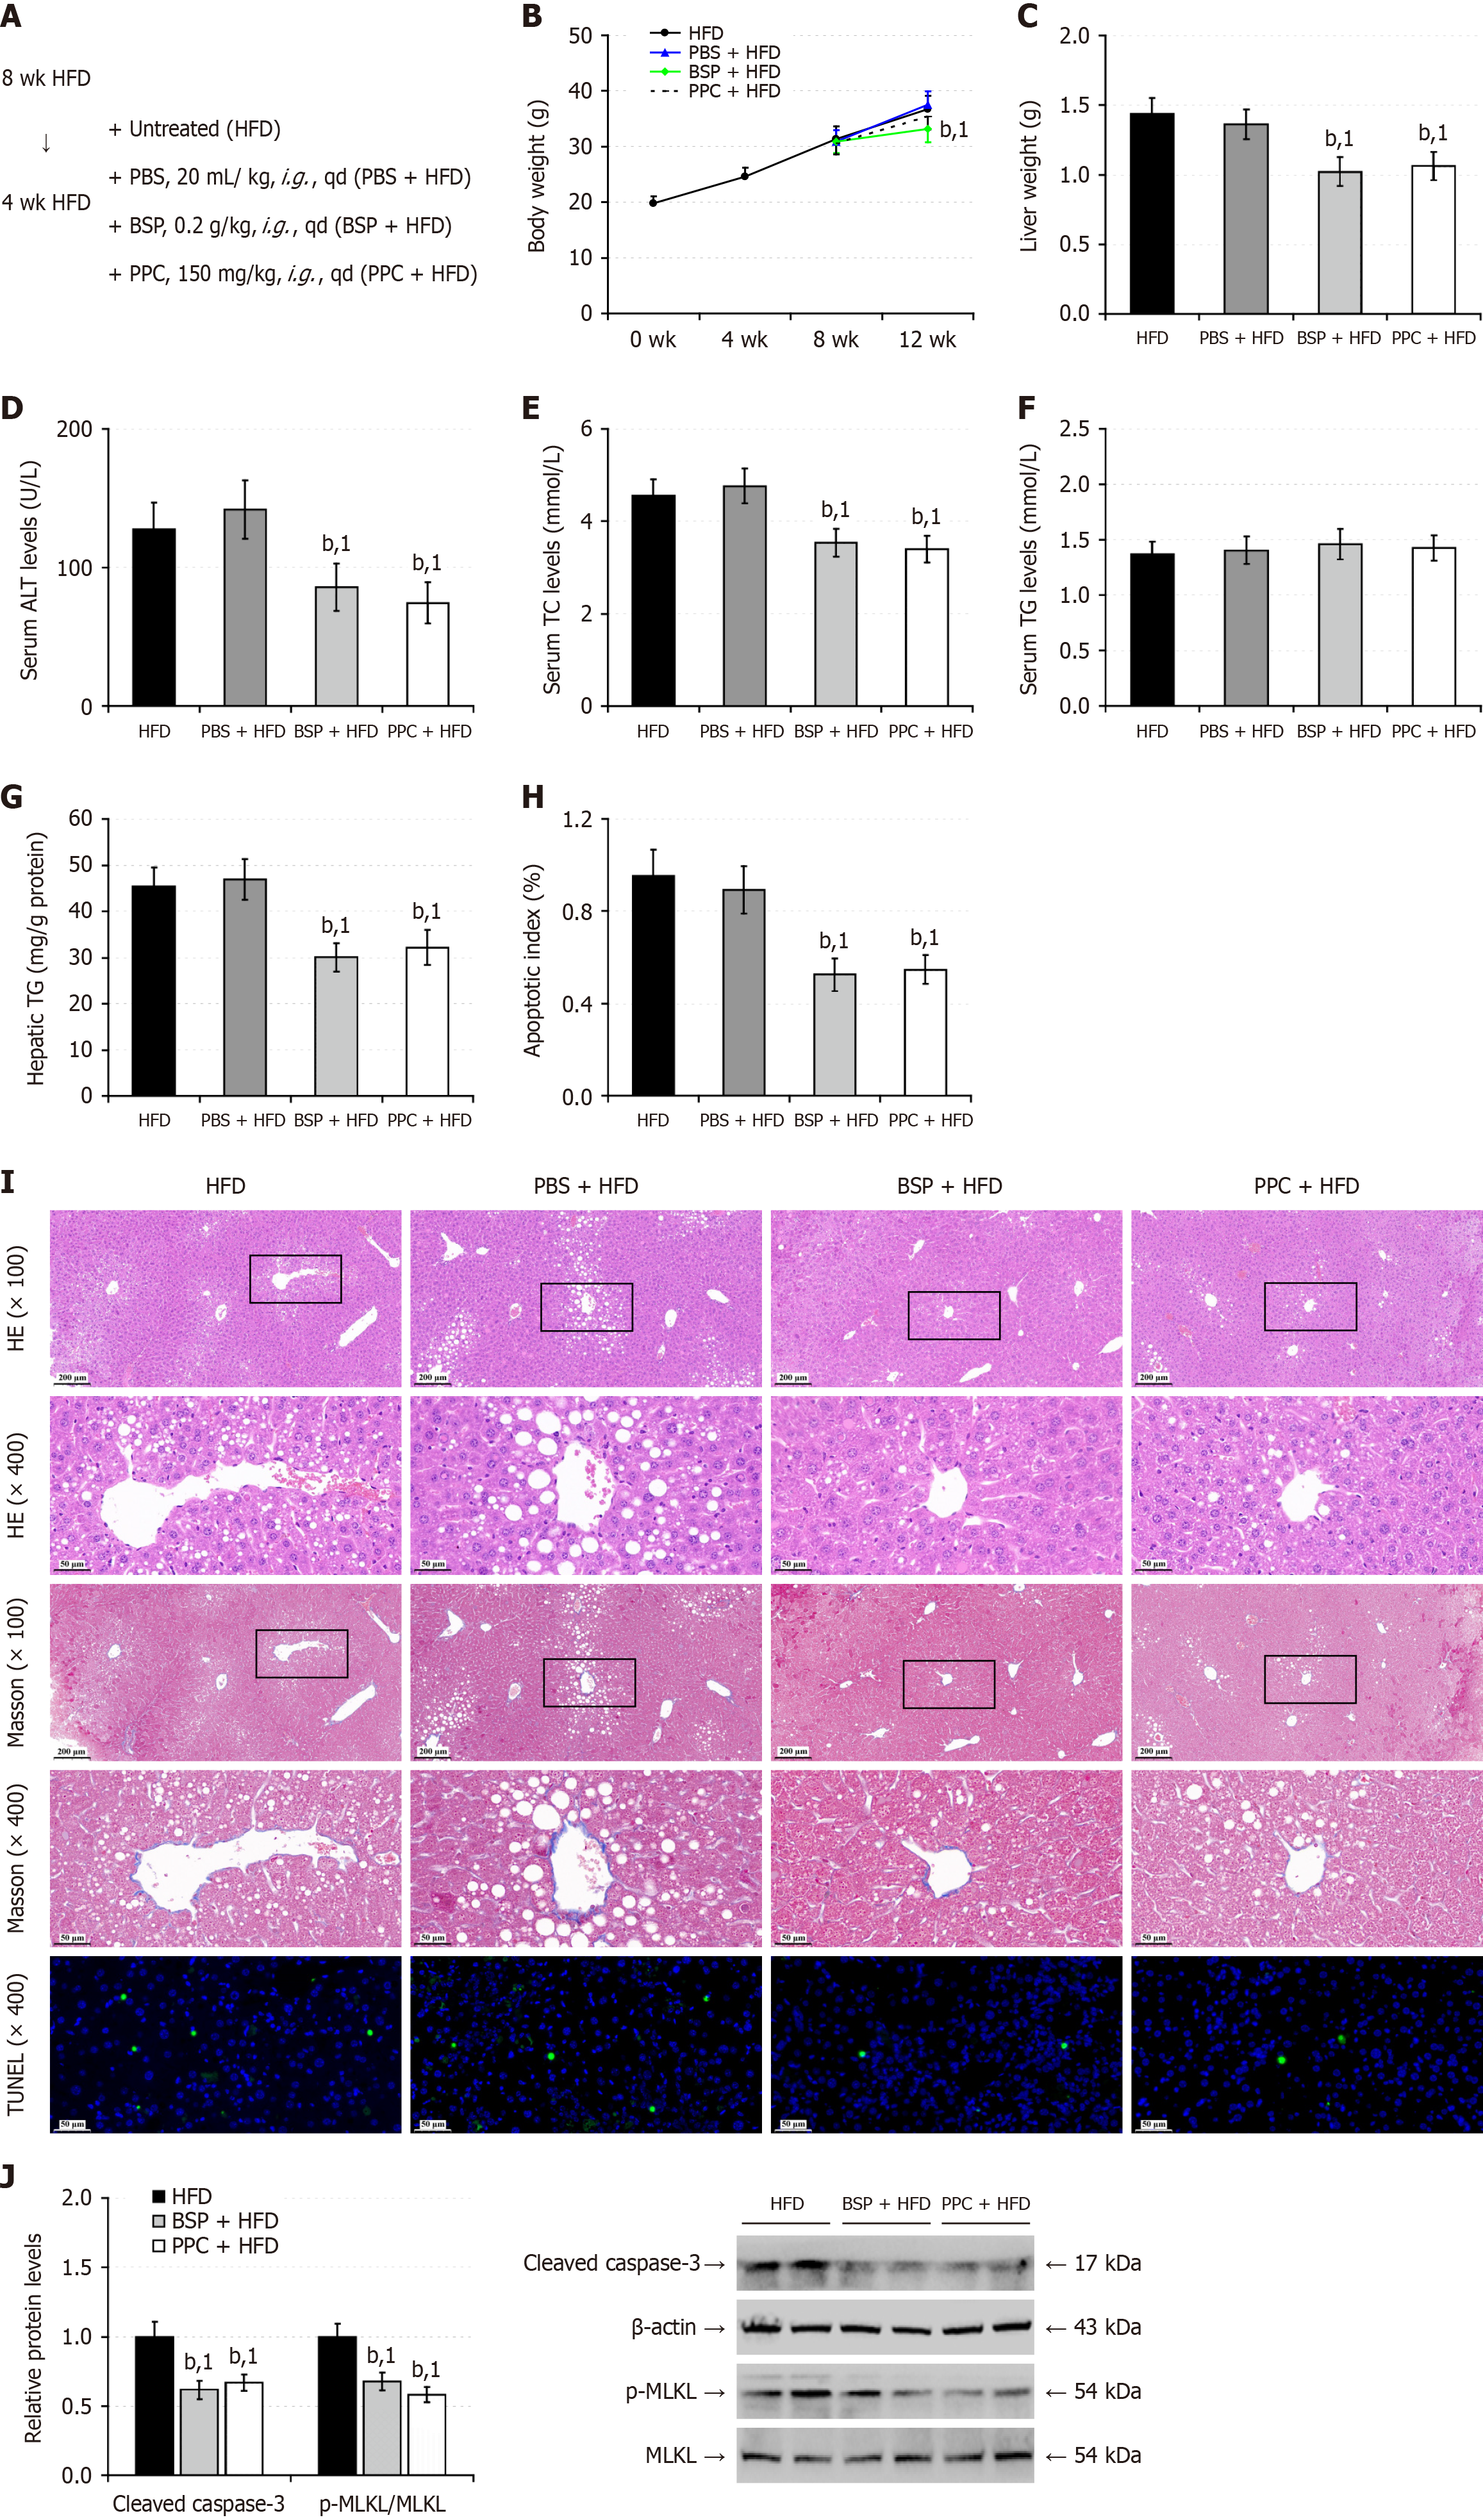
Figure 5 Treatment with Bletilla striata polysaccharides mitigates the high-fat-diet-induced hepatic steatosis in mice.
A: After being fed with high-fat-diet (HFD) for 8 weeks, the mice were randomized and untreated as the HFD group or treated with phosphate buffer saline (PBS) as the PBS + HFD group, 0.2 g/kg Bletilla striata polysaccharides (BSP) as the BSP + HFD group, or 150 mg/kg polyenylphosphatidylcholine (PPC) as the PPC + HFD group by gavage daily for 4 weeks (n = 12). The mice were continually fed with HFD for another 4 weeks; B: Longitudinal measurements of mouse body weights; C: Liver weights; D: Serum alanine aminotransferase levels; E: Serum total cholesterol levels; F: Serum triglyceride (TG) levels; G: Hepatic TG contents; H: Liver cell apoptotic index; I: Hematoxylin and eosin and Masson staining of liver tissue sections and transferase-mediated deoxyuridine triphosphate-nick end labeling analysis of hepatic cell apoptosis; J: Western blot analysis of the relative levels of apoptosis-, and necroptosis-related protein. Data are representative images or expressed as the mean ± SD of each group of mice from at least three separate experiments. bP < 0.01. 1P < 0.01 vs the high-fat-diet group. PBS: Phosphate buffer saline; ALT: Alanine aminotransferase; TC: Total cholesterol; TG: Triglycerides; HFD: High-fat-diet; BSP: Bletilla striata polysaccharides; HE: Hematoxylin and eosin; MLKL: Mixed lineage kinase domain-like protein; TUNEL: Transferase-mediated deoxyuridine triphosphate-nick end labeling; wk: Week; qd: Quaque die; PPC: Polyenylphosphatidylcholine.
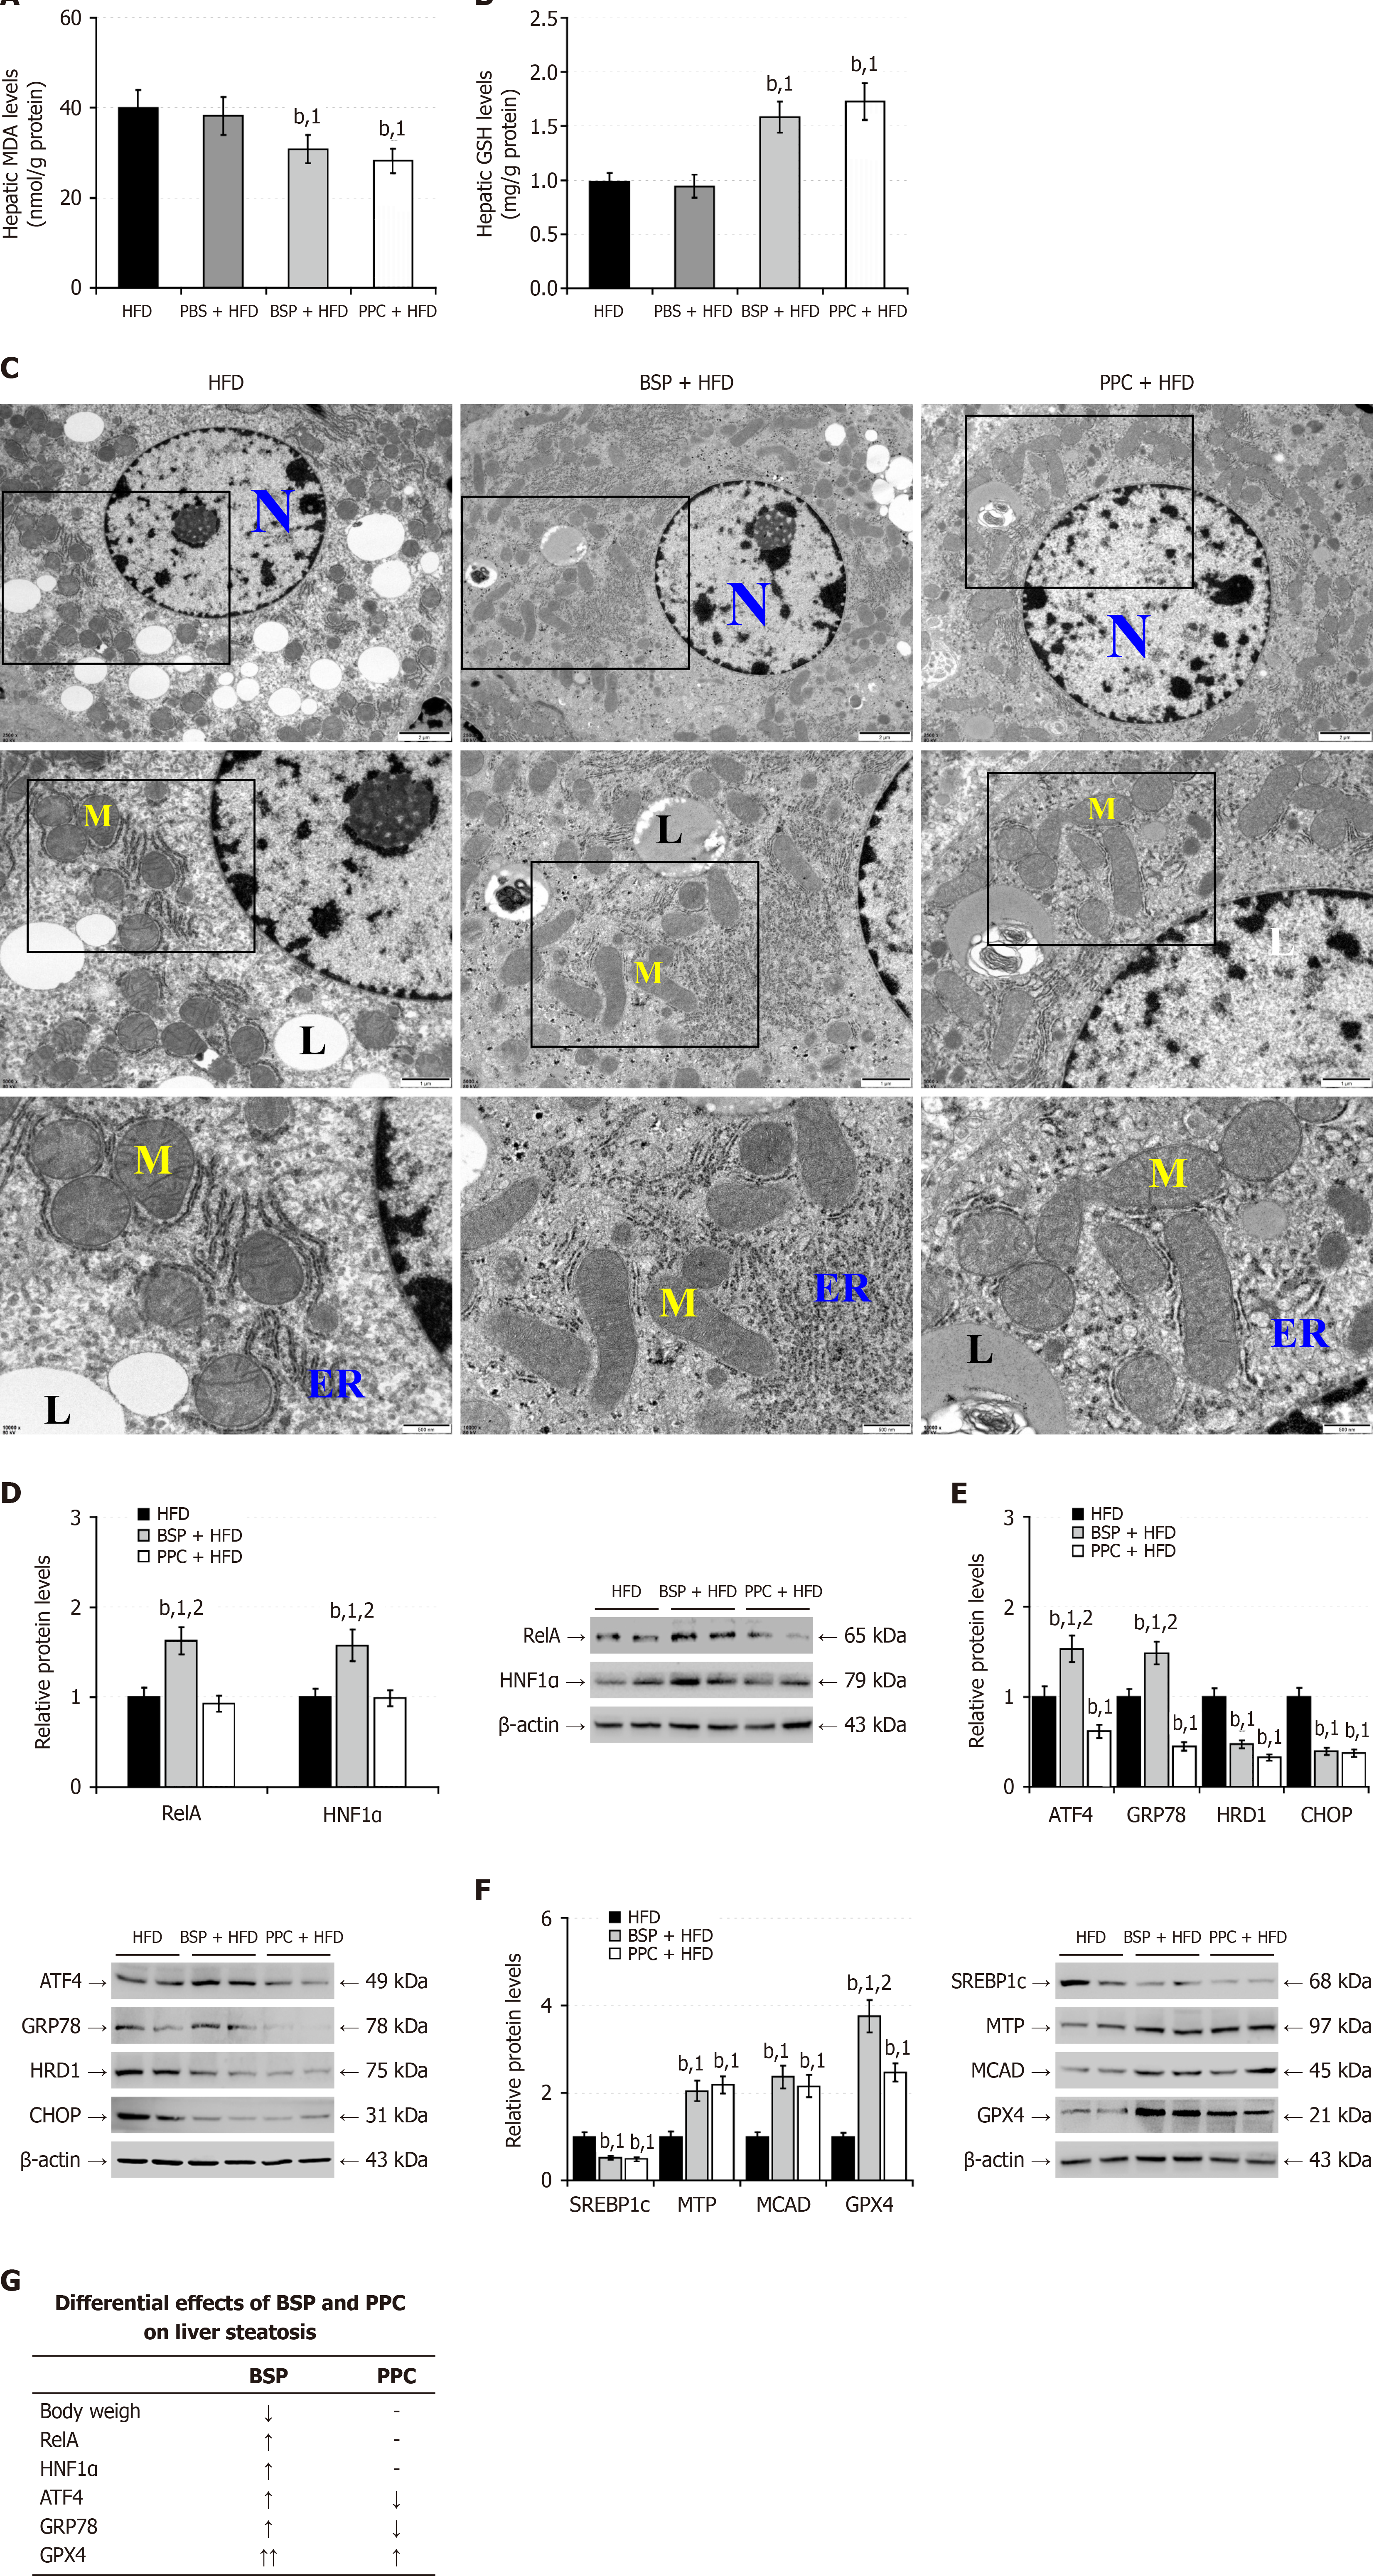
Figure 6 Treatment with Bletilla striata polysaccharides enhances the nuclear factor kappa B p65/hepatocyte nuclear factor-1 alpha signaling and mitigates the high-fat-diet-induced hepatic lipid metabolism disorder in mice.
A: Hepatic malondialdehyde levels; B: Hepatic reduced glutathione levels; C: Transmission electron microscopy analysis of liver tissue ultrastructure; D: Western blot analysis of the relative levels of hepatic nuclear factor kappa B p65 and hepatocyte nuclear factor-1 alpha protein expression; E: Western blot analysis of the relative levels of hepatic endoplasmic reticulum tress-related protein expression; F: Western blot analysis of the relative levels of hepatic lipid-metabolism related protein expression; G: Comparison of the effects of Bletilla striata polysaccharides and polyenylphosphatidylcholine on high-fat-diet-induced mice. Data are presented as representative images or expressed as the mean ± SD of each group of mice from at least three separate experiments. bP < 0.01. 1P < 0.01 vs the high-fat-diet group. 2P < 0.01 vs the polyenylpho
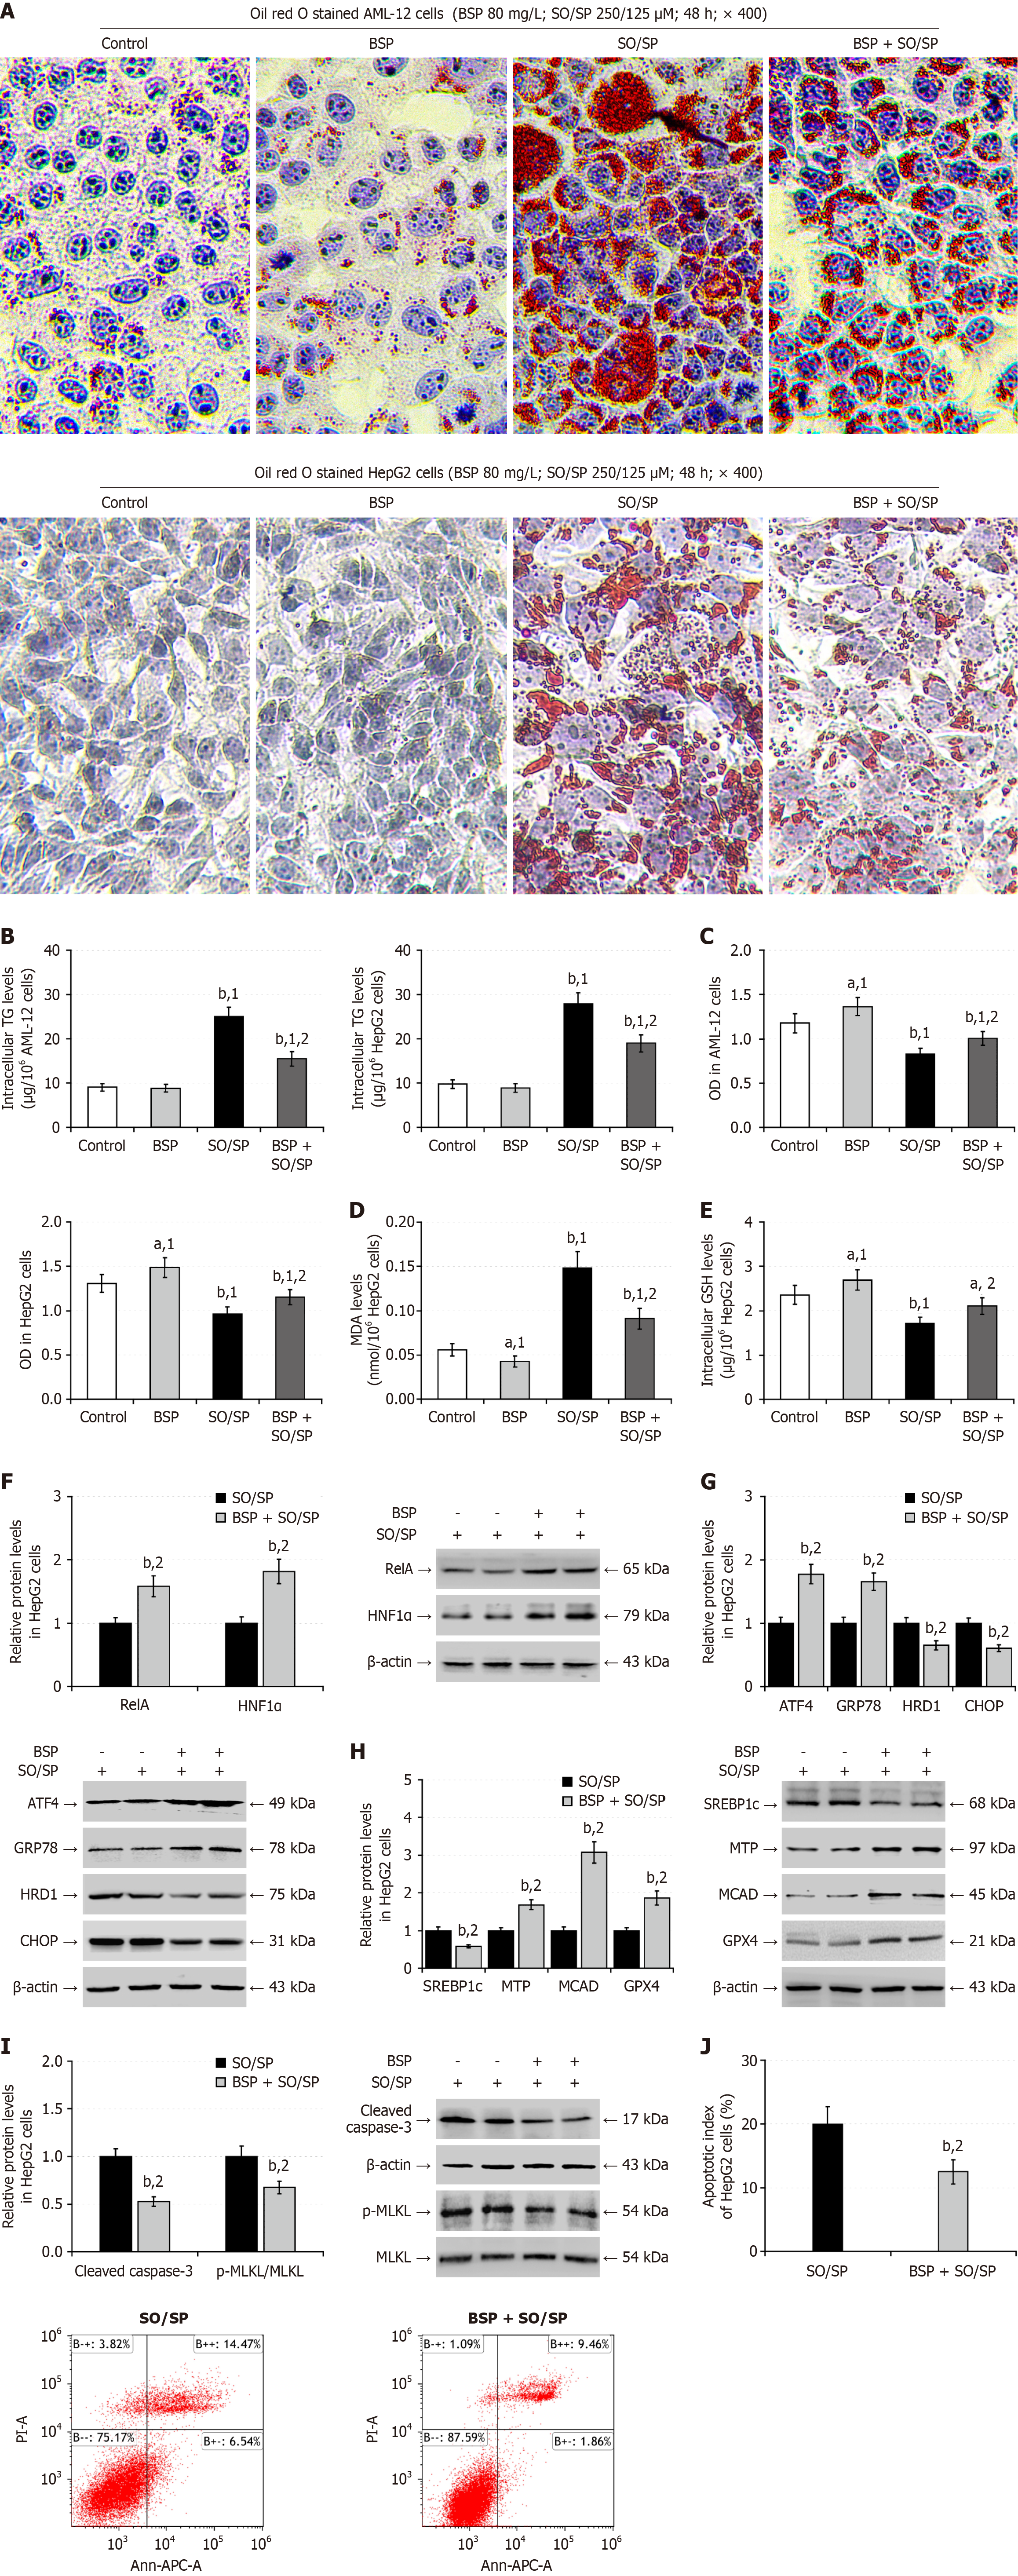
Figure 7 Bletilla striata polysaccharides treatment enhances the nuclear factor kappa B p65/hepatocyte nuclear factor-1 alpha signaling and alleviates the lipid degeneration in the sodium oleate/sodium palmitate-stimulated hepatocytes.
A: Oil red O staining of lipids in AML-12 and HepG2 cells; B: Intracellular triglycerides content; C: Cell counting kit-8 analysis of the viability of AML-12 and HepG2 cells; D: Malondialdehyde levels; E: Reduced glutathione levels; F: Western blot analysis of the relative levels of nuclear factor kappa B p65 and hepatocyte nuclear factor-1 alpha expression; G: Western blot analysis of the relative levels of endoplasmic reticulum stress-related protein expression; H: Western blot analysis of the relative levels of lipid metabolism-related protein expression; I: Western blot analysis of the relative levels of cleaved caspase-3 and mixed lineage kinase domain-like protein phosphorylation; J: Flow cytometry analysis of the frequency of apoptotic cells. Data are representative images or expressed as the mean ± SD of each group from three separate experiments. aP < 0.05. bP < 0.01. 1P < 0.01 vs the control group. 2P < 0.01 vs the sodium oleate/sodium palmitate group. SO/SP: Sodium oleate/sodium palmitate; BSP: Bletilla striata polysaccharides; TG: Triglycerides; MDA: Malondialdehyde; GSH: Glutathione; HNF1α: Hepatocyte nuclear factor-1 alpha; GRP78: 78-kDa glucose-regulated protein; CHOP: CCAAT-enhancer-binding protein homologous protein; HRD1: 3-hydroxy-3-methyl glutaryl coenzyme A reductase degradation 1 homolog; OD: Optical density; SREBP1c: Cleaved sterol regulatory element-binding protein 1; MTP: Microsomal triglyceride transfer protein; MCAD: Medium-chain acyl-CoA dehydrogenase; GPX4: Glutathione peroxidase 4; MLKL: Mixed lineage kinase domain-like protein; ATF4: Activating transcription factor 4; RelA: Nuclear factor kappa B p65.
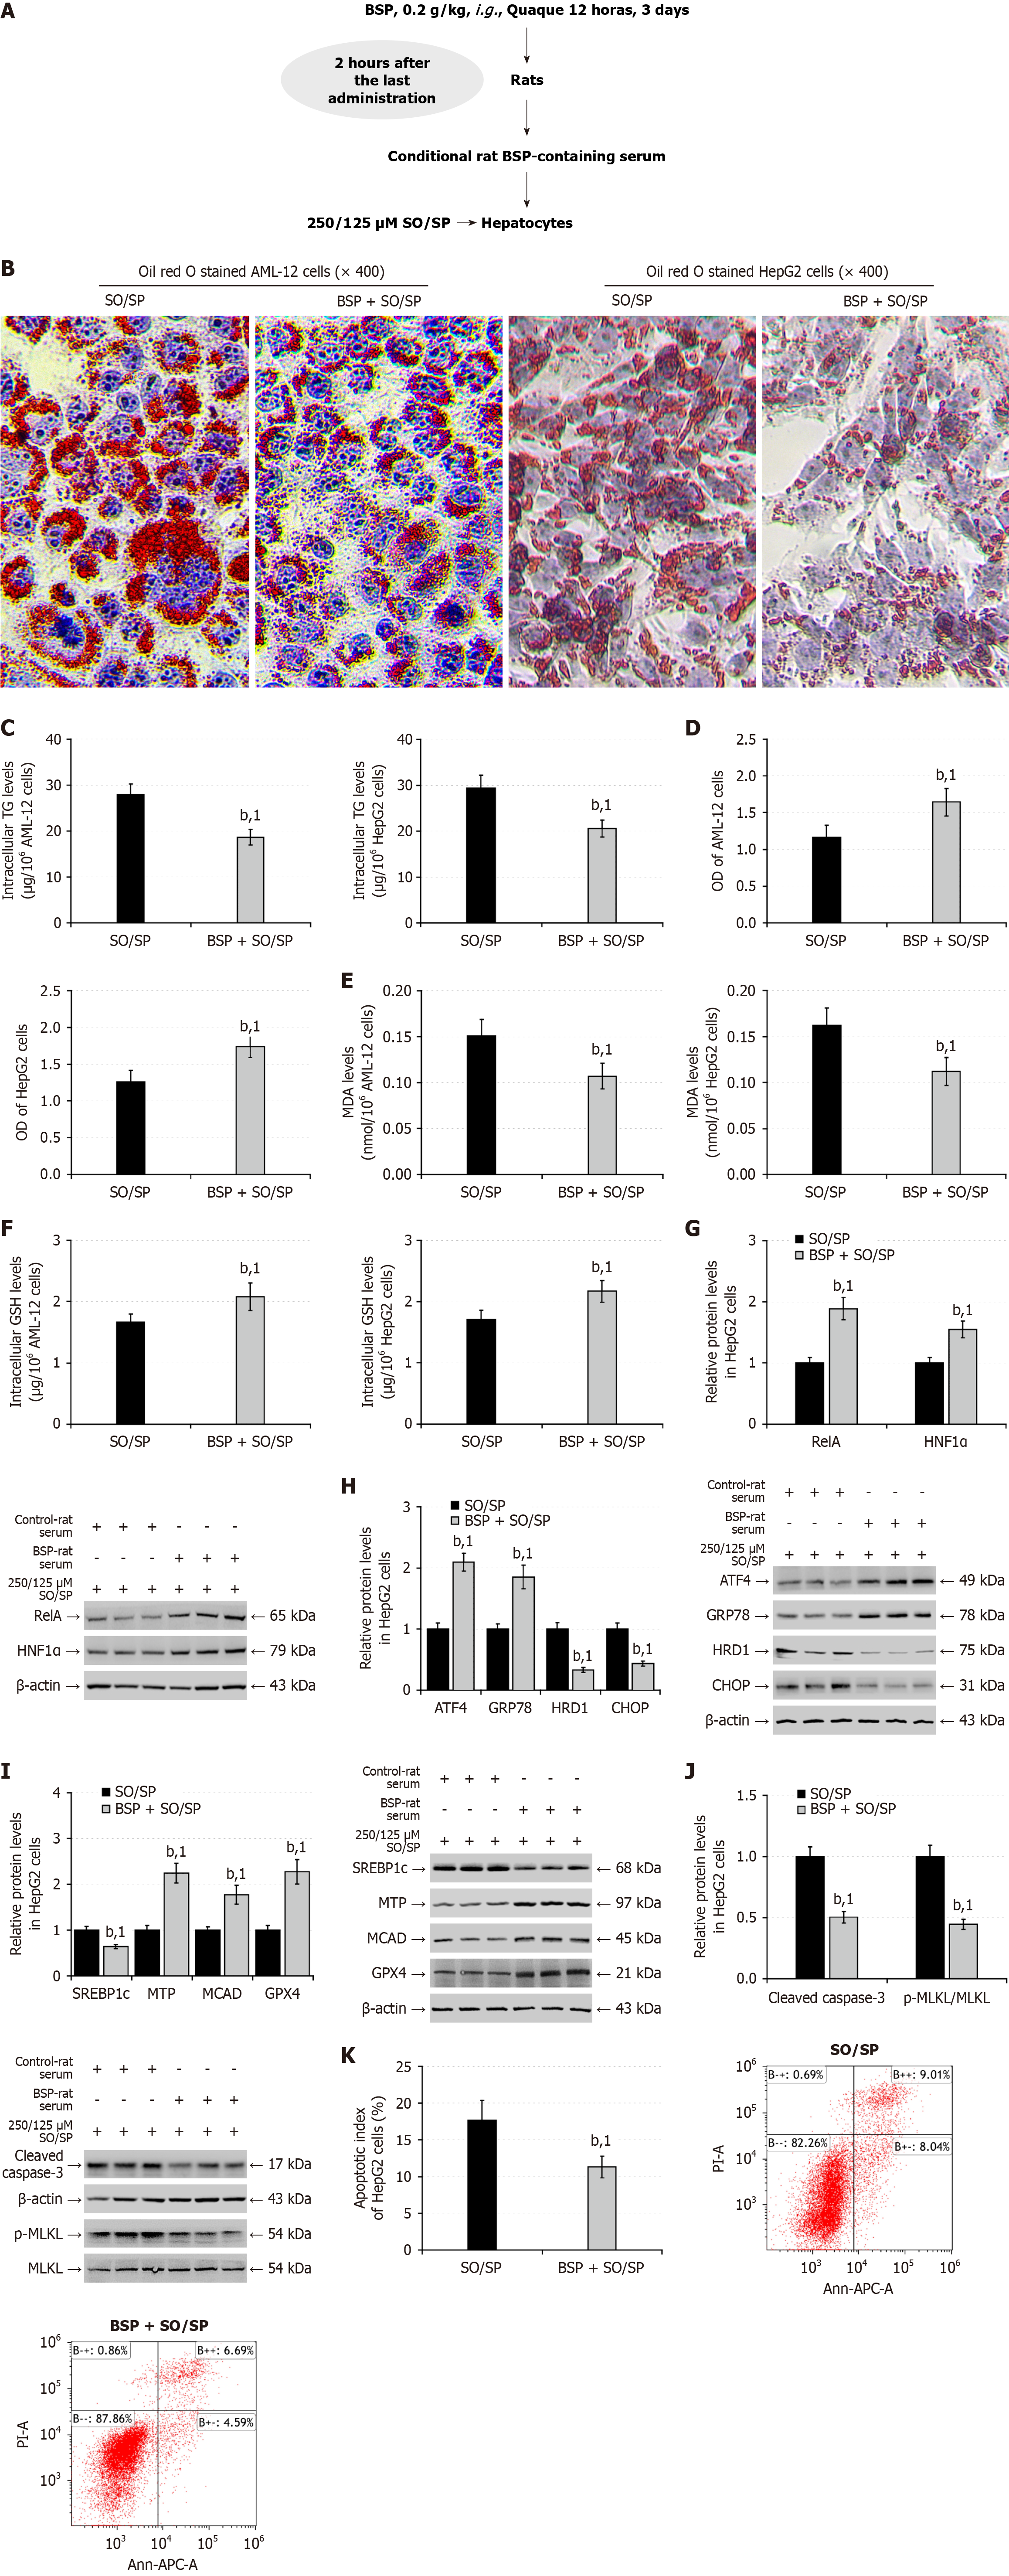
Figure 8 Treatment with conditional rat Bletilla striata polysaccharides-containing serum enhances the sodium oleate/sodium palmitate-stimulated nuclear factor kappa B p65/hepatocyte nuclear factor-1 alpha signaling and alleviates lipid metabolism disorder in hepatocytes.
A: Healthy rats were treated with control phosphate buffer saline or 0.2 g/kg Bletilla striata polysaccharides (BSP) by gavage every 12 hours for three consecutive days. Two hours after the last administration, their blood samples were obtained for preparing conditional rat serum samples. AML-12 and HepG2 cells were cultured in the medium supplemented with 10% control or conditional rat BSP-containing serum and stimulated with 250/125 μmol/L sodium oleate/sodium palmitate for 48 hours; B: Oil red O staining of lipids in AML-12 and HepG2 cells; C: Intracellular triglycerides content; D: Cell counting kit-8 assay of the viability; E: Intracellular malondialdehyde levels; F: Reduced glutathione levels; G: Western blot analysis of the relative levels of nuclear factor kappa B p65, and hepatocyte nuclear factor-1 alpha expression; H: Western blot analysis of the relative levels of endoplasmic reticulum stress-related protein expression; I: Western blot analysis of the relative levels of lipid metabolism-related protein expression; J: Western blot analysis of the relative levels of cleaved caspase-3, and mixed lineage kinase domain-like protein phosphorylation; K: Flow cytometry analysis of the frequency of apoptotic cells. Data are representative images or expressed as the mean ± SD of each group from three separate experiments. bP < 0.01. 1P < 0.01 vs the sodium oleate/sodium palmitate group. SO/SP: Sodium oleate/sodium palmitate; BSP: Bletilla striata polysaccharides; TG: Triglycerides; MDA: Malondialdehyde; GSH: Glutathione; HNF1α: Hepatocyte nuclear factor-1 alpha; GRP78: 78-kDa glucose-regulated protein; CHOP: CCAAT-enhancer-binding protein homologous protein; HRD1: 3-hydroxy-3-methyl glutaryl coenzyme A reductase degradation 1 homolog; SREBP1c: Cleaved sterol regulatory element-binding protein 1; MTP: Microsomal triglyceride transfer protein; MCAD: Medium-chain acyl-CoA dehydrogenase; GPX4: Glutathione peroxidase 4; MLKL: Mixed lineage kinase domain-like protein; OD: Optical density; ATF4: Activating transcription factor 4; RelA: Nuclear factor kappa B p65.
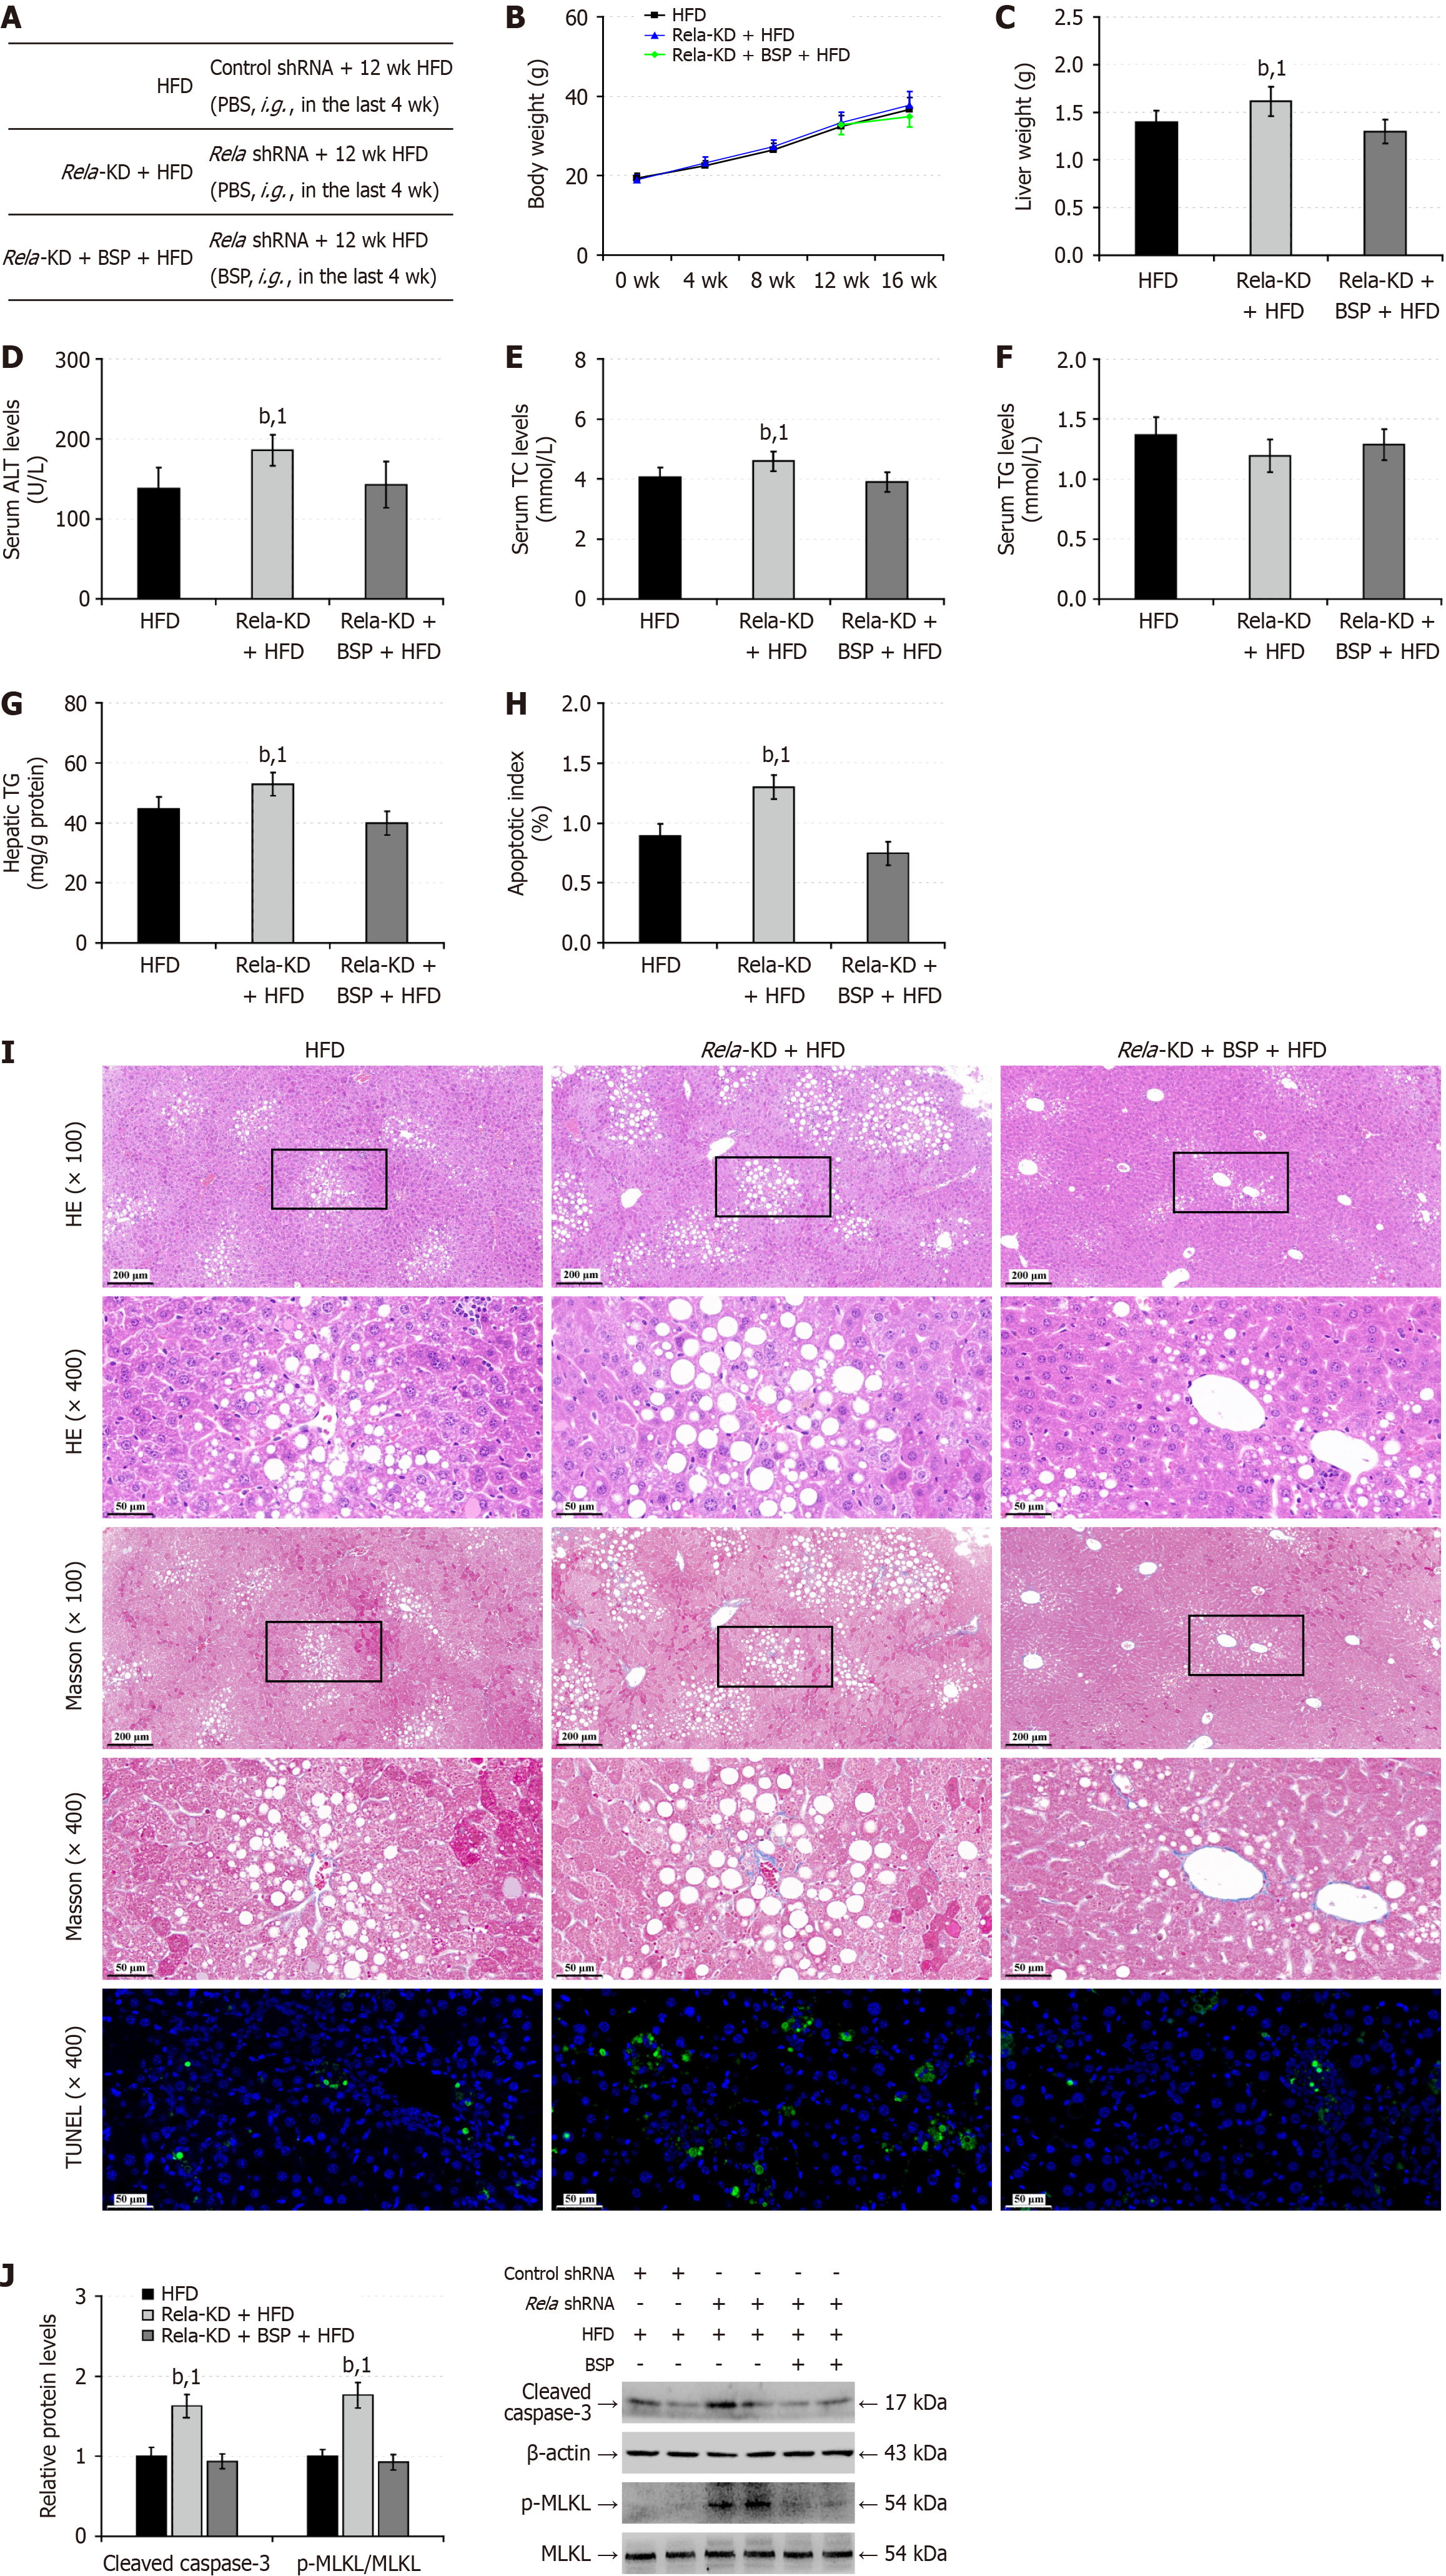
Figure 9 RELA silencing partially abrogates the therapeutic effects of Bletilla striata polysaccharides on hepatic steatosis in mice.
A: C57BL/6 mice were treated intravenously with recommended adeno-associated virus virions for the expression of control shRNA or RELA-specific shRNA and four weeks later, they were fed with high-fat-diet (HFD) for 12 weeks. During the last 4-week of HFD feeding, the RELA silencing mice were randomized and treated with vehicle phosphate buffer saline or Bletilla striata polysaccharides (BSP) for 4 weeks, leading to the HFD, RELA-knockdown (KD) + HFD group, and RELA-KD + BSP + HFD groups (n = 12); B: Mouse body weights; C: Liver weights; D: Serum aminotransferase levels; E: Serum total cholesterol levels; F: Serum triglyceride (TG) levels; G: Liver tissue TG contents; H: Apoptotic index; I: Hematoxylin and eosin and Masson staining of liver tissue sections and transferase-mediated deoxyuridine triphosphate-nick end labeling analysis of liver cell apoptosis; J: Western blot analysis of the relative levels of hepatic cleaved caspase-3, and mixed lineage kinase domain-like protein phosphorylation. Data are representative images or expressed as the mean ± SD of each group of mice from three separate experiments. bP < 0.01. 1P < 0.01 vs the high-fat-diet group. BSP: Bletilla striata polysaccharides; TG: Triglycerides; KD: Knockdown; HFD: High-fat-diet; wk: Week; shRNA: Small hairpin ribonucleic acid; ALT: Alanine aminotransferase; TC: Total cholesterol; TG: Triglycerides; MLKL: Mixed lineage kinase domain-like protein; HE: Hematoxylin and eosin; qd: Quaque die; TUNEL: Transferase-mediated deoxyuridine triphosphate-nick end labeling.
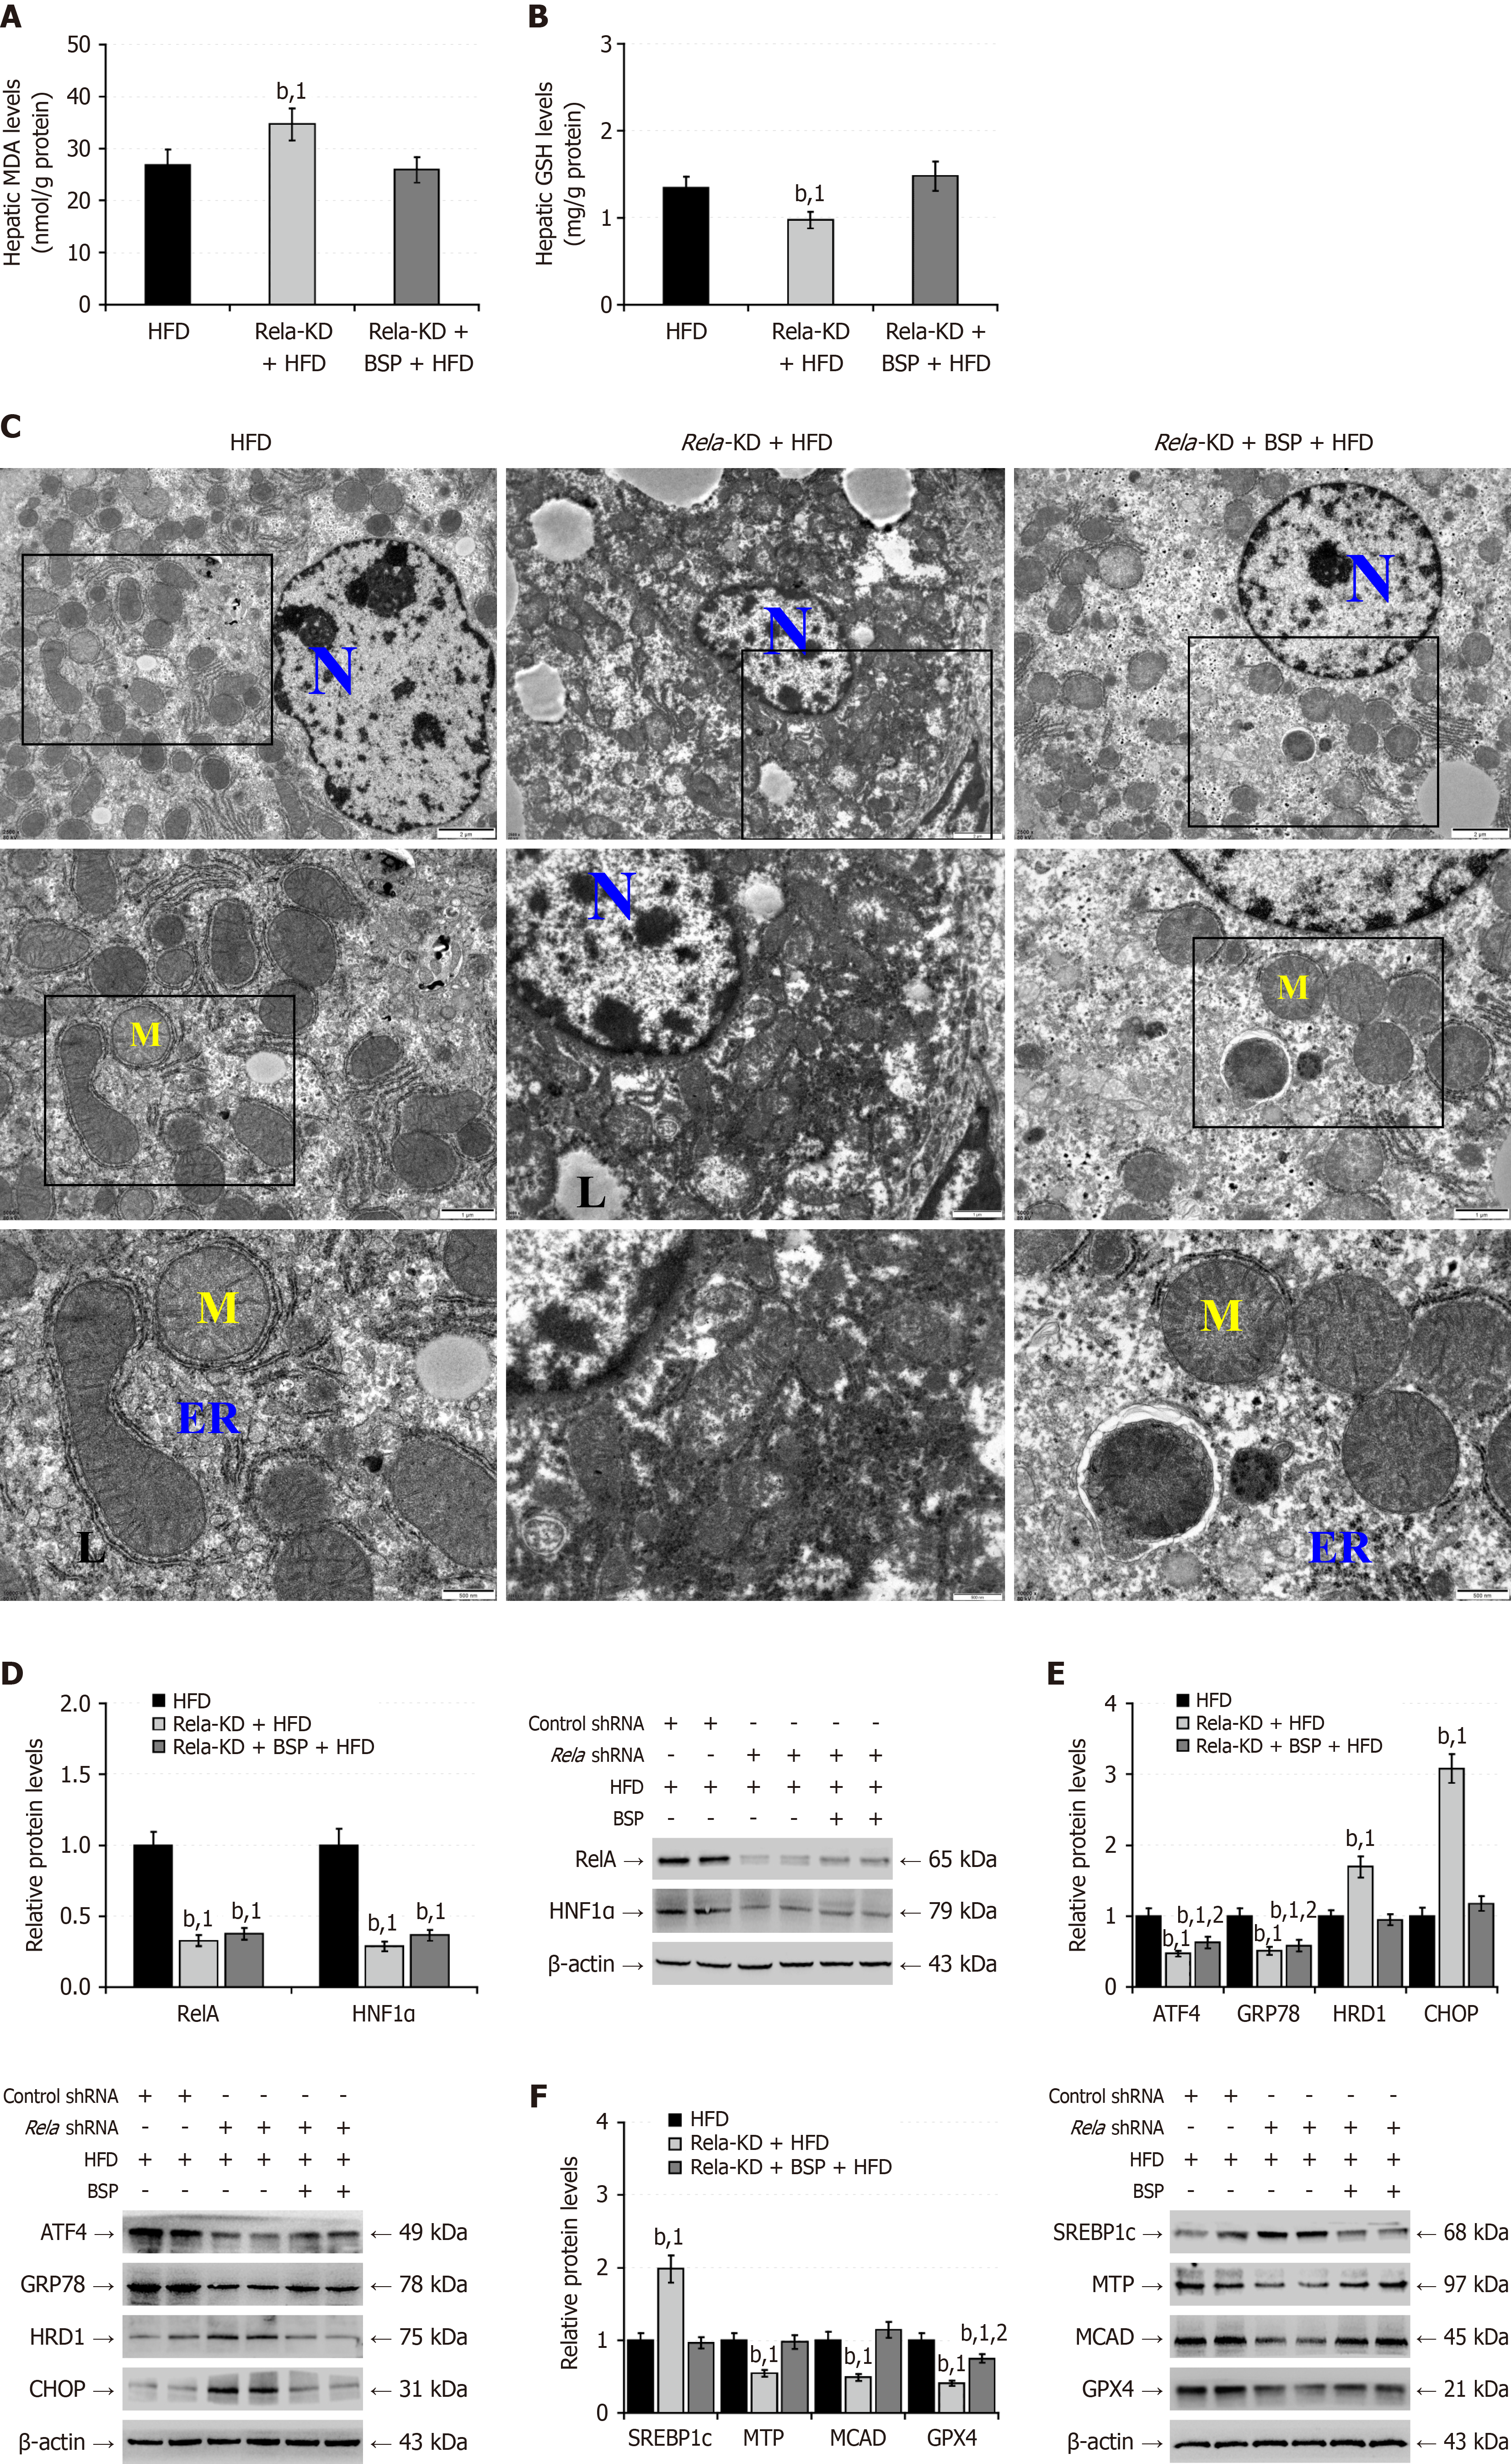
Figure 10 RELA silencing alters endoplasmic reticulum and oxidative responses in mouse liver induced by high-fat-diet.
A: Intracellular malondialdehyde levels; B: Reduced glutathione levels; C: Transmission electron microscopy analysis of liver tissue ultrastructure; D: Western blot analysis of the relative levels of hepatic nuclear factor kappa B p65, and hepatocyte nuclear factor-1 alpha protein expression; E: Western blot analysis of the relative levels of hepatic endoplasmic reticulum stress-related protein expression; F: Western blot analysis of the relative levels of hepatic lipid metabolism-related protein expression. Data are representative images or expressed as the mean ± SD of each group of mice from three separate experiments. bP < 0.01. 1P < 0.01 vs the high-fat-diet group. 2P < 0.01 vs the RELA-knockdown + high-fat-diet group. BSP: Bletilla striata polysaccharides; KD: Knockdown; HFD: High-fat-diet; MDA: Malondialdehyde; GSH: Glutathione; ER: Endoplasmic reticulum; L: Lipid droplet; M: Mitochondria; N: Nucleus; HNF1α: Hepatocyte nuclear factor-1 alpha; GRP78: 78-kDa glucose-regulated protein; CHOP: CCAAT-enhancer-binding protein homologous protein; HRD1: 3-hydroxy-3-methyl glutaryl coenzyme A reductase degradation 1 homolog; SREBP1c: Cleaved sterol regulatory element-binding protein 1; MTP: Microsomal triglyceride transfer protein; MCAD: Medium-chain acyl-CoA dehydrogenase; GPX4: Glutathione peroxidase 4; ATF4: Activating transcription factor 4; RelA: Nuclear factor kappa B p65.
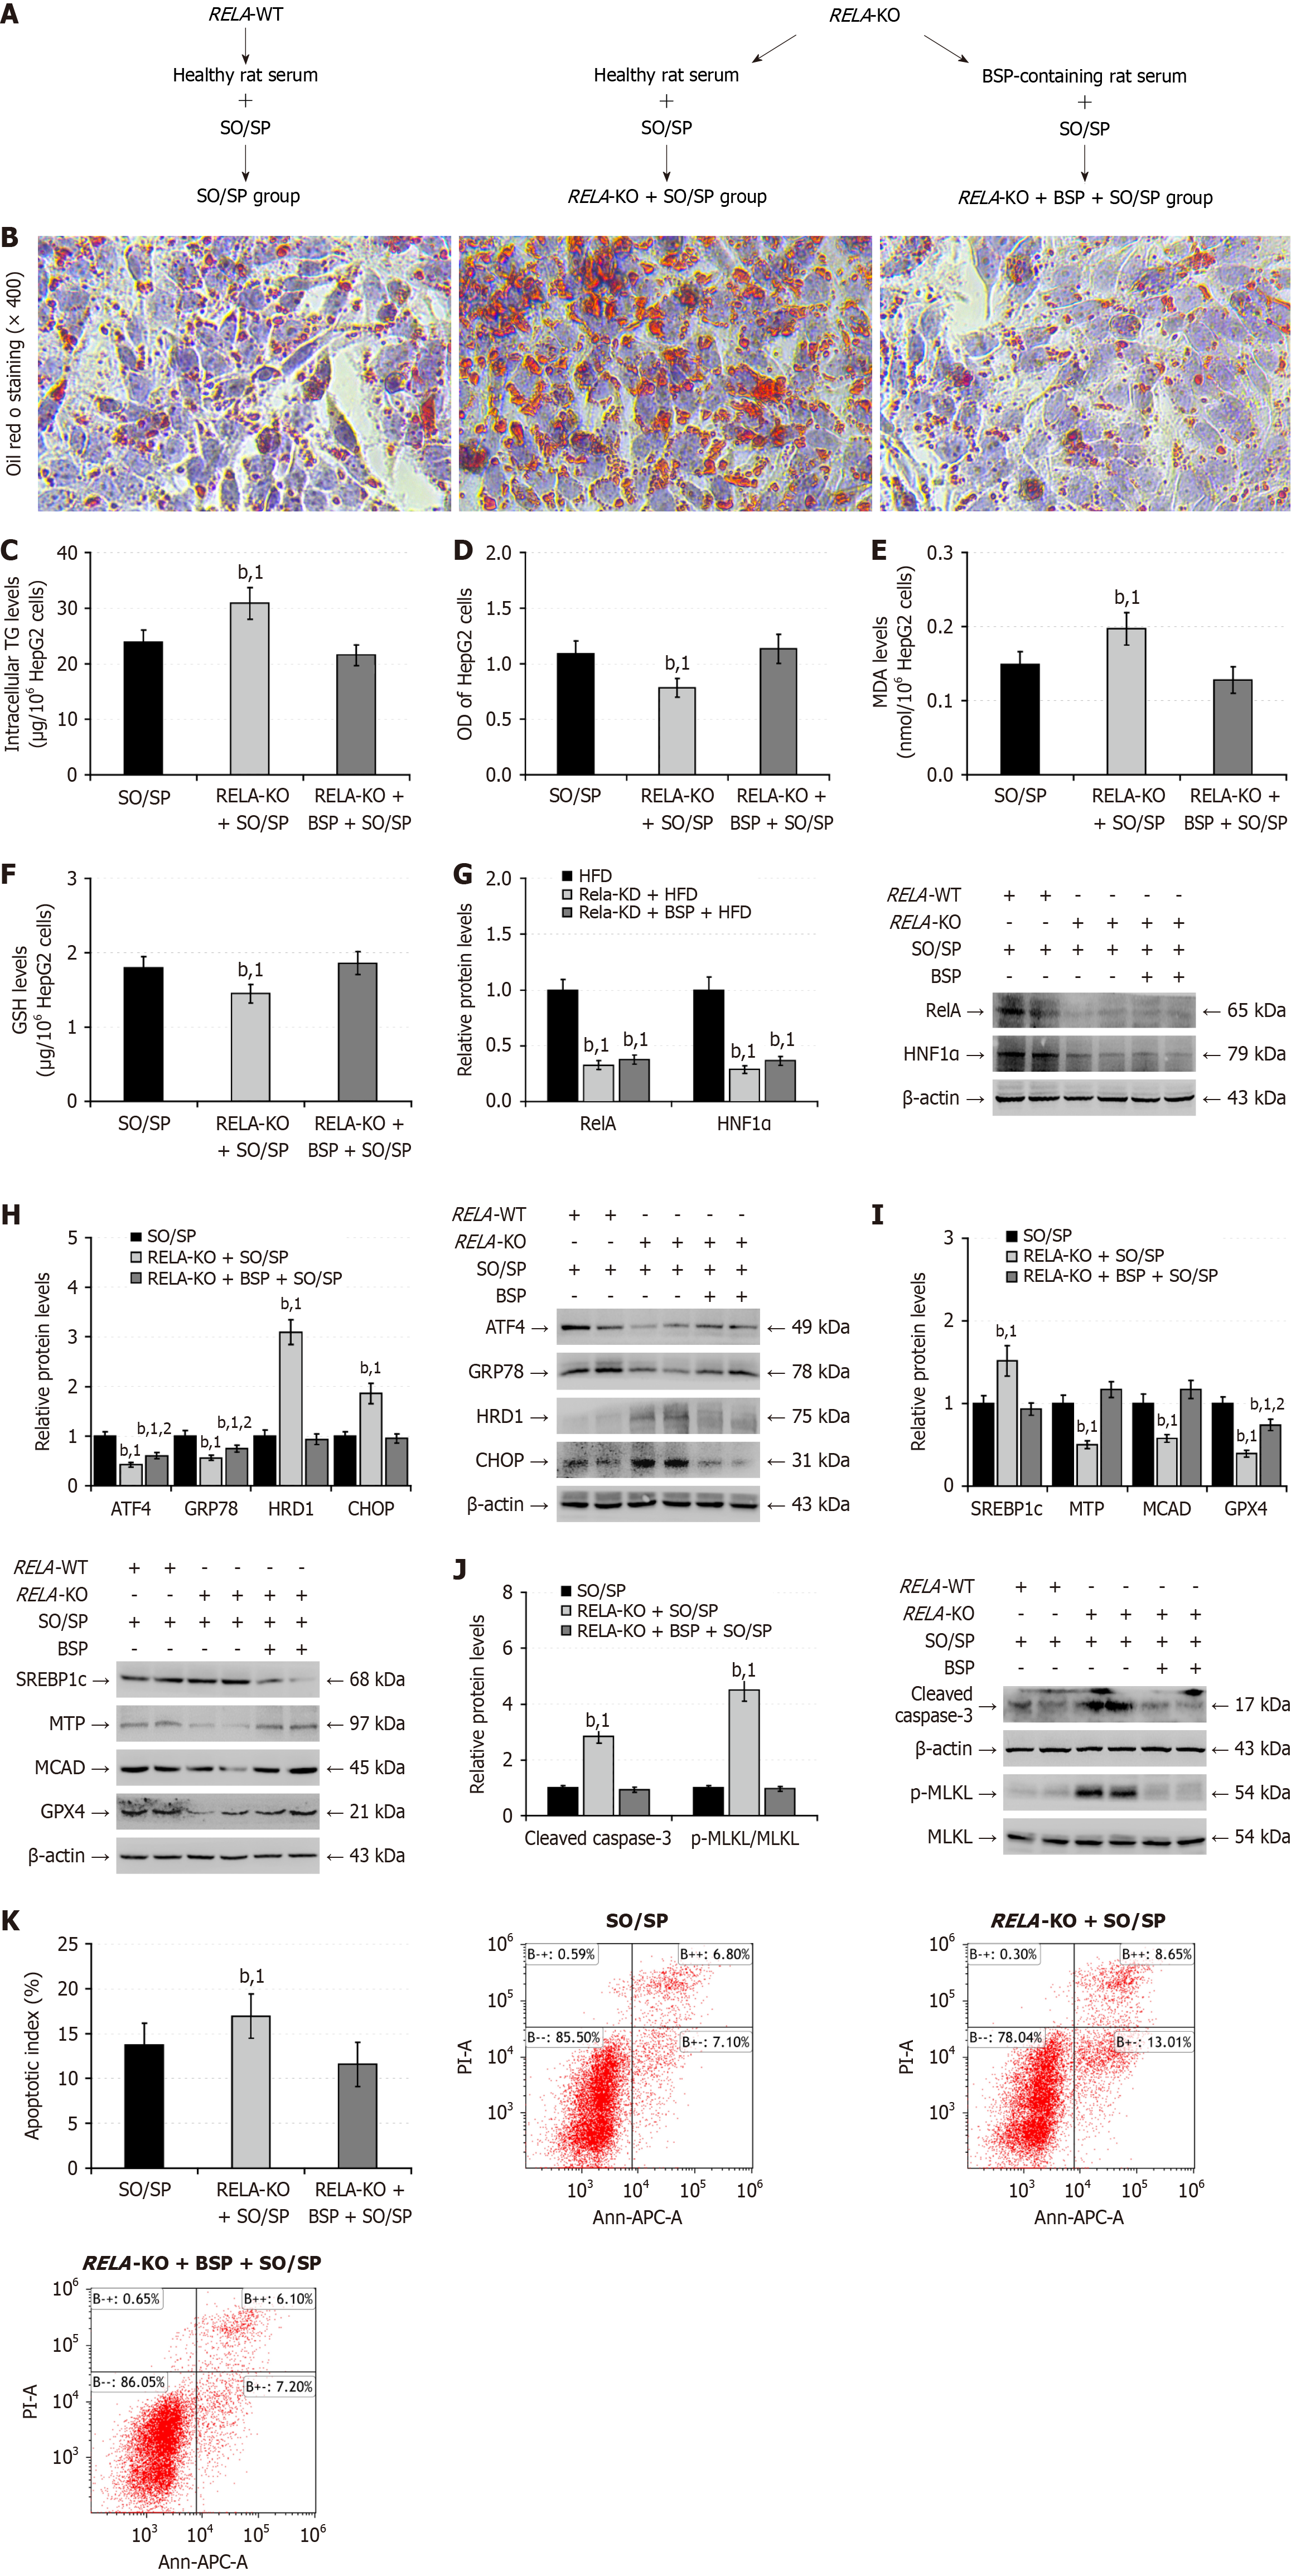
Figure 11 RELA knockout partially abolishes the therapeutic effect of Bletilla striata polysaccharides on the sodium oleate/sodium palmitate-induced lipid degeneration in hepatocytes.
A: RELA-wild-type (WT) and RELA-knockout (KO) HepG2 cells were randomized into three groups, including the sodium oleate/sodium palmitate (SO/SP) group (healthy rat serum + SO/SP incubated RELA-WT HepG2 cells); RELA-KO + SO/SP group (healthy rat serum + SO/SP incubated RELA-KO HepG2 cells); RELA-KO + Bletilla striata polysaccharides (BSP) + SO/SP group (conditional rat BSP serum + SO/SP incubated RELA-KO HepG2 cells). RELA-WT and RELA-KO HepG2 cells were stimulated with SO/SP in the medium containing 10% control rat serum or the conditional rat BSP serum for 48 hours; B: Oil red O staining of lipids in HepG2 cells; C: Intracellular triglycerides content; D: Cell counting kit-8 analysis of the viability of HepG2 cells; E: Malondialdehyde levels; F: Reduced glutathione levels; G: Western blot analysis of the relative levels of nuclear factor kappa B p65 and hepatocyte nuclear factor-1 alpha expression; H: Western blot analysis of the relative levels of endoplasmic reticulum stress-related protein expression; I: Western blot analysis of the relative levels of lipid metabolism-related protein expression; J: Western blot analysis of the relative levels of cleaved caspase-3, and mixed lineage kinase domain-like protein phosphorylation; K: Flow cytometry analysis of the frequency of apoptotic cells. Data are representative images or expressed as the mean ± SD of each group from three separate experiments. bP < 0.01. 1P < 0.01 vs the sodium oleate/sodium palmitate group; 2P < 0.01 vs the RELA-knockout + sodium oleate/sodium palmitate group. KO: Knockout; WT: Wild type; BSP: Bletilla striata polysaccharides; TG: Triglycerides; MDA: Malondialdehyde; GSH: Glutathione; HNF1α: Hepatocyte nuclear factor-1 alpha; GRP78: 78-kDa glucose-regulated protein; CHOP: CCAAT-enhancer-binding protein homologous protein; HRD1: 3-hydroxy-3-methyl glutaryl coenzyme A reductase degradation 1 homolog; SREBP1c: Cleaved sterol regulatory element-binding protein 1; MTP: Microsomal triglyceride transfer protein; MCAD: Medium-chain acyl-CoA dehydrogenase; GPX4: Glutathione peroxidase 4; MLKL: Mixed lineage kinase domain-like protein; APC: Allophycocyanin conjugate; OD: Optical density; ATF4: Activating transcription factor 4; RelA: Nuclear factor kappa B p65.
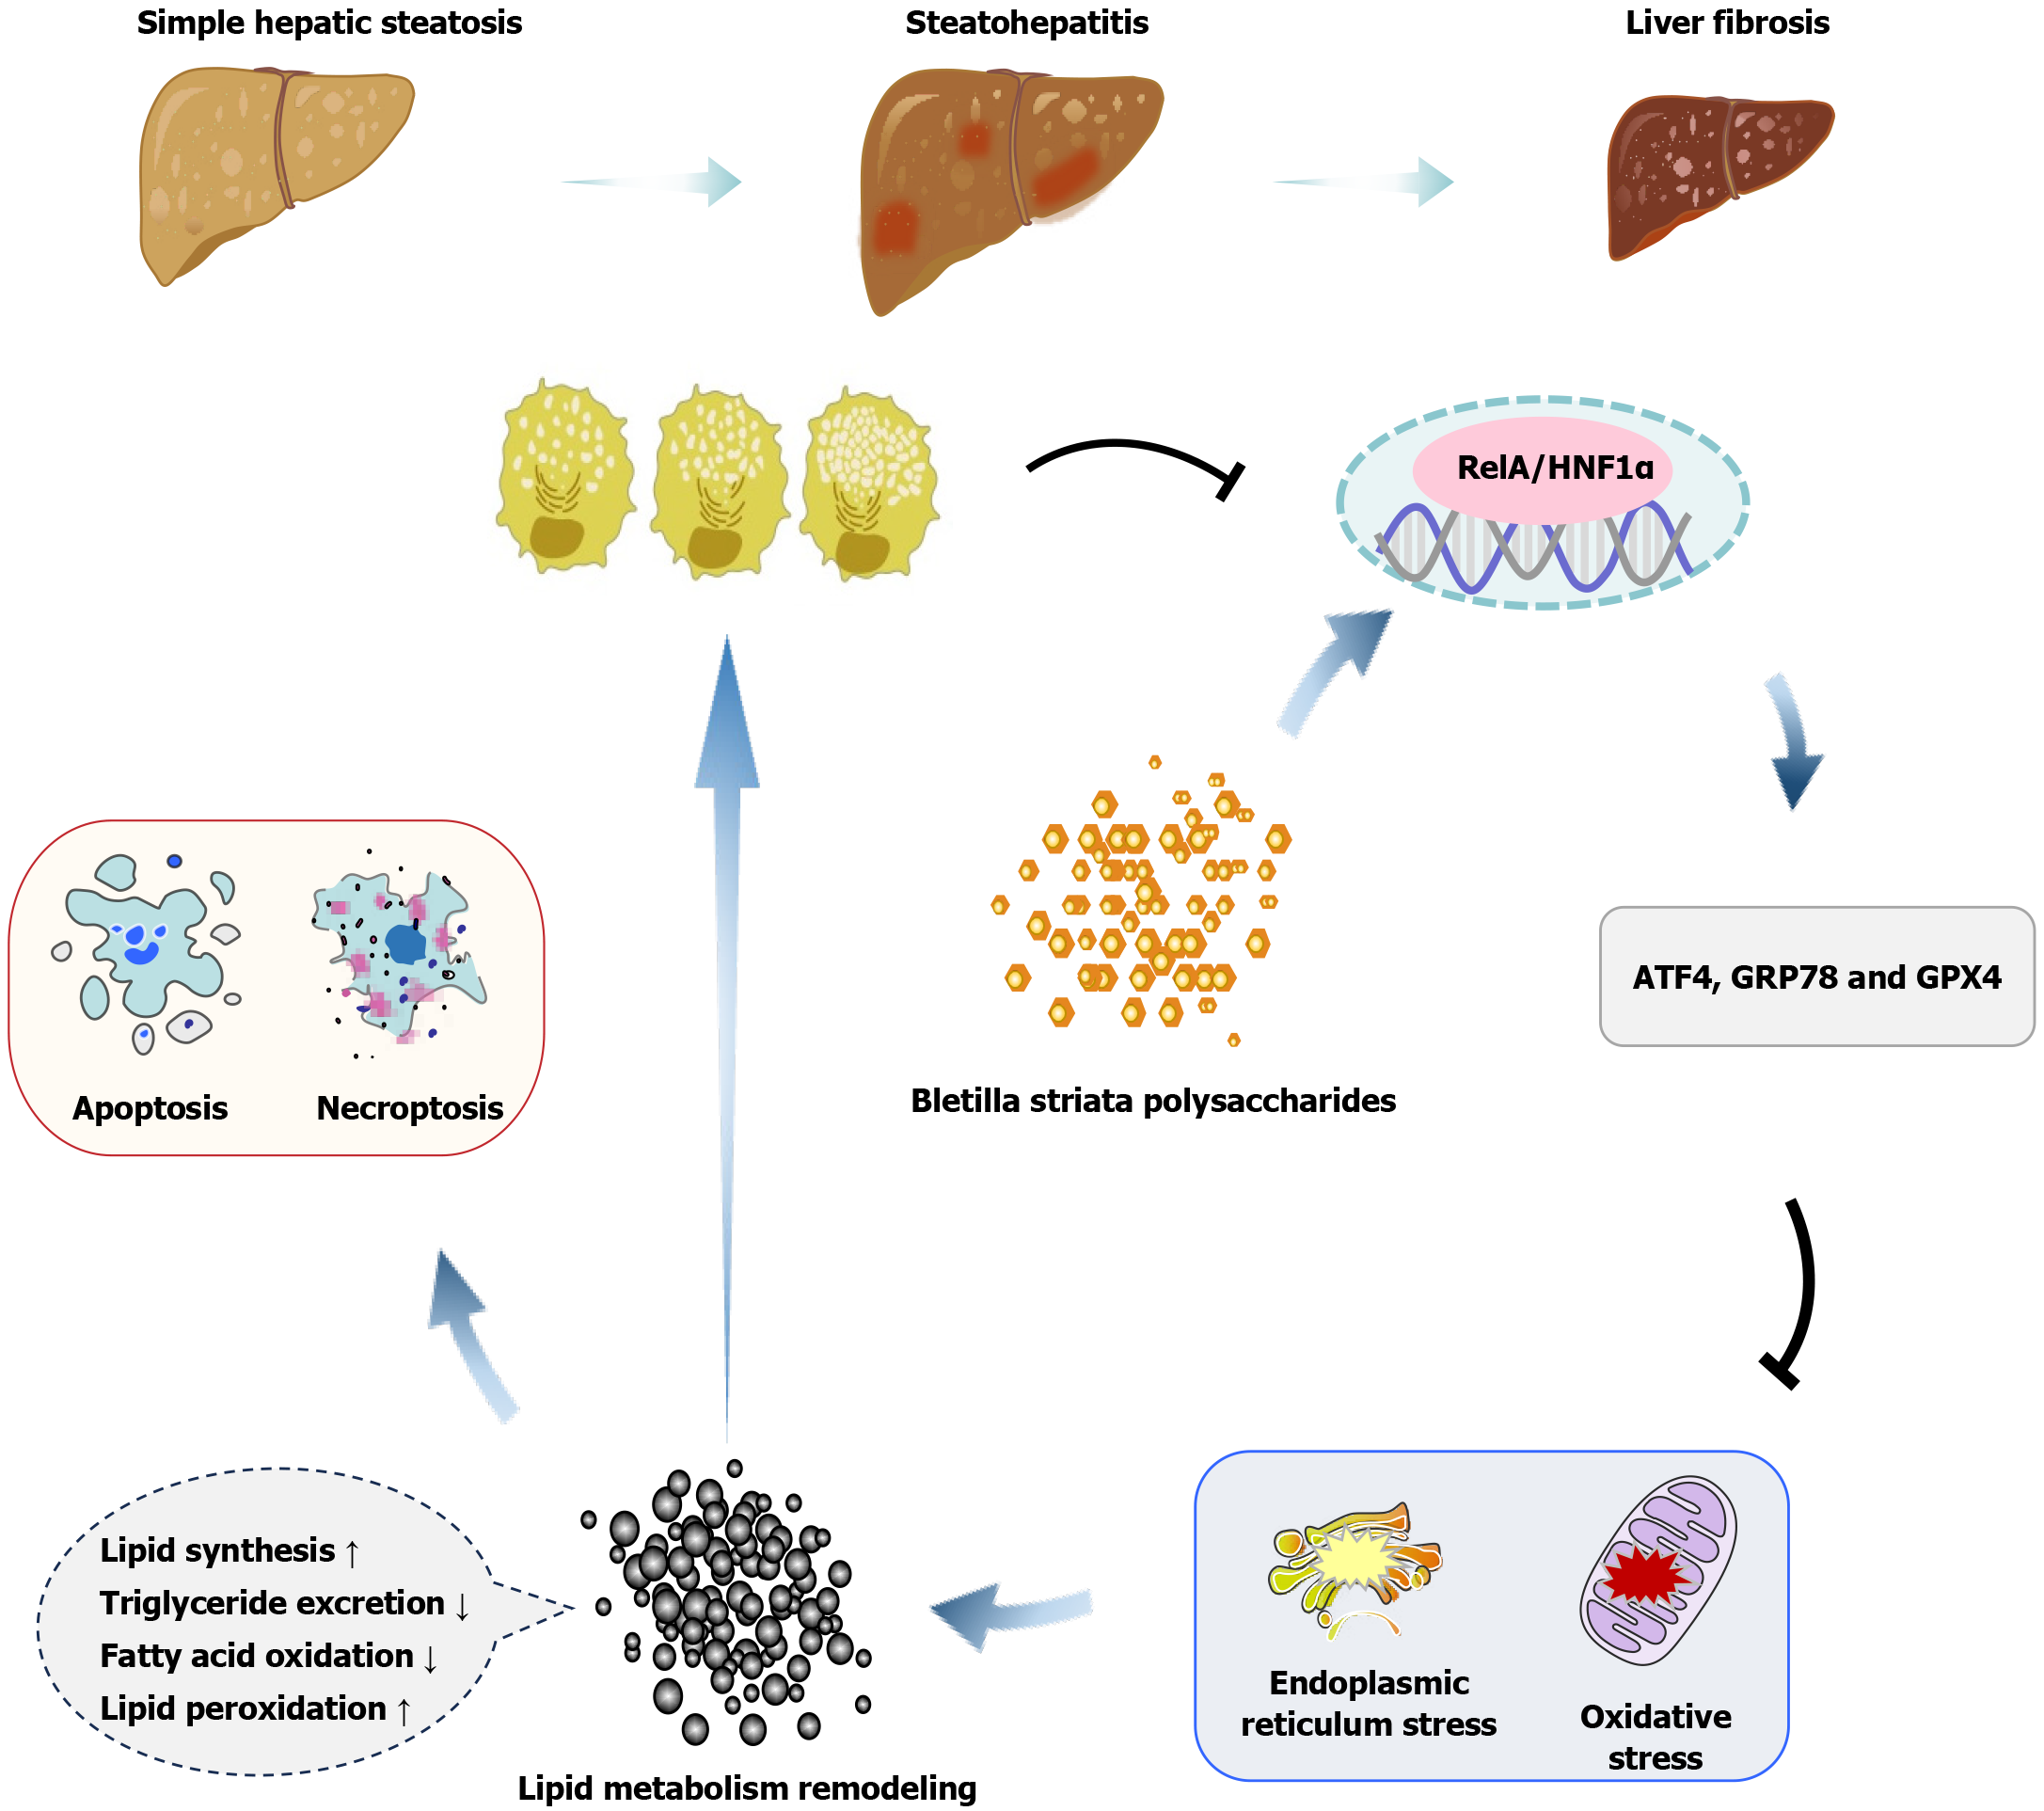
Figure 12 The mechanism of Bletilla striata polysaccharides in combating metabolic dysfunction-associated steatotic liver disease.
Bletilla striata polysaccharides alleviates metabolic dysfunction-associated steatotic liver disease (MASLD) by enhancing the nuclear factor kappa B p65/hepatocyte nuclear factor-1 alpha signaling in hepatocytes, remodeling endoplasmic reticulum stress and oxidative stress responses, mitigating the metabolic disorder, apoptosis, and necroptosis of hepatocytes, and reducing MASLD. GRP78: 78-kDa glucose-regulated protein; GPX4: Glutathione peroxidase 4; ATF4: Activating transcription factor 4; RelA: Nuclear factor kappa B p65.
- Citation: He YH, Ou LL, Jiang JL, Chen YF, Abudukeremu A, Xue Y, Mu MY, Zhong WW, Xu DL, Meng XY, Guan YQ. Bletilla striata polysaccharides alleviate metabolic dysfunction-associated steatotic liver disease through enhancing hepatocyte RelA/ HNF1α signaling. World J Gastroenterol 2025; 31(4): 93179
- URL: https://www.wjgnet.com/1007-9327/full/v31/i4/93179.htm
- DOI: https://dx.doi.org/10.3748/wjg.v31.i4.93179


