Copyright
©The Author(s) 2025.
World J Gastroenterol. Aug 14, 2025; 31(30): 109186
Published online Aug 14, 2025. doi: 10.3748/wjg.v31.i30.109186
Published online Aug 14, 2025. doi: 10.3748/wjg.v31.i30.109186
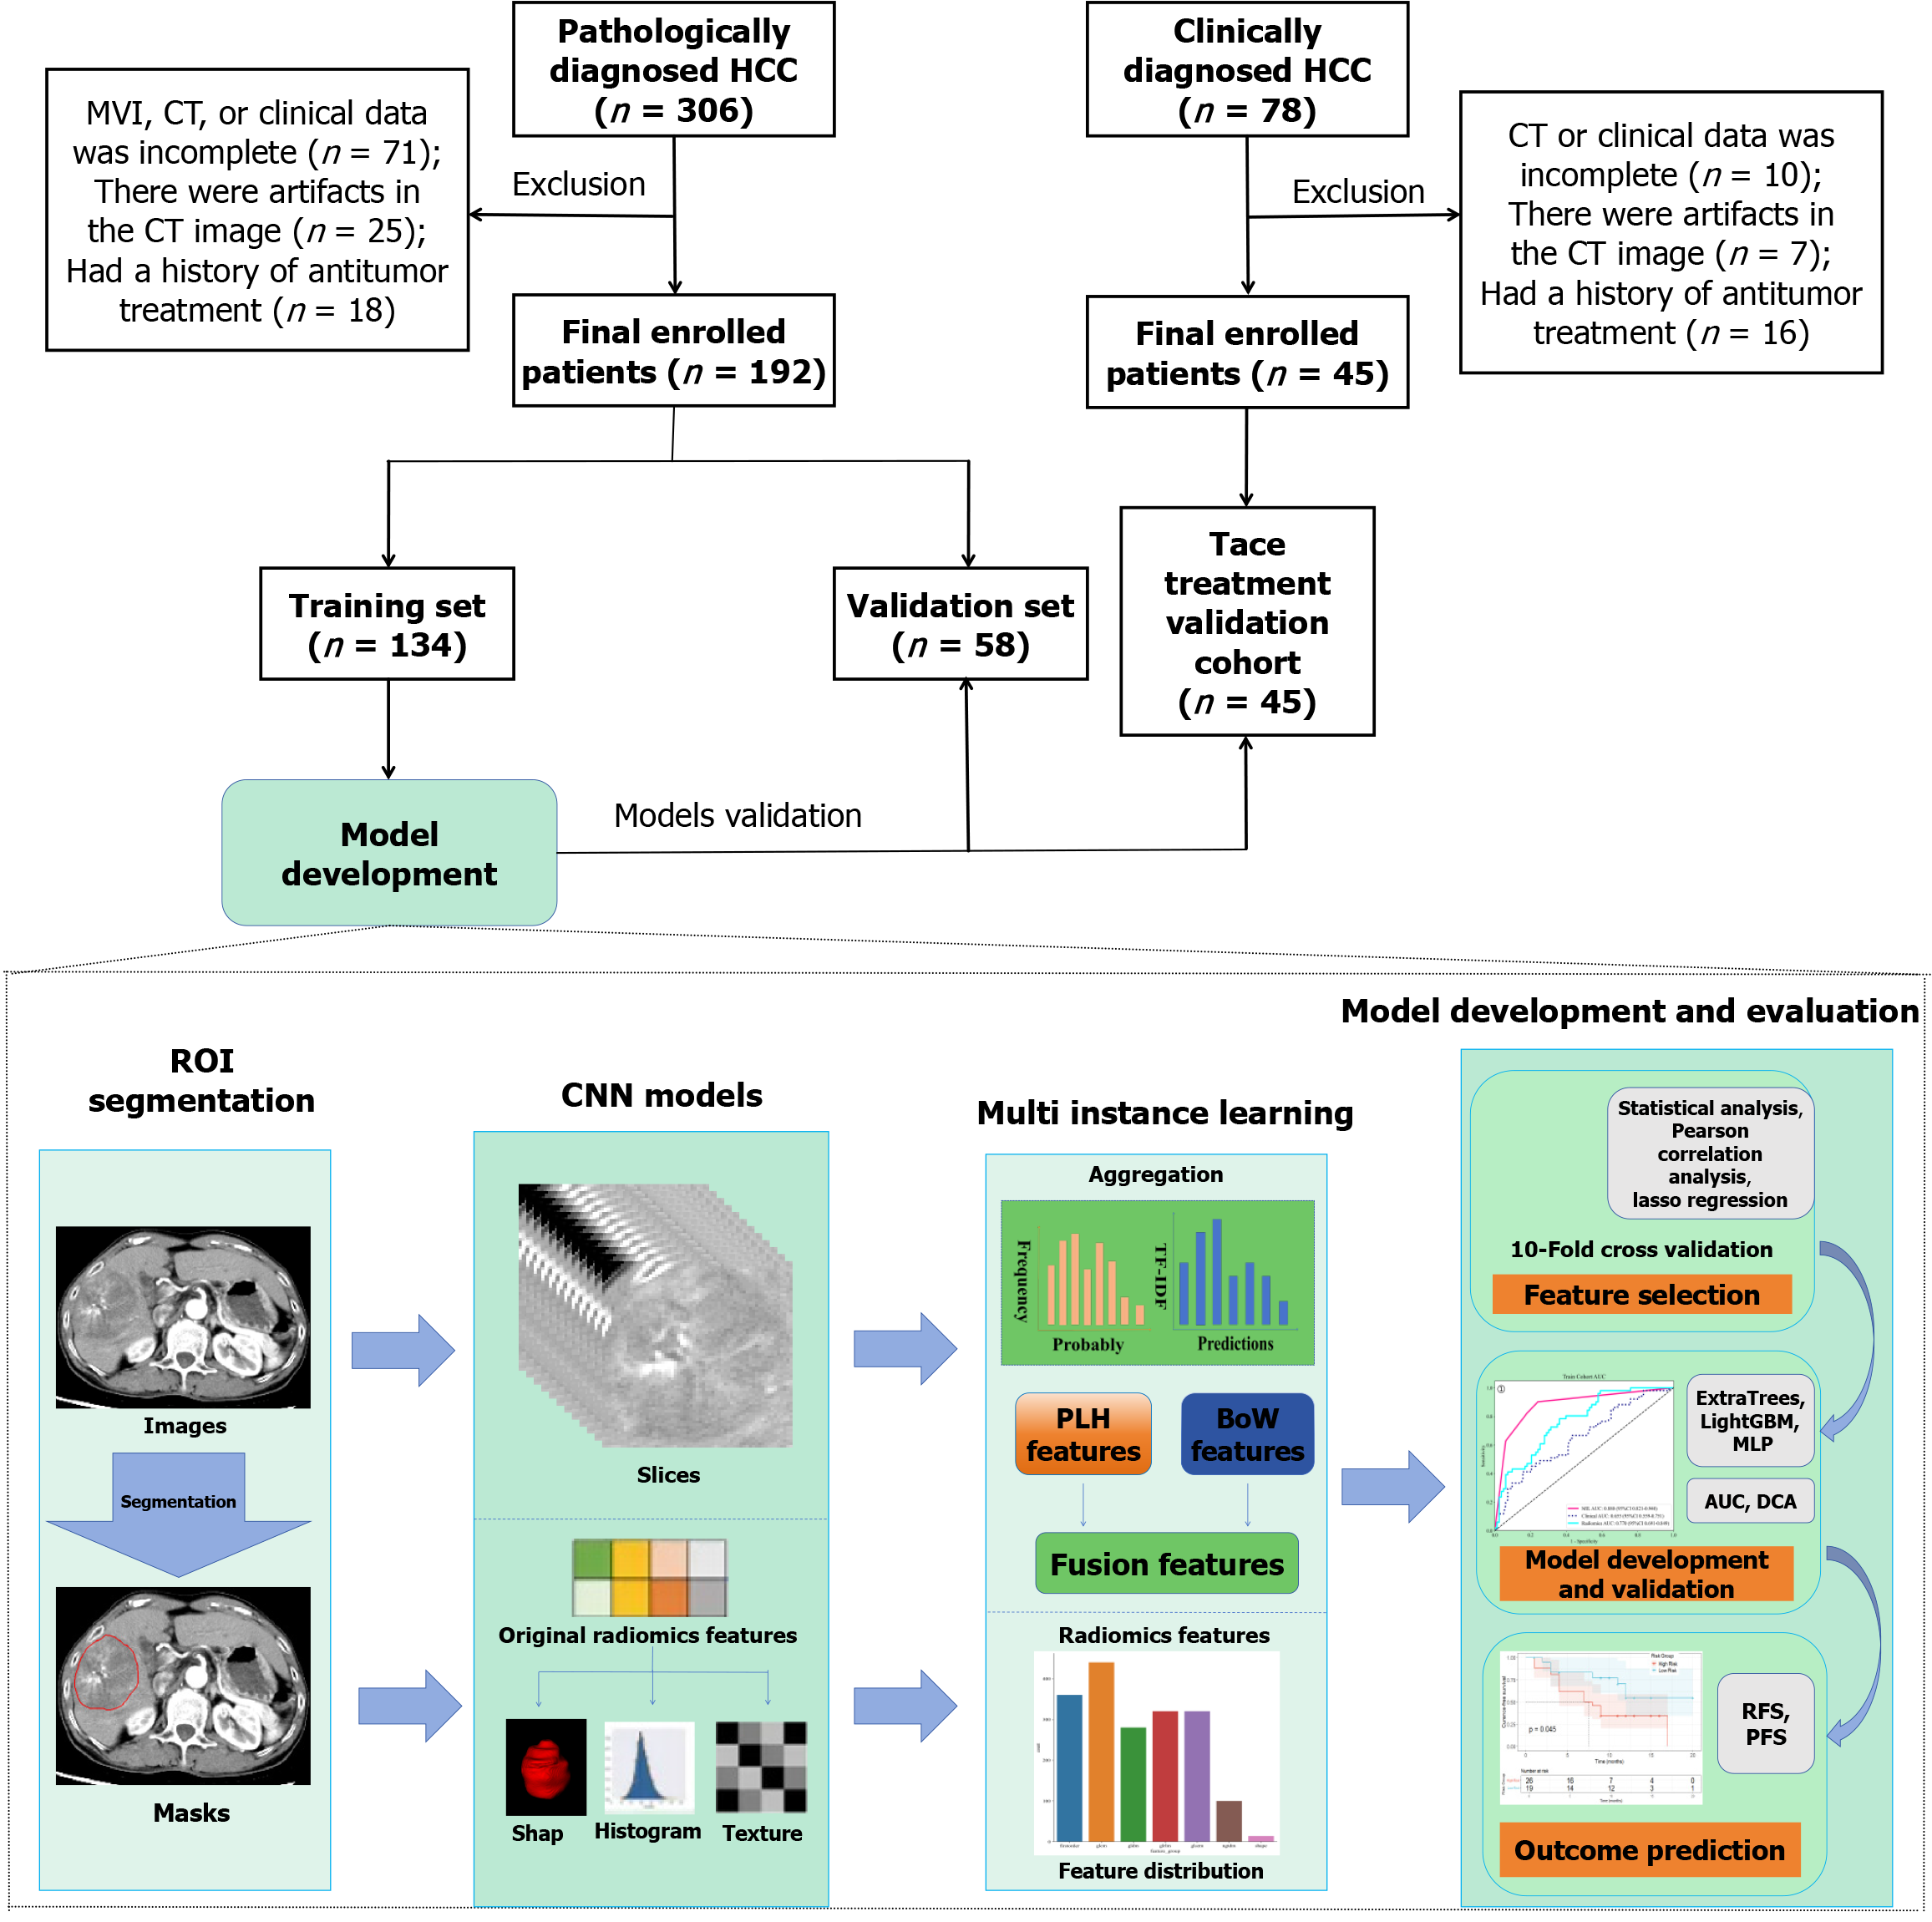
Figure 1 Study population and workflow.
MVI: Microvascular invasion; CT: Computed tomography; HCC: Hepatocellular carcinoma; ROI: Region of interest; CNN: Convolutional neural network; PLH: Predictive likelihood histogram; BoW: Bag-of-word; TF-IDF: Term frequency-inverse document frequency; MLP: Multilayer perceptron; AUC: Area under the curve; DCA: Decision curve analysis; RFS: Recurrence-free survival; PFS: Progression-free survival.
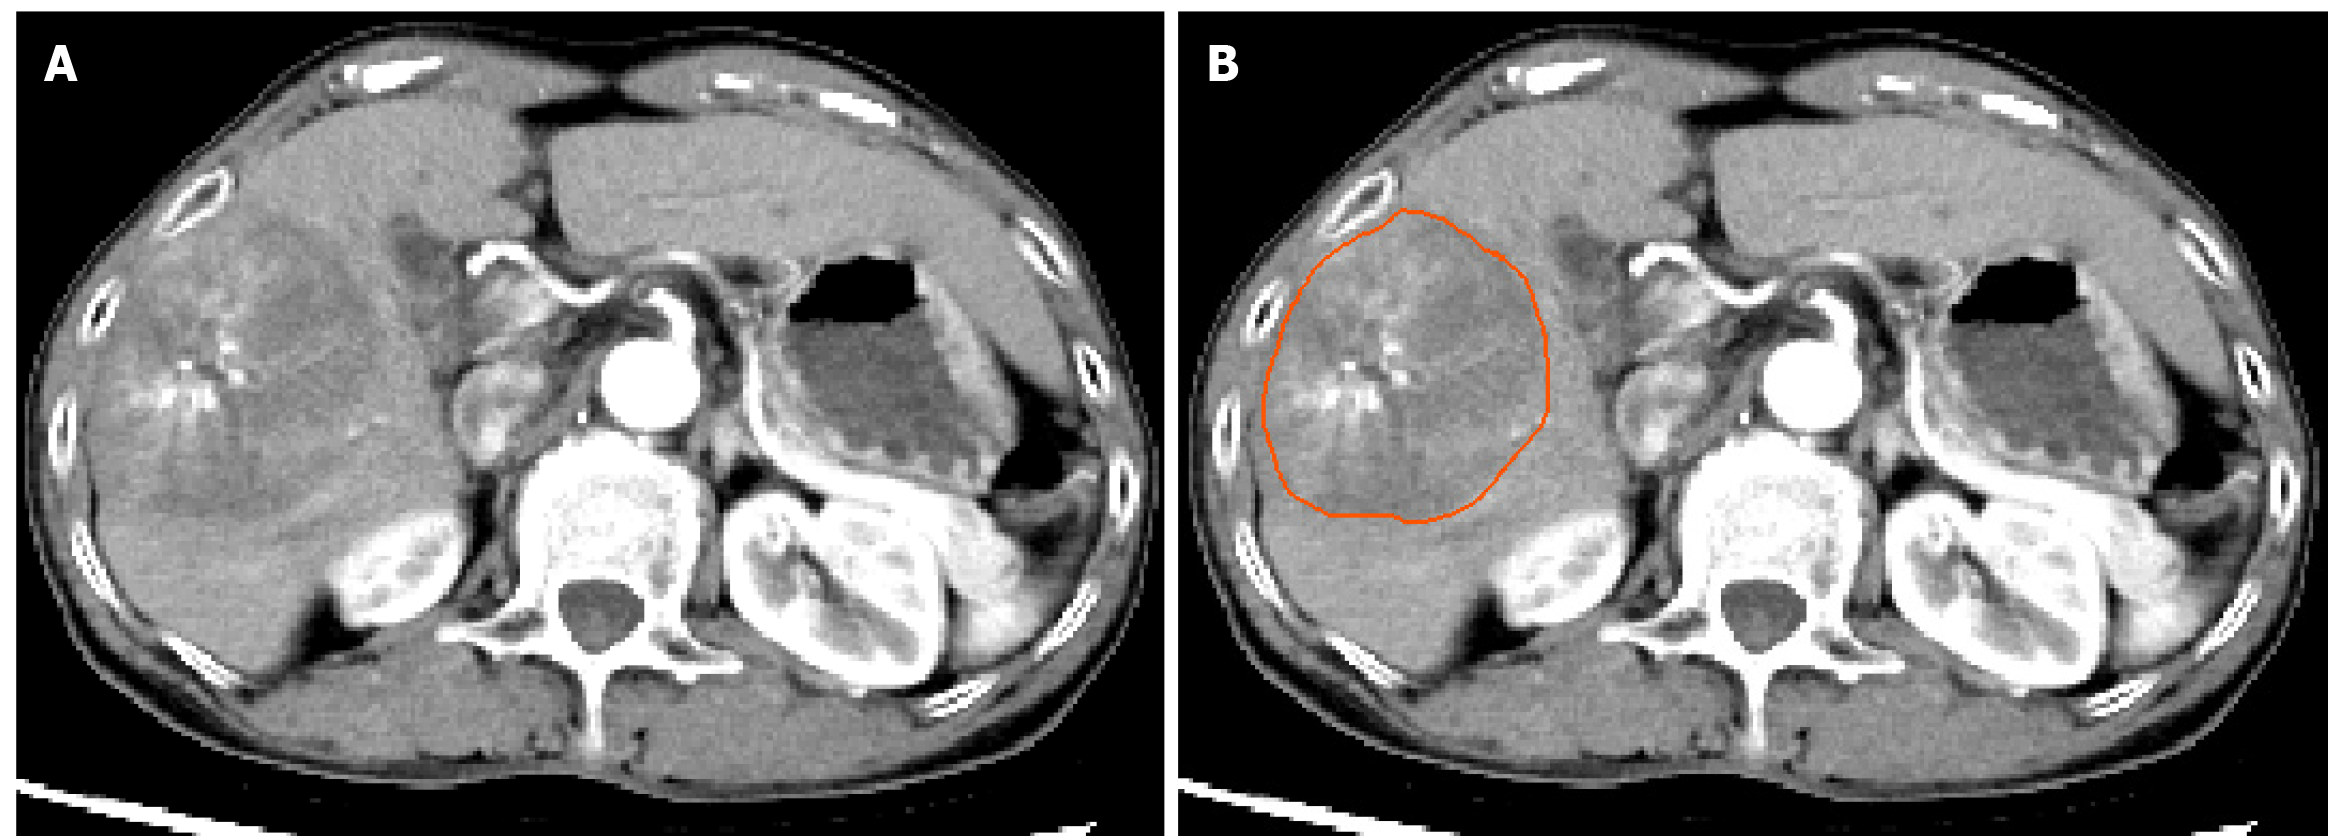
Figure 2 Tumor segmentation of a typical case.
A: The original computed tomography arterial phase image; B: The tumor segmentation using ITK-SNAP software.
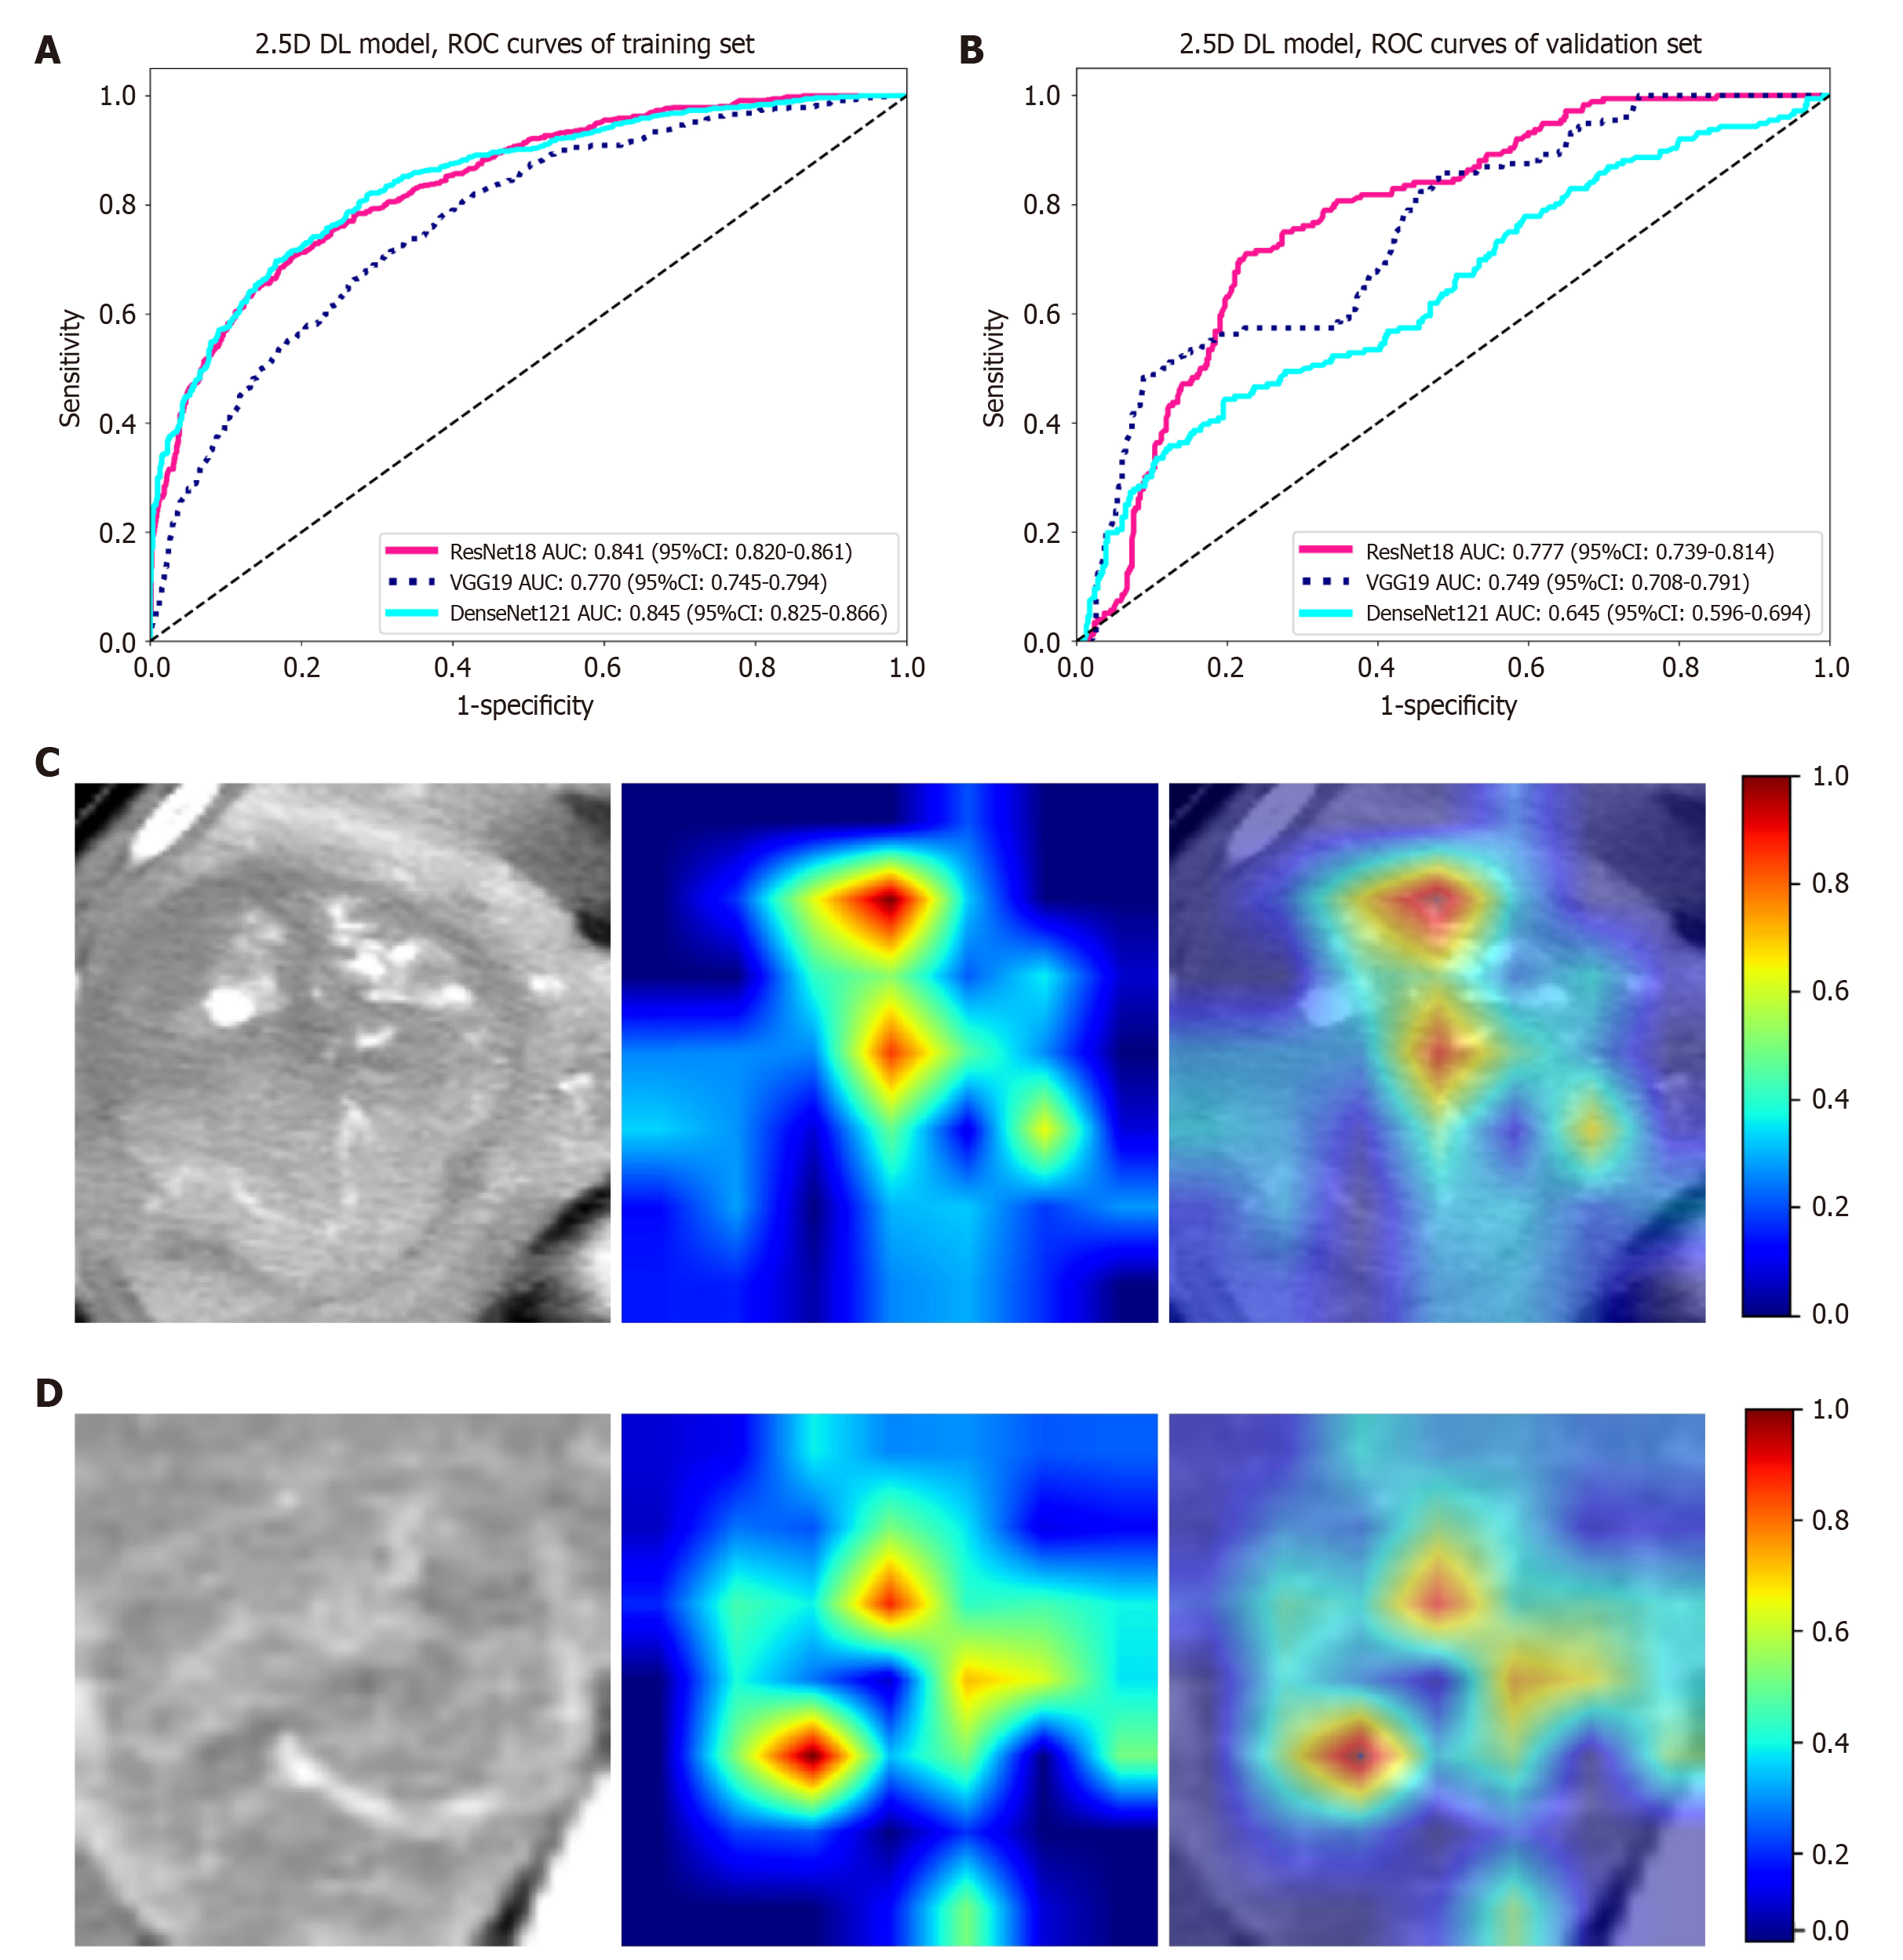
Figure 3 Receiver operating characteristic curves and gradient-weighted class activation mapping for slice-level prediction of models.
A: Receiver operating characteristic (ROC) curves of three deep learning models: ResNet18 (red), Visual Geometry Group 19 (VGG19) (blue), and DenseNet121 (cyan) in the training set; B: ROC curves of three deep learning models: ResNet18 (red), VGG19 (blue), and DenseNet121 (cyan) in the validation set; C and D: Gradient-weighted class activation mapping visualizations of two representative samples, which demonstrate how the models selectively focus on different image regions for prediction, thus enhancing the understanding of the models’ attention mechanisms in practical applications. 2.5D: 2.5-dimensional; DL: Deep learning; ROC: Receiver operating characteristic; AUC: Area under the curve; CI: Confidence interval; VGG19: Visual Geometry Group 19.
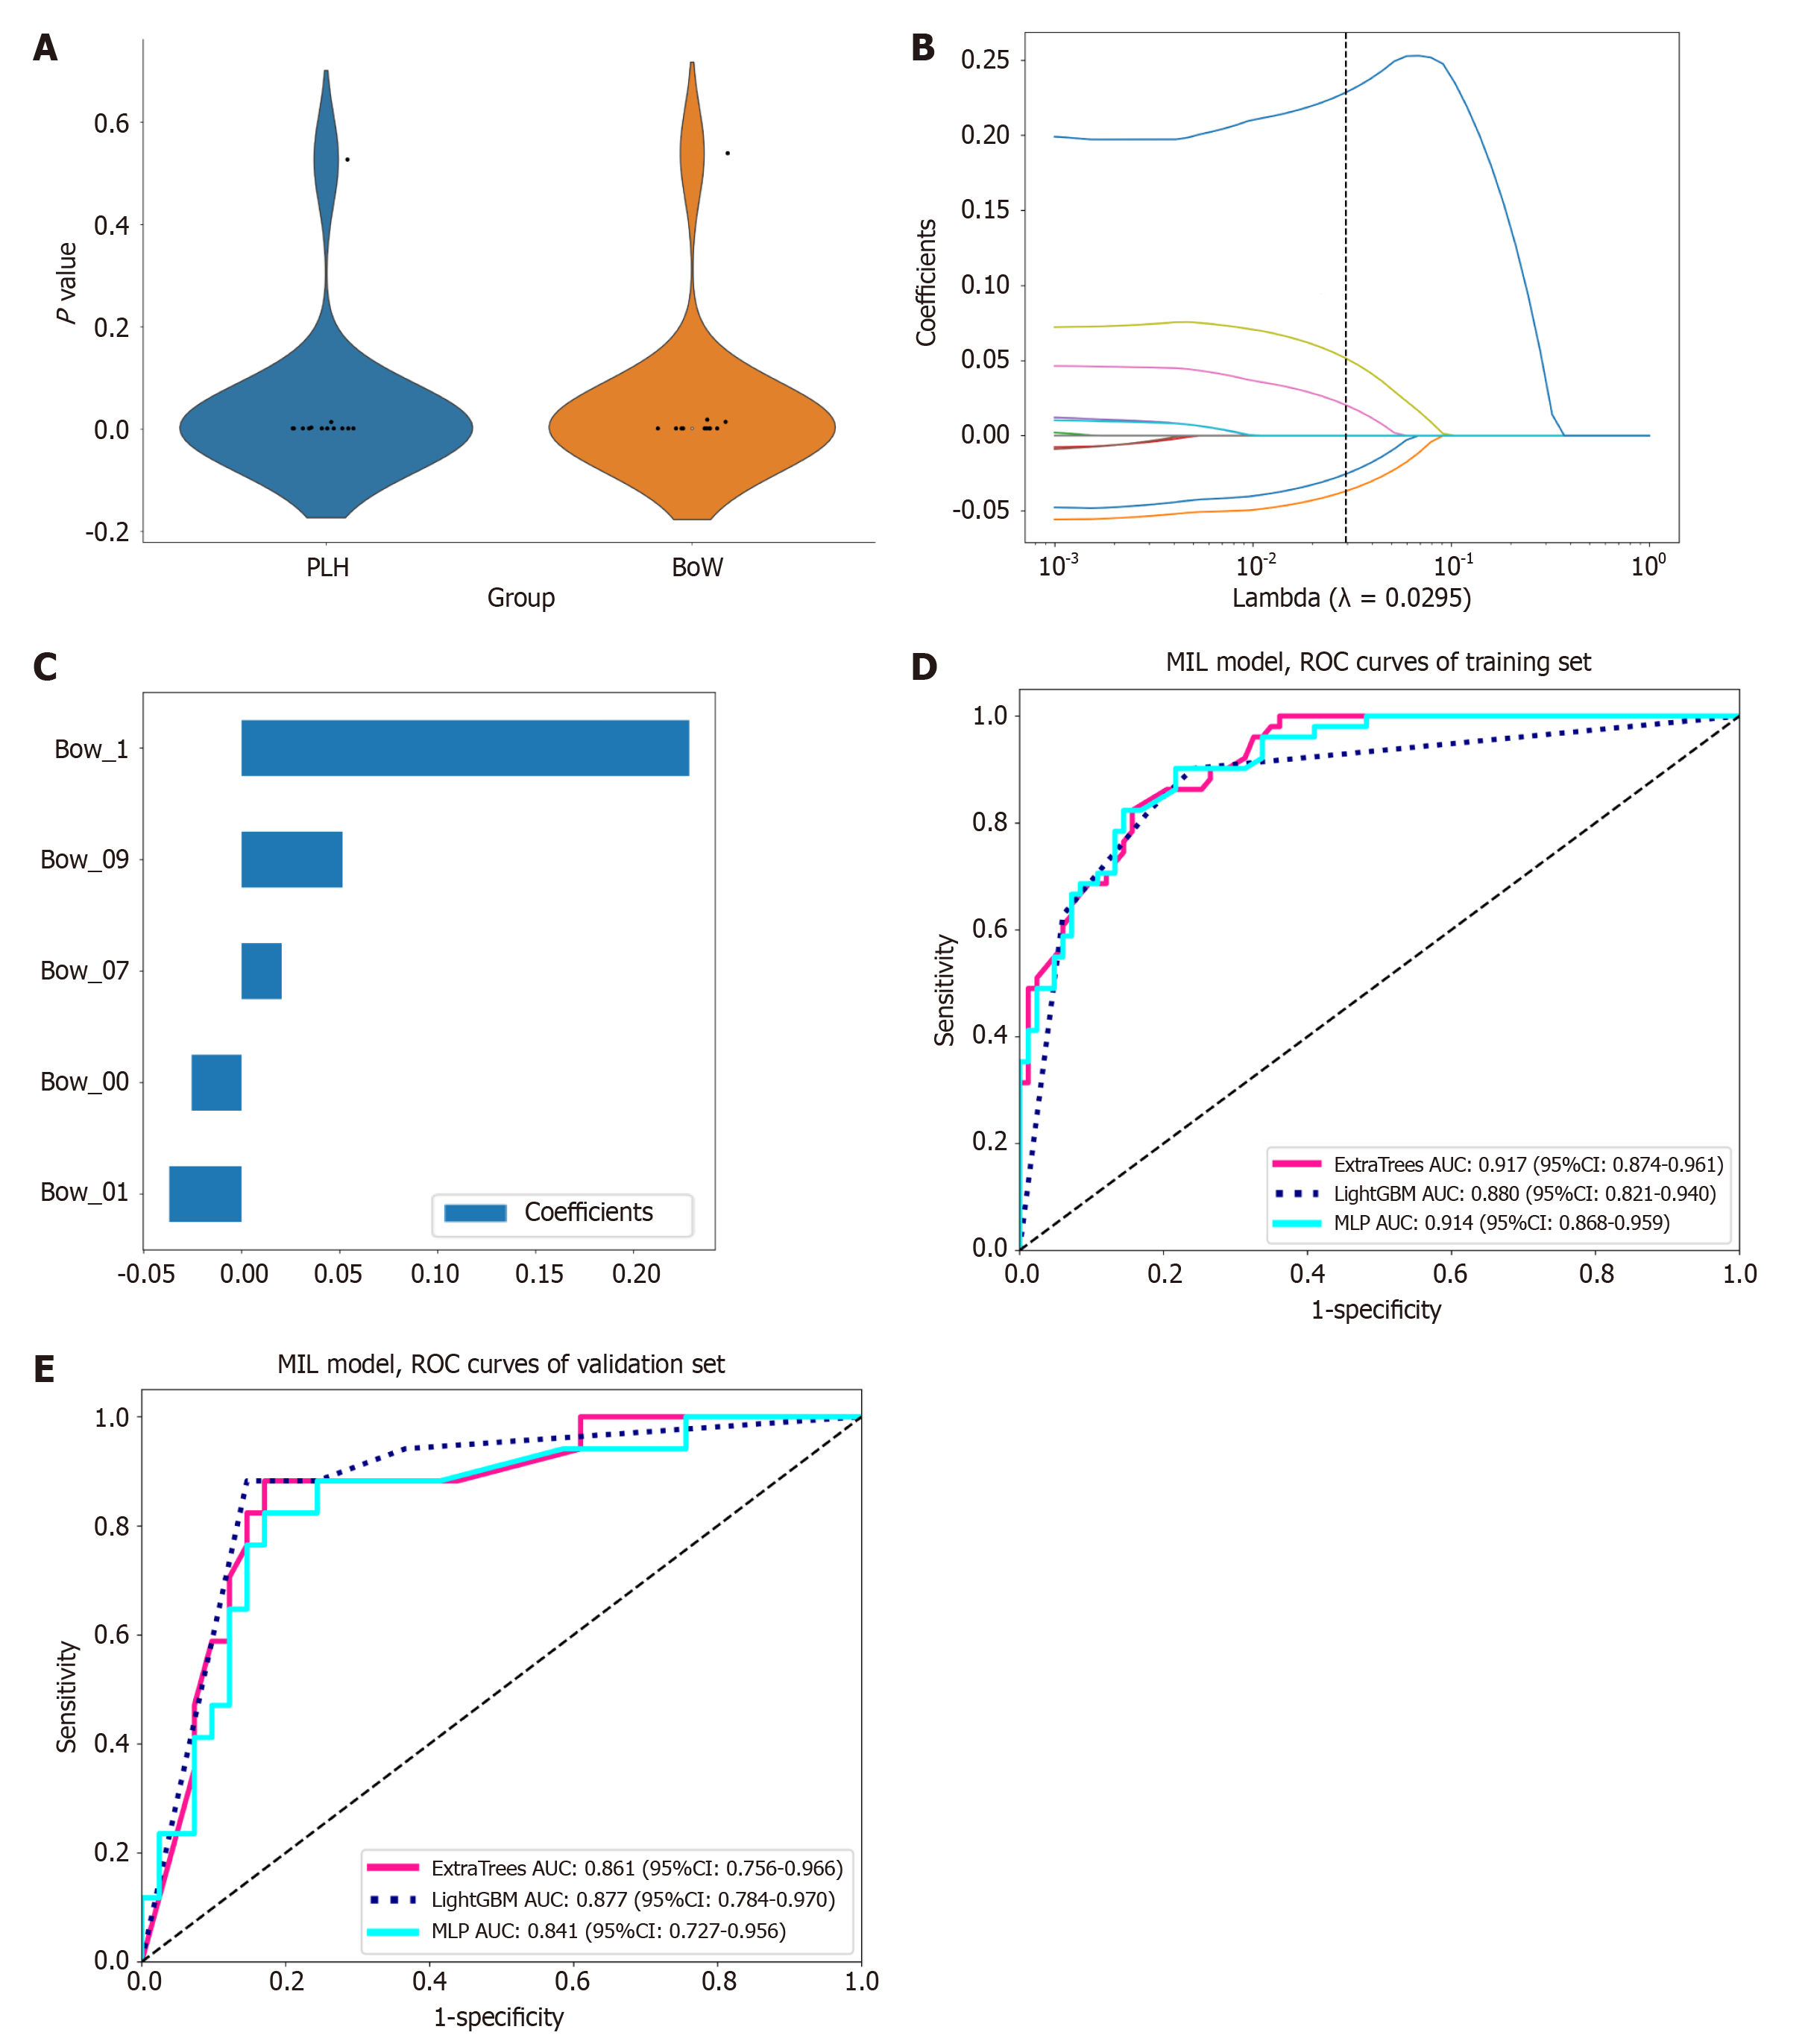
Figure 4 Feature selection and receiver operating characteristic curve results in multi-instance learning modeling.
A: The distribution of multi-instance feature differences between microvascular invasion (MVI)-positive and MVI-negative groups; B: Least absolute shrinkage and selection operator regression analysis under 10-fold cross-validation; C: Feature weights after dimensionality reduction; D: Receiver operating characteristic (ROC) curves of three models: ExtraTrees (red), multilayer perceptron (MLP) (cyan), and LightGBM (blue) in the training set; E: Shows ROC curves of three models: ExtraTrees (red), MLP (cyan), and LightGBM (blue) in the validation set. PLH: Predictive likelihood histogram; BoW: Bag-of-word; ROC: Receiver operating characteristic; MIL: Multi-instance; AUC: Area under the curve; MLP: Multi-layer perception.
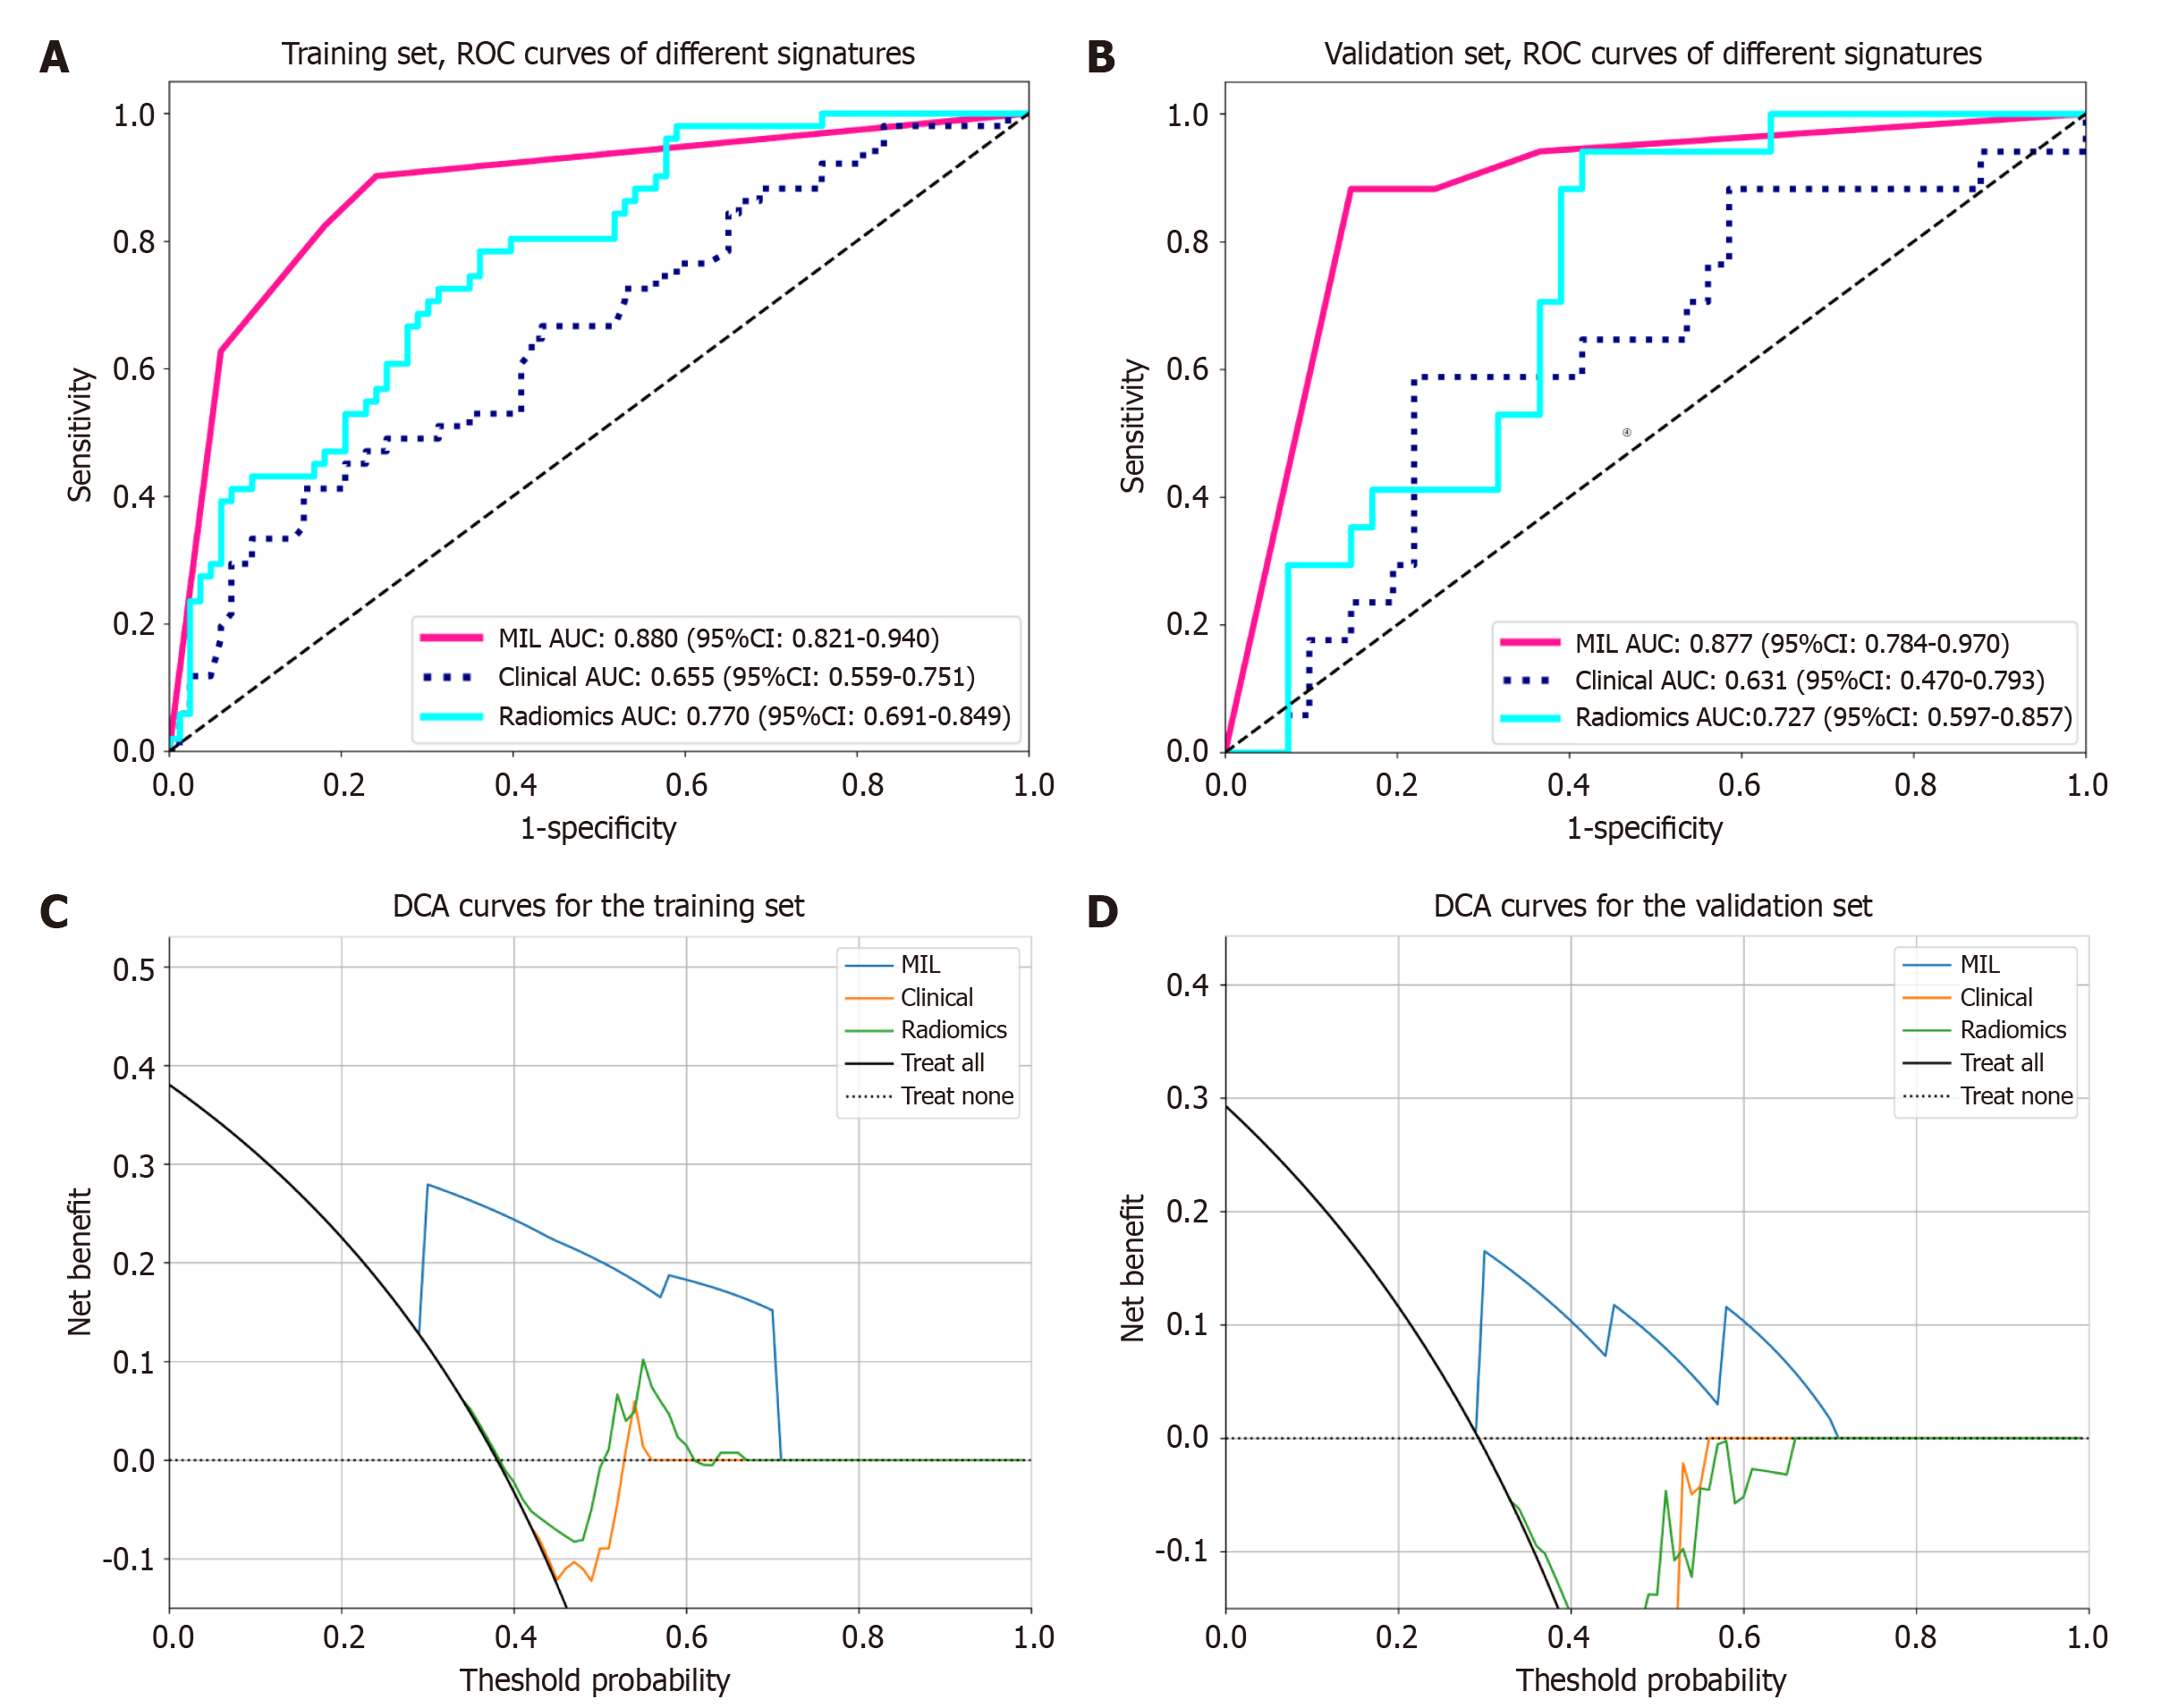
Figure 5 Receiver operating characteristic and decision curve analysis curves for different signatures.
A and B: The receiver operating characteristic curves for the training and validation sets, with red, cyan, and dark blue representing the multi-instance learning (MIL) signature, clinical signature, and radiomics signature, respectively; C and D: The decision curve analysis curves for the training and validation sets, with blue, yellow, and green representing the MIL signature, clinical signature, and radiomics signature, respectively. The results showed that the MIL signature consistently demonstrates better clinical net benefit than the clinical signature and radiomics signature. ROC: Receiver operating characteristic; MIL: Multi-instance; AUC: Area under the curve; DCA: Decision curve analysis.
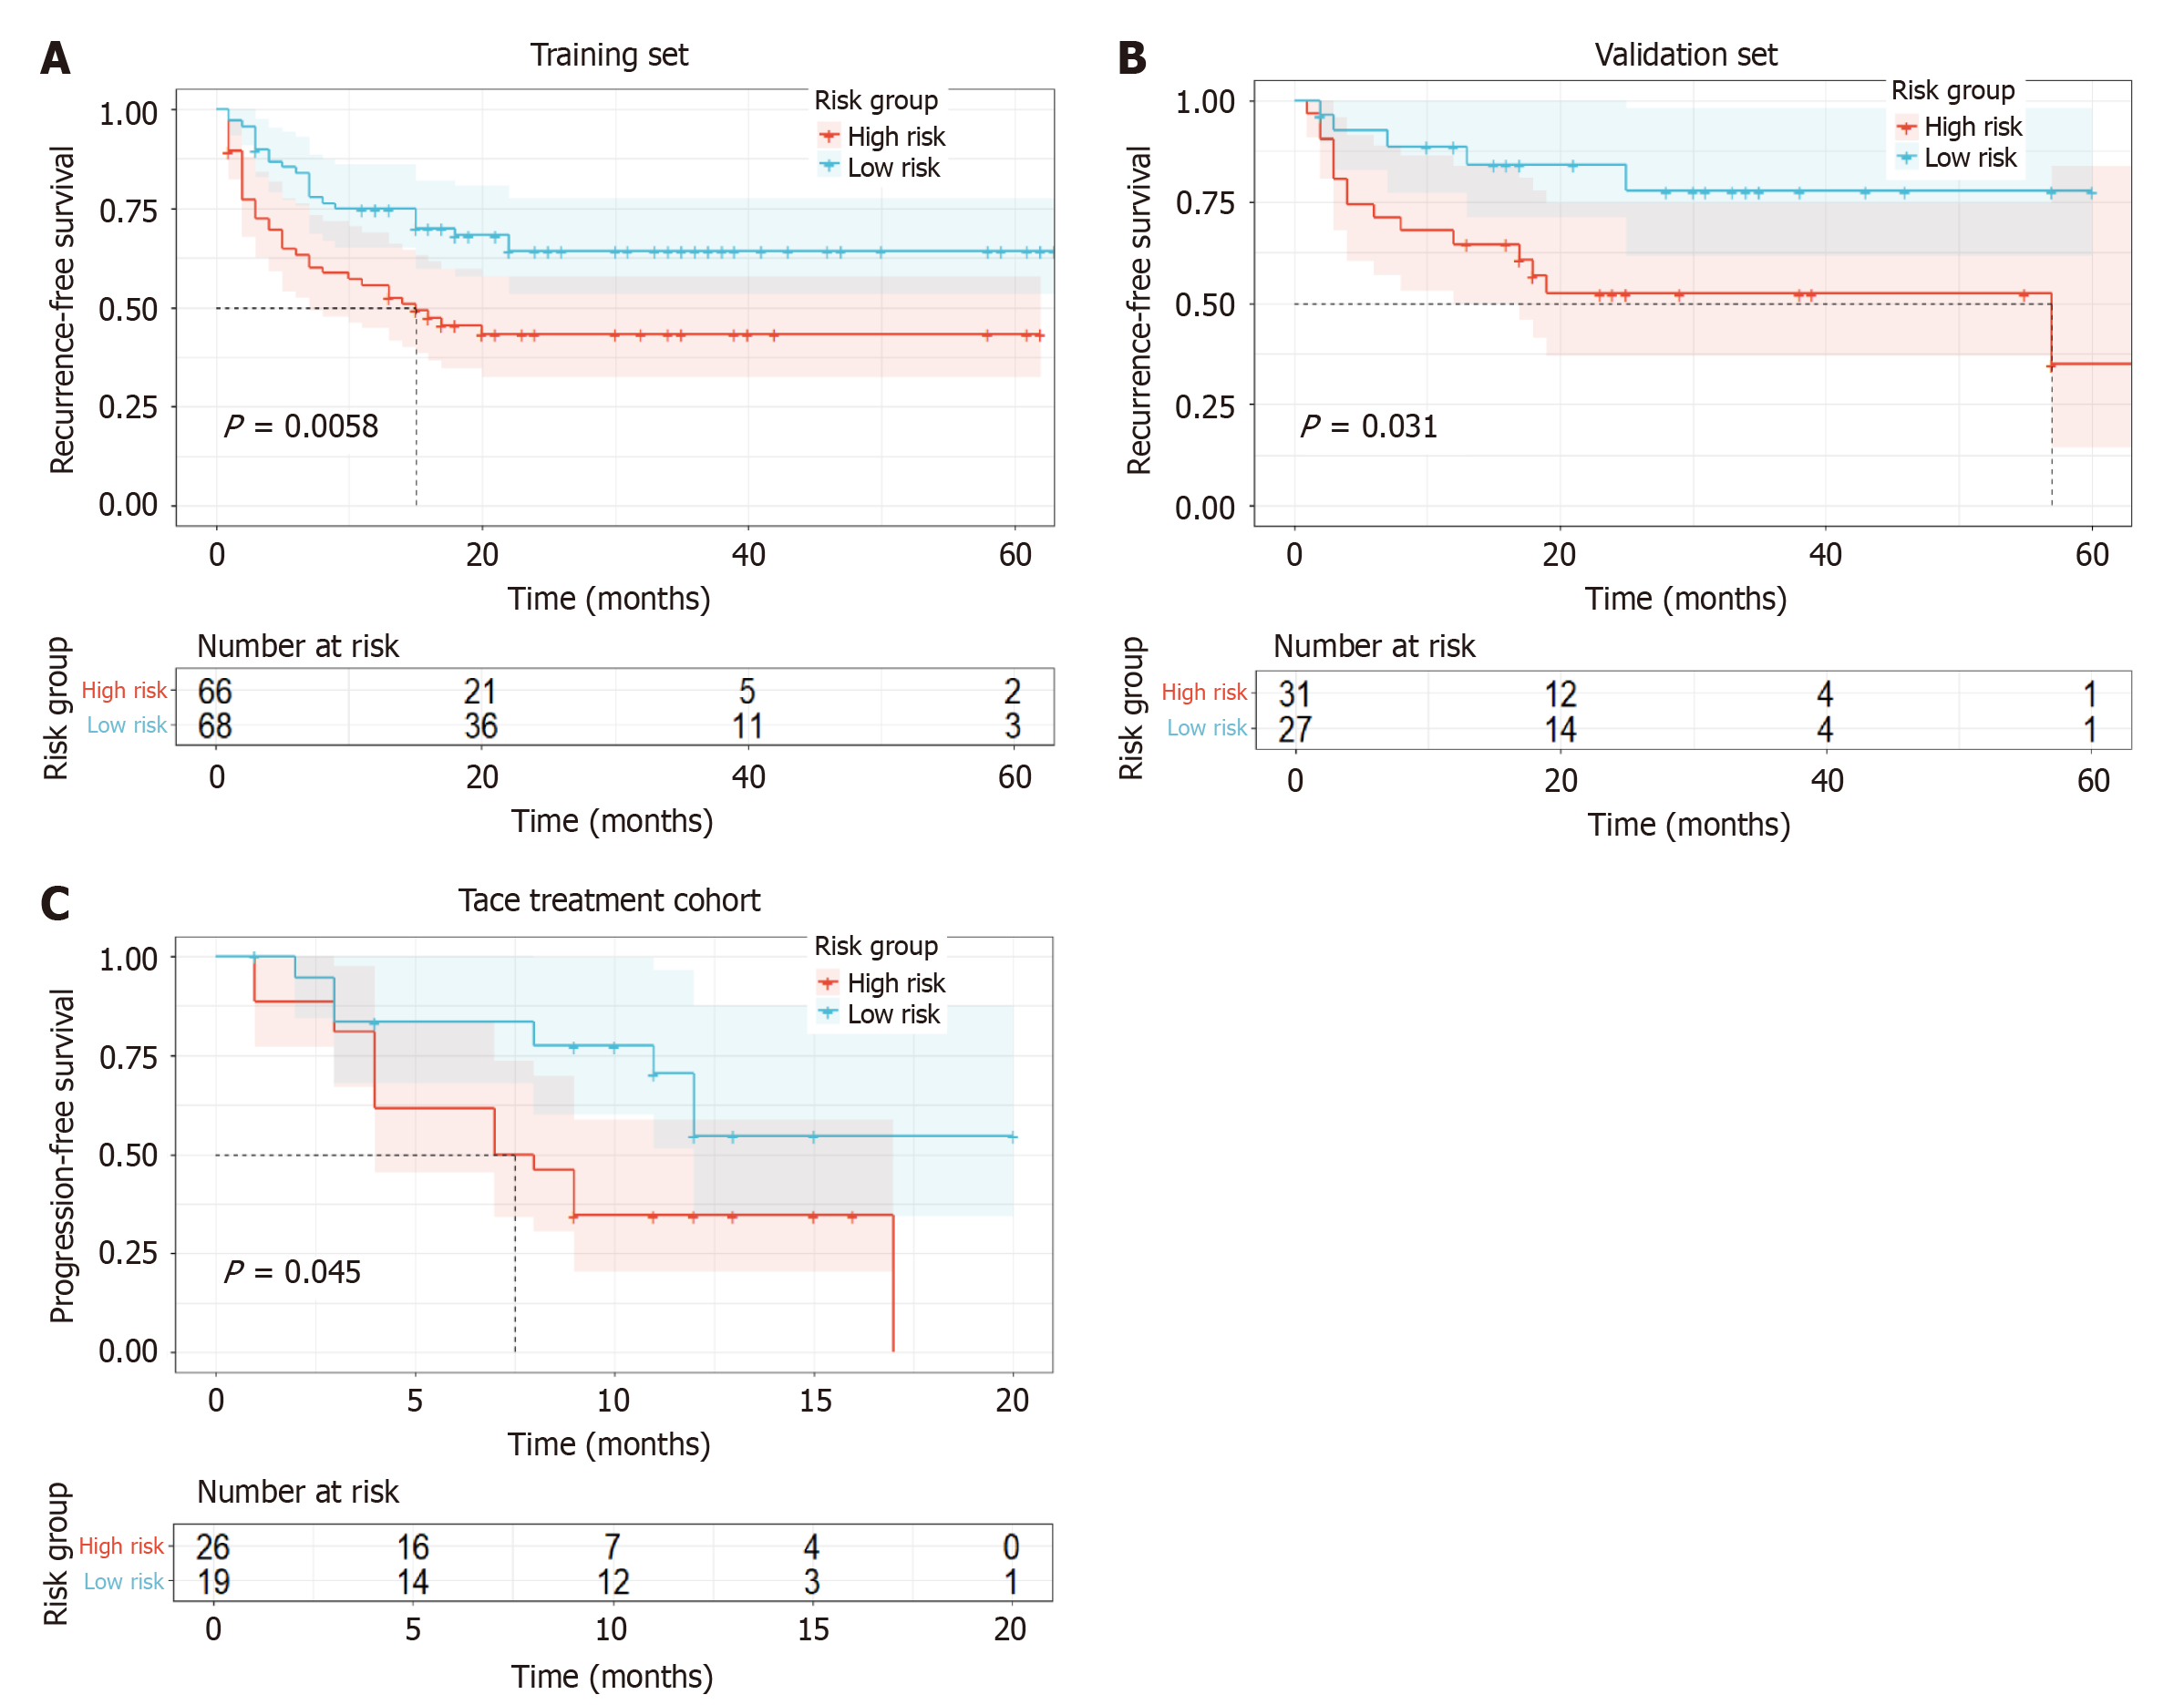
Figure 6 Kaplan-Meier curves of the hepatocellular carcinoma curative resection cohort and transcatheter arterial chemoembolization treatment cohort.
A: Training set; B: Validation set; C: Transcatheter arterial chemoembolization treatment cohort. Each cohort showed that recurrence-free survival/progression-free survival of high-risk patients was significantly shorter than that of low-risk patients (P < 0.05). TACE: Transcatheter arterial chemoembolization.
- Citation: Cen YY, Nong HY, Huang XX, Lu XX, Pu CH, Huang LH, Zheng XJ, Pan ZL, Huang Y, Ding K, Huang DY. Computed tomography-based deep learning and multi-instance learning for predicting microvascular invasion and prognosis in hepatocellular carcinoma. World J Gastroenterol 2025; 31(30): 109186
- URL: https://www.wjgnet.com/1007-9327/full/v31/i30/109186.htm
- DOI: https://dx.doi.org/10.3748/wjg.v31.i30.109186


