Copyright
©The Author(s) 2025.
World J Gastroenterol. Jan 21, 2025; 31(3): 95207
Published online Jan 21, 2025. doi: 10.3748/wjg.v31.i3.95207
Published online Jan 21, 2025. doi: 10.3748/wjg.v31.i3.95207
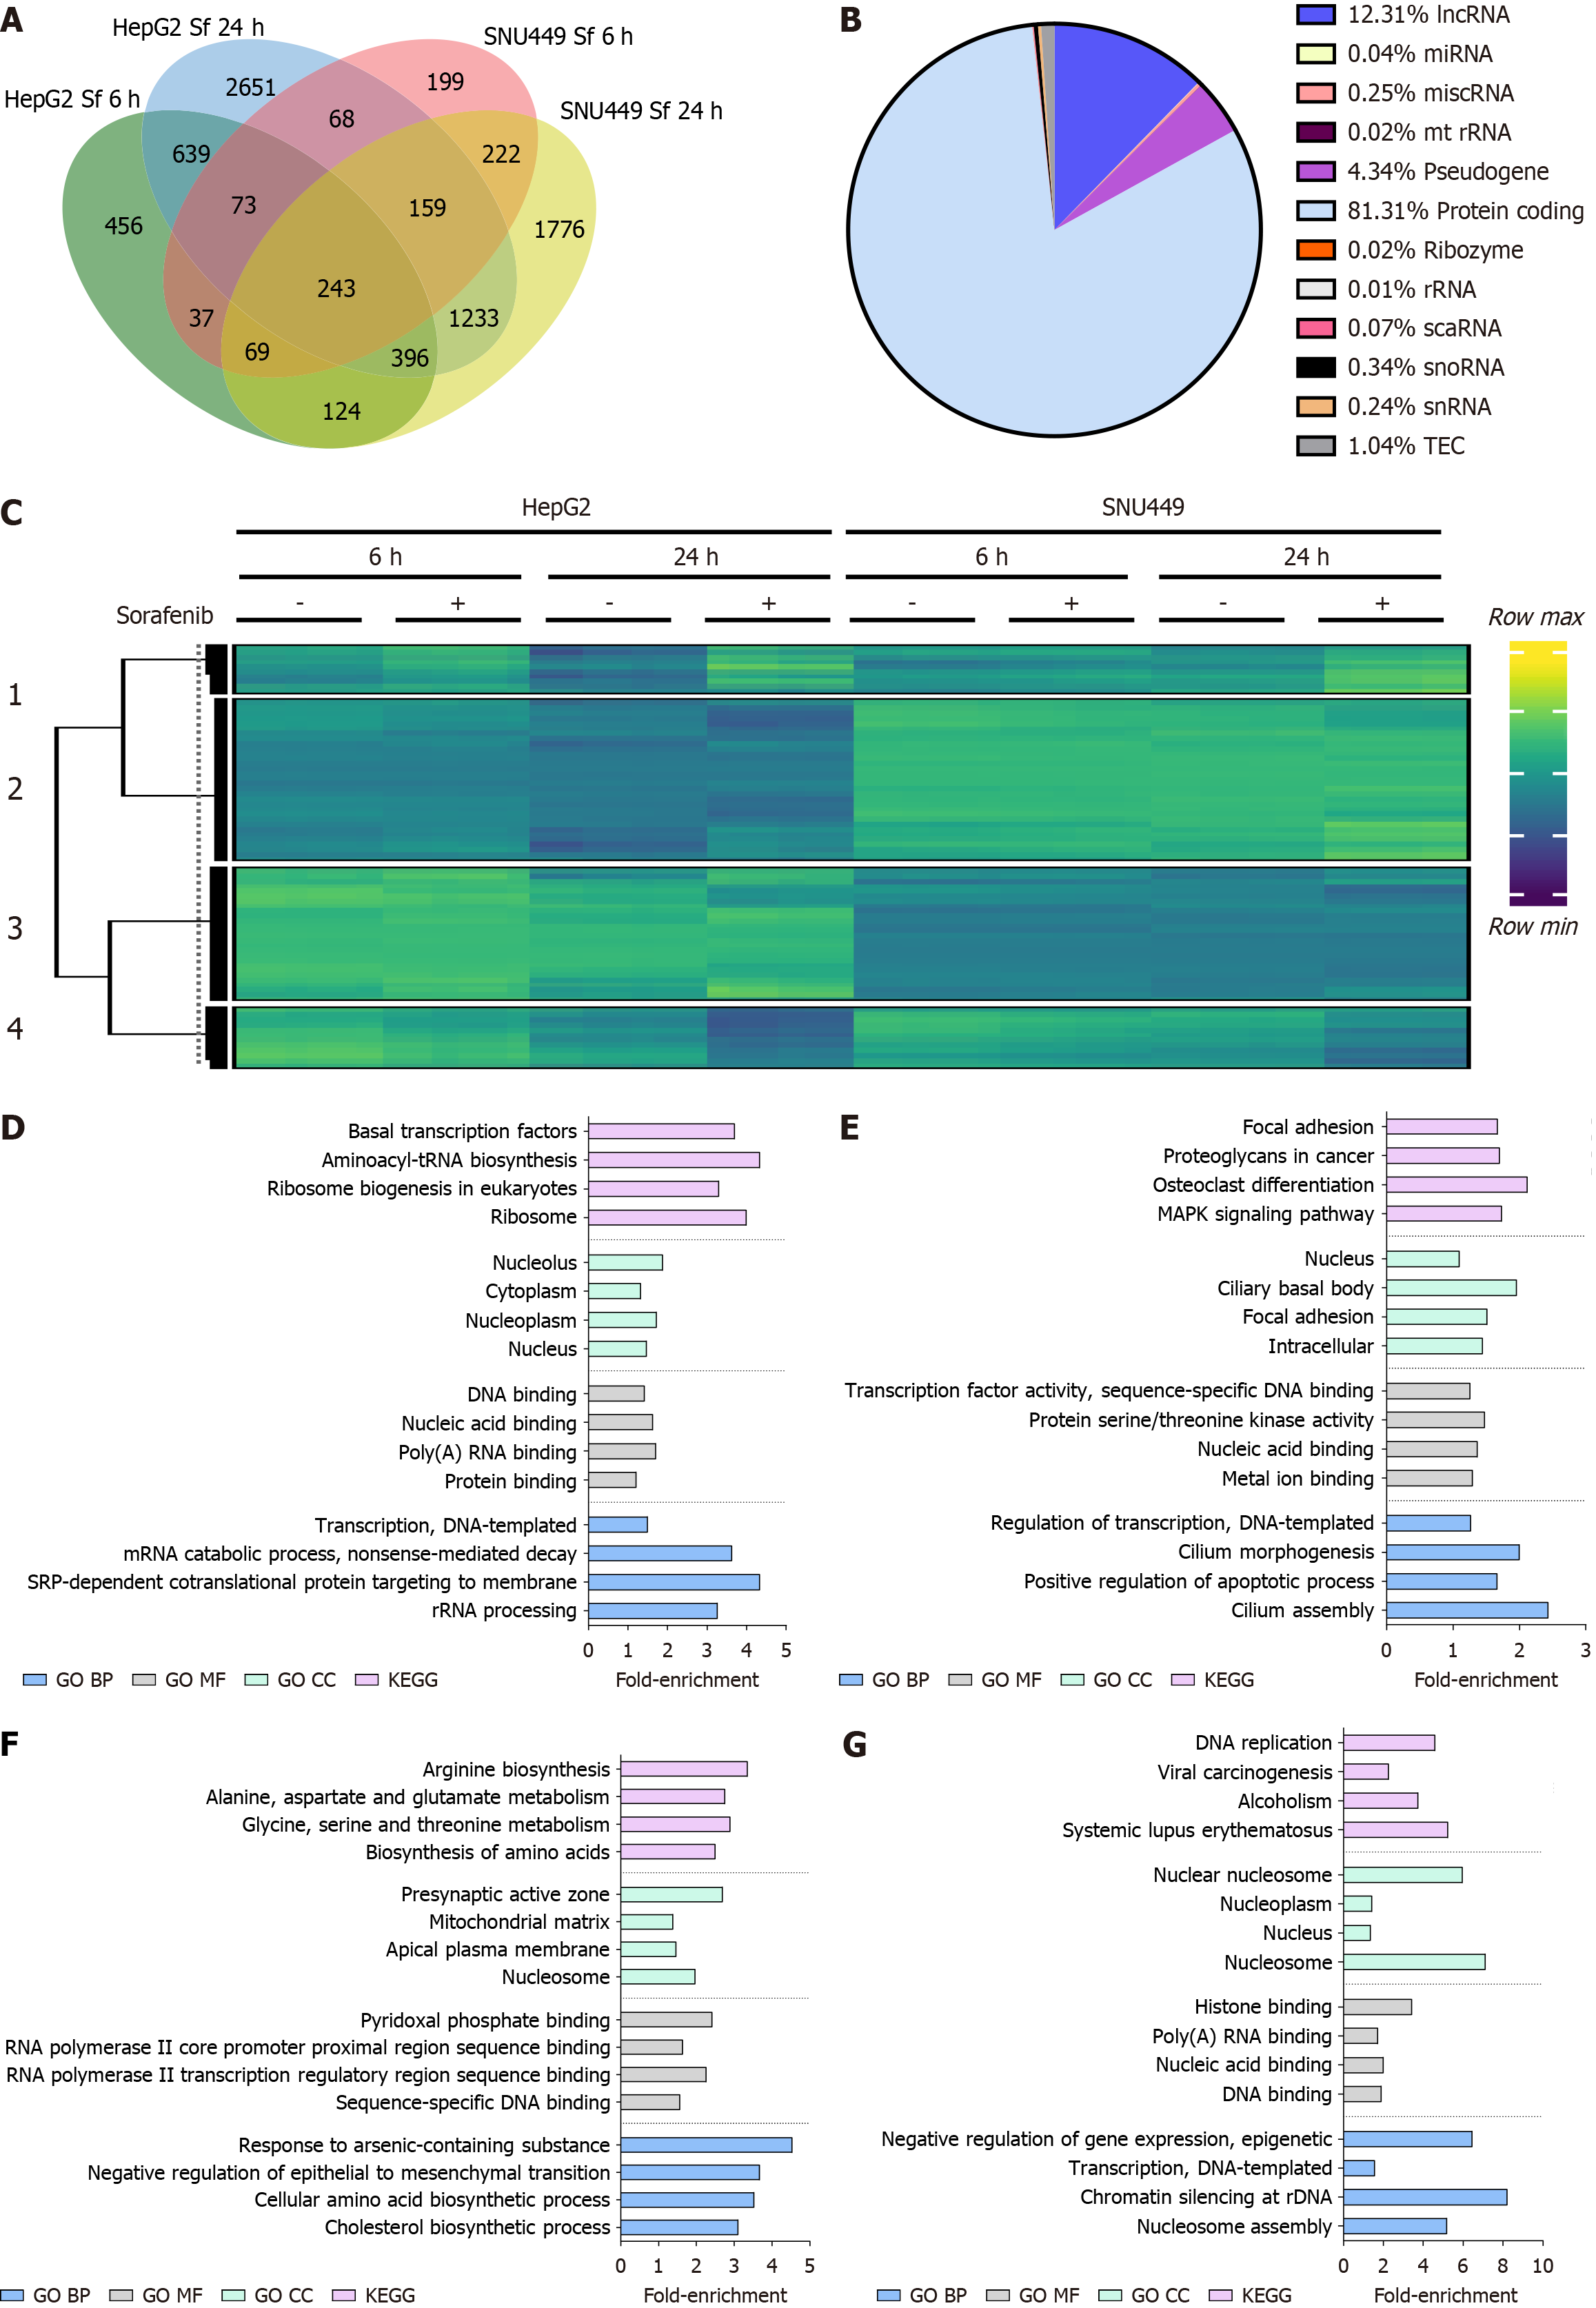
Figure 1 Expression profile of long RNA species and enrichment analysis.
A: Venn diagram of differentially expressed (DE) genes in HepG2 and SNU449 cells treated with Sorafenib for 6 and 24 hours; B: Pie chart showing identification of RNA species; C: Heatmap of the 8345 DE genes grouped into 4 row clusters; D: Top 4 Gene Ontology terms and Kyoto Encyclopedia of Genes and Genome pathways in cluster 1; E: Cluster 2; F: Cluster 3; G: Cluster 4 identified in the heatmap.
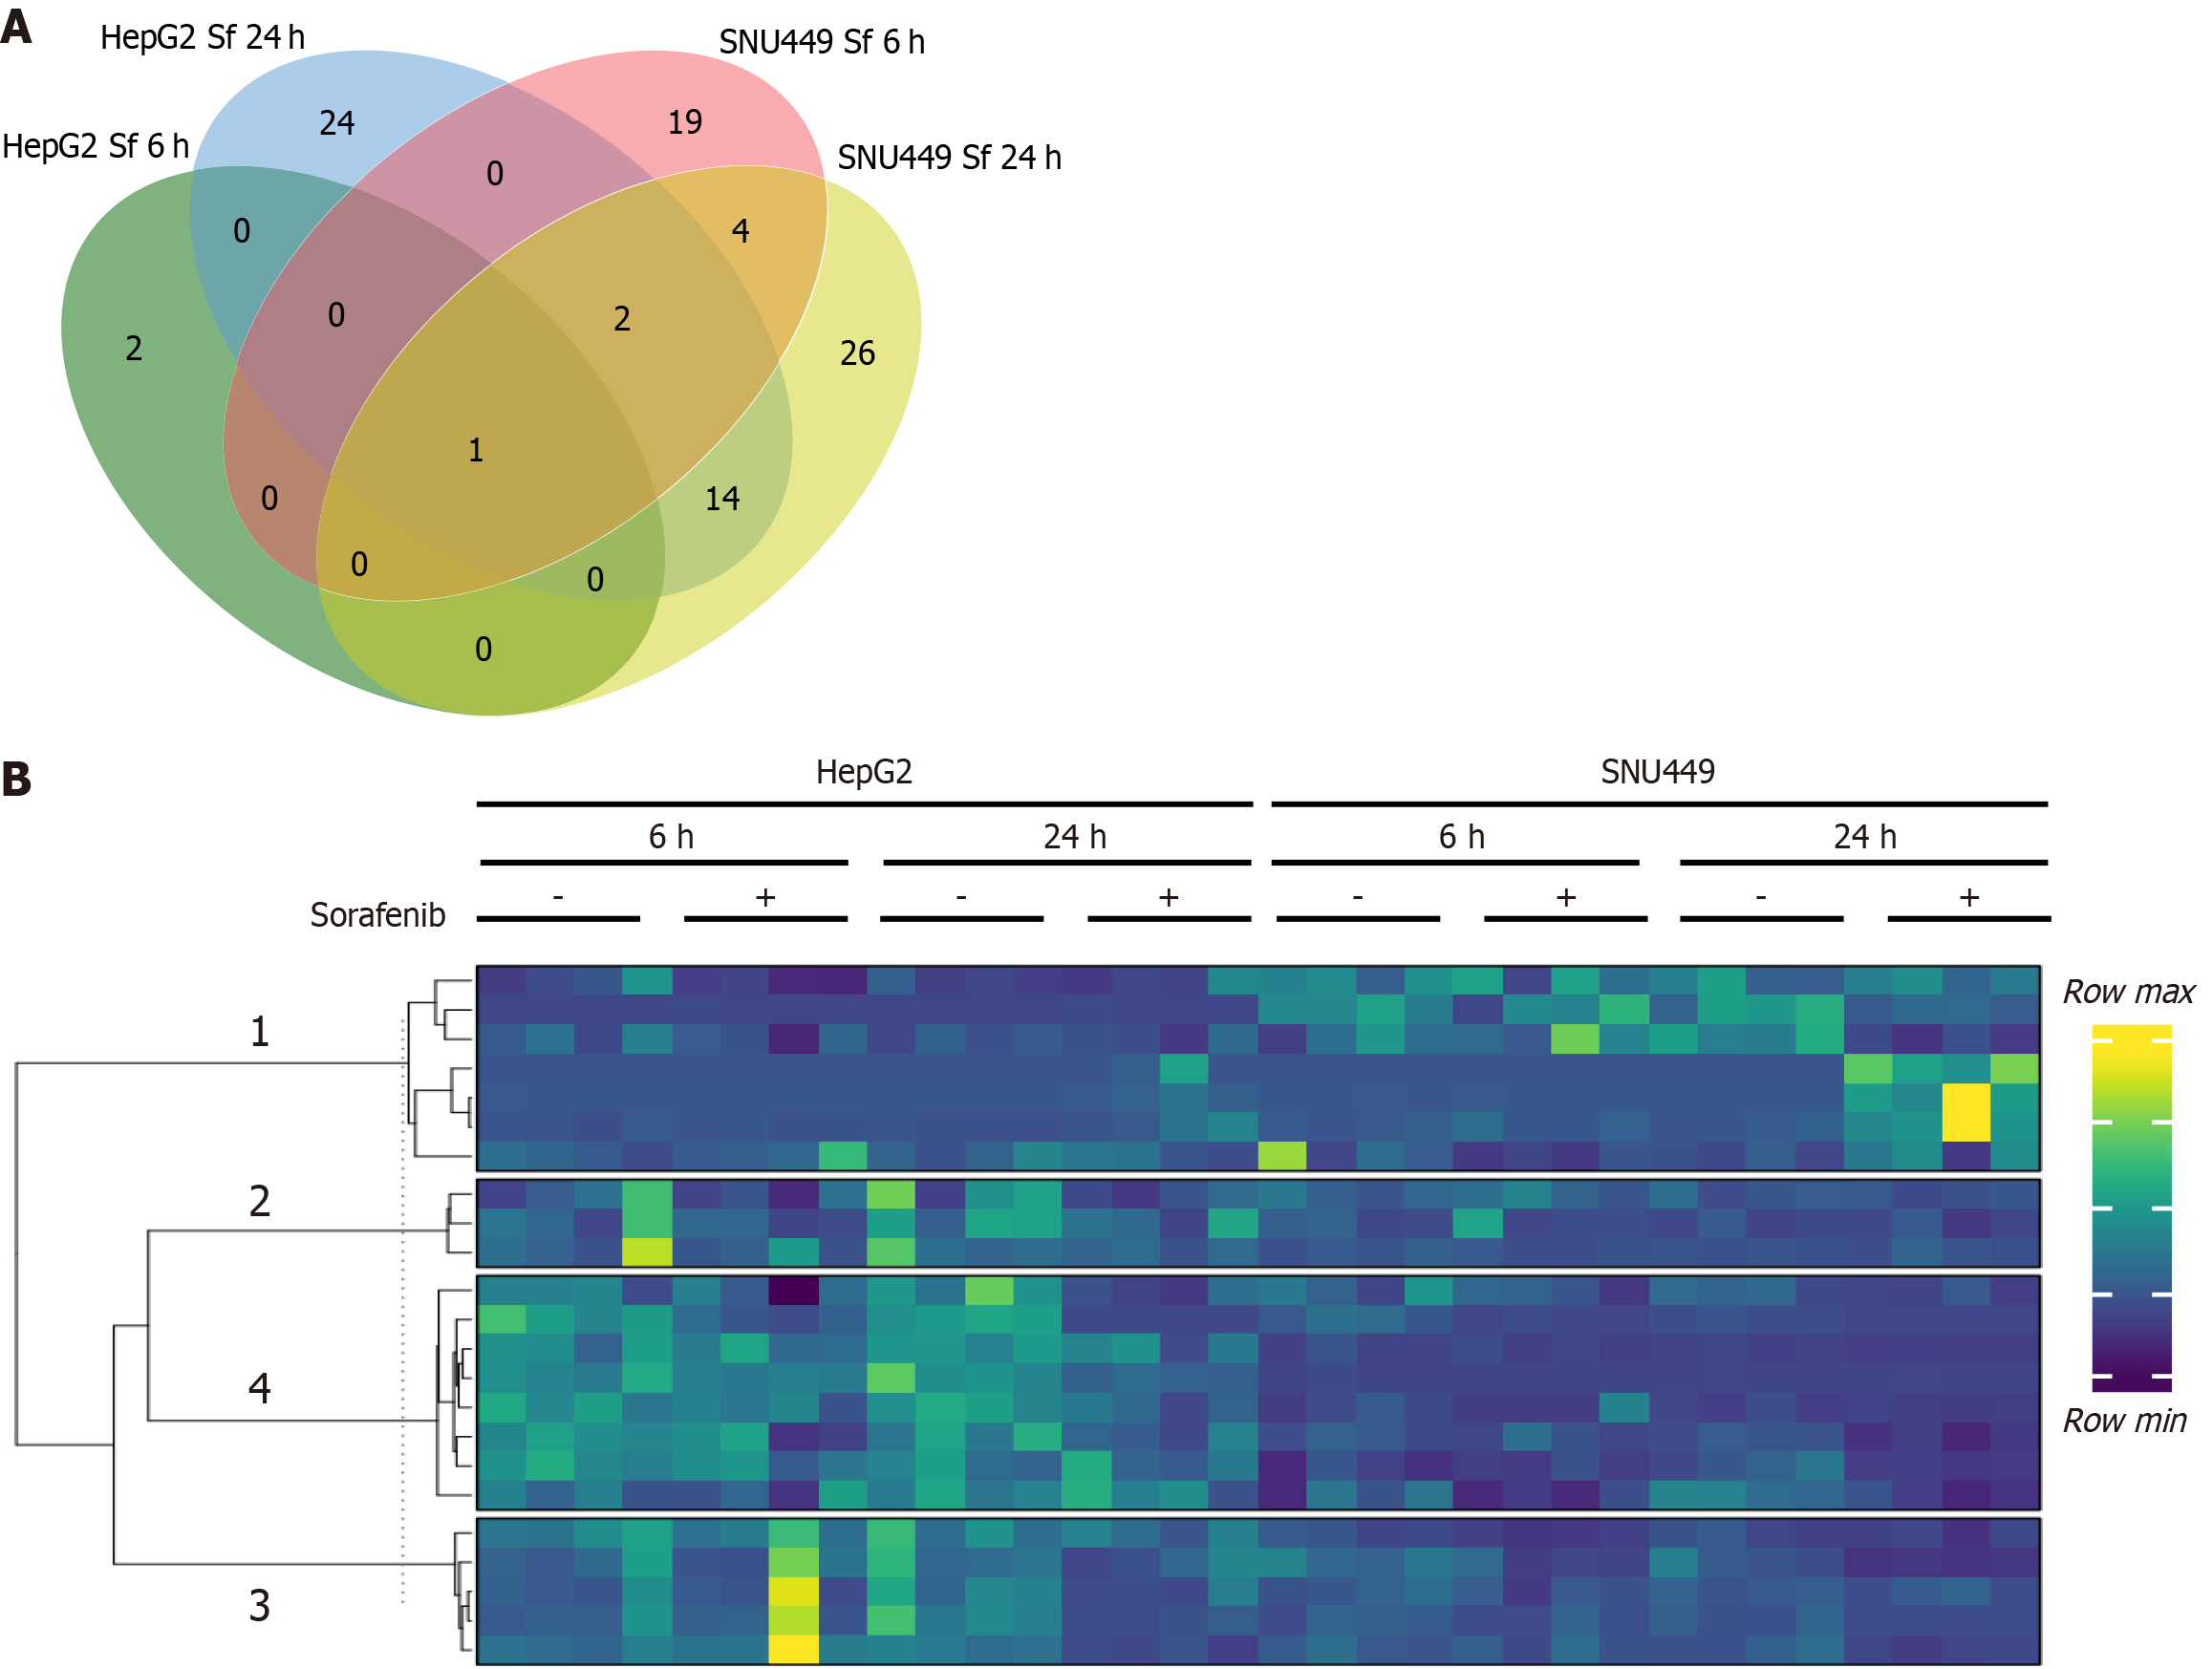
Figure 2 Expression profile of small RNAs.
A: Venn diagram of differentially expressed (DE) miRNAs in HepG2 and SNU449 cells treated with Sorafenib for 6 and 24 hours; B: Heatmap of the 110 DE miRNAs grouped into 4 row clusters.
Figure 3 Identification of mRNA candidates.
A: Diagram representing the study design; B: Bubble plots of enriched GSEA terms in HepG2 cells; C: SNU449 cells treated with Sorafenib 24 hours. Bubble size is representative of gene count and color is representative of the normalized enrichment score; D: Heatmap of selected mRNAs in HepG2 and SNU449 cells.
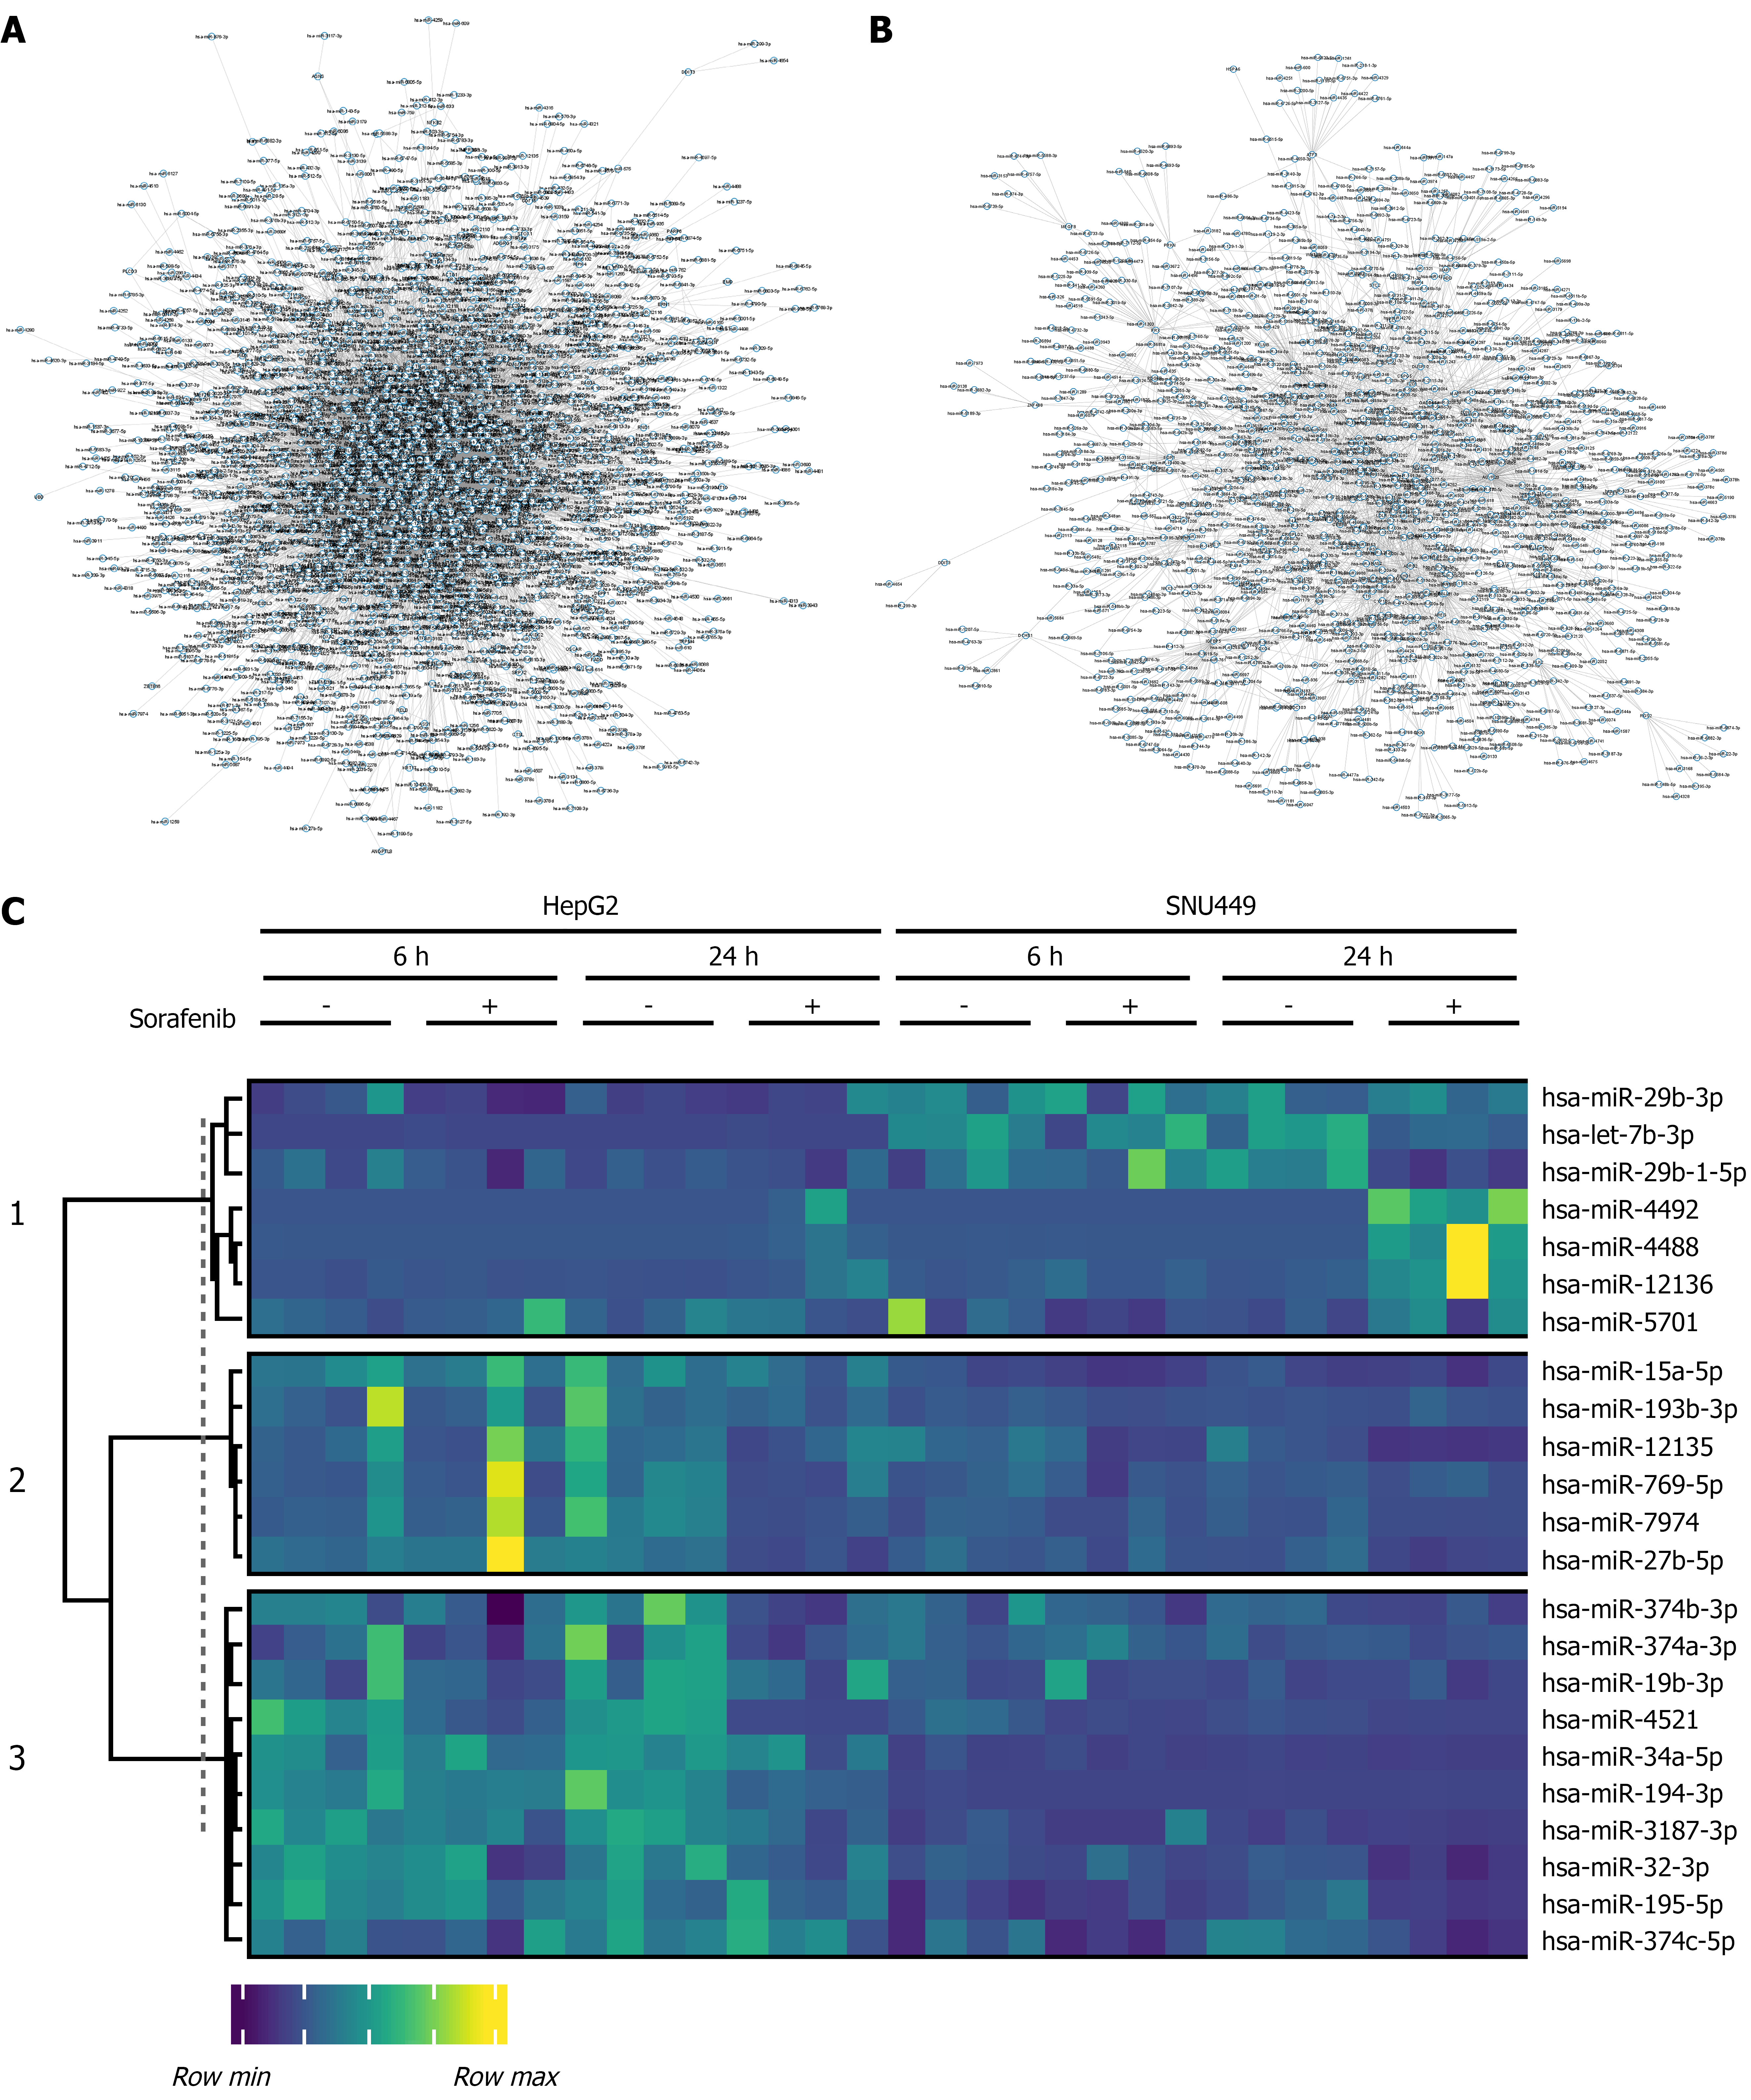
Figure 4 Identification of miRNA candidates.
A: Gene regulatory network showing miRNA-mRNA target predictions in HepG2 cells; B: SNU449 cells treated with Sorafenib for 24 hours; C: Heatmap of selected miRNAs.
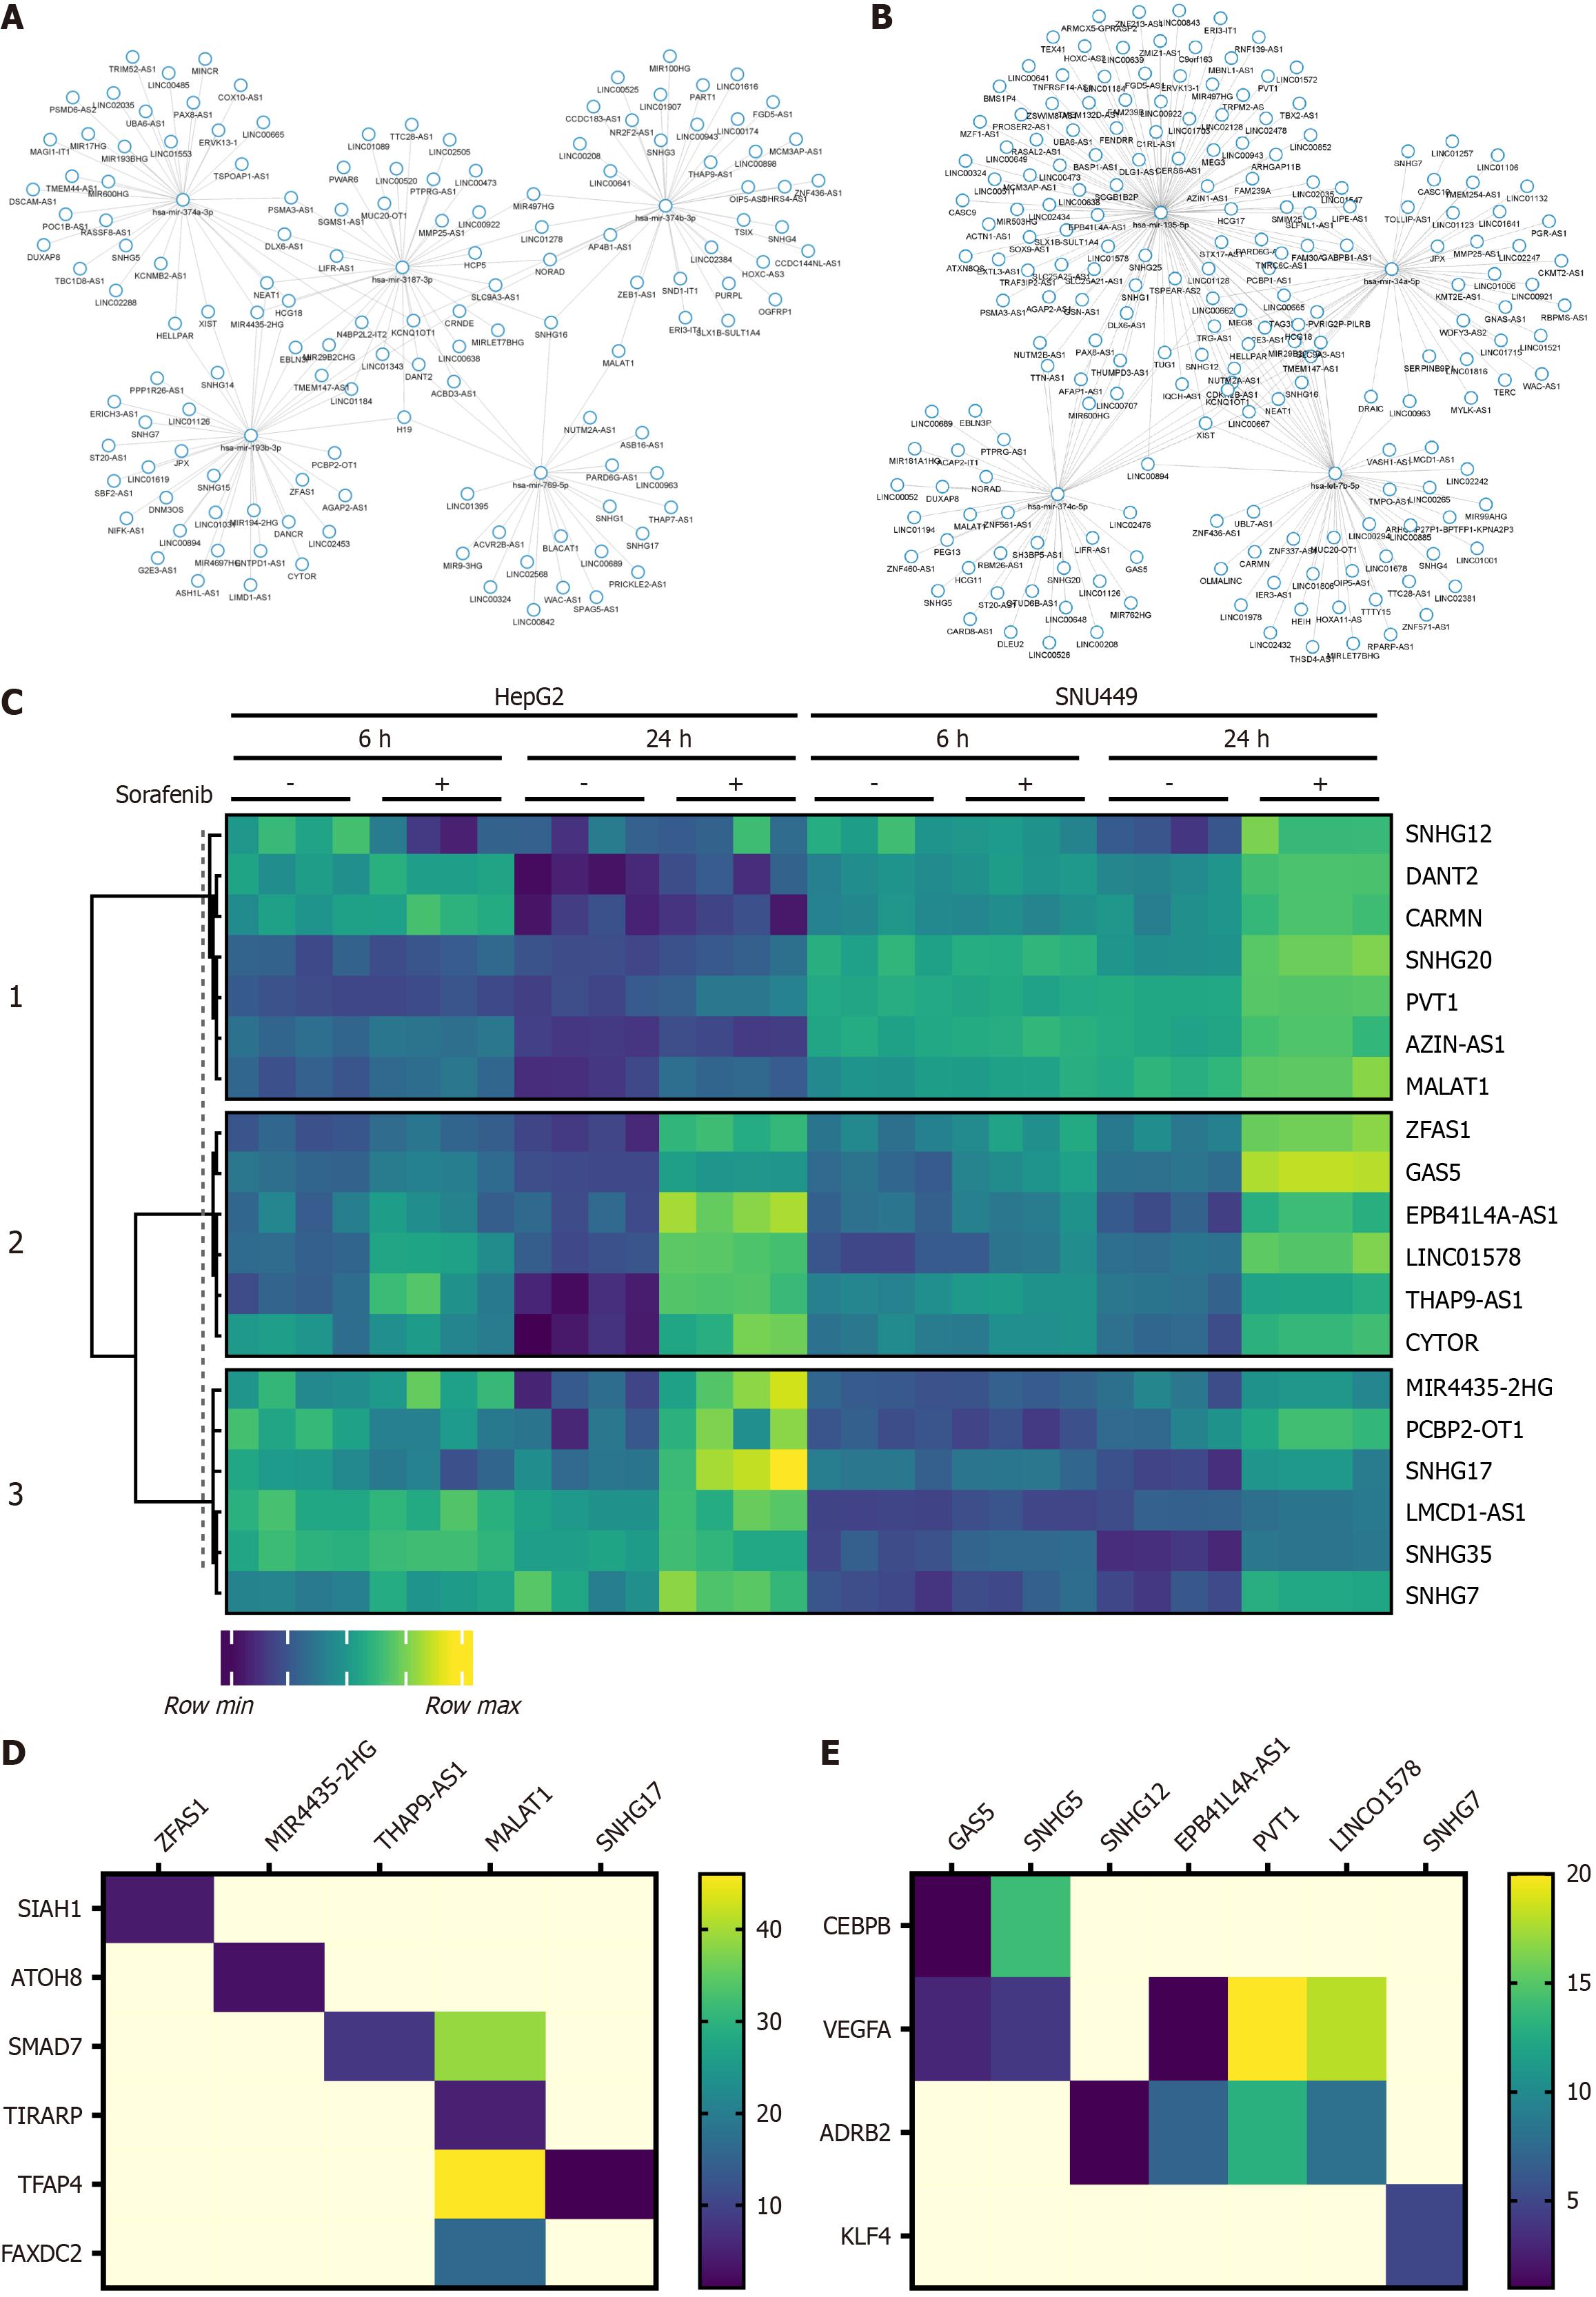
Figure 5 Identification of lncRNA candidates.
A and B: Gene regulatory networks showing miRNA-lncRNA interaction predictions in HepG2 and SNU449 cells treated with Sorafenib for 24 hours; C: Heatmap of selected lncRNAs in HepG2 and SNU449 cells for lncRNA-mRNA interactions; D and E: Heatmaps representing the number of interactions between lncRNA and mRNA targets of their corresponding miRNA interactions in HepG2 and SNU449 cells treated with Sorafenib (24 hours).
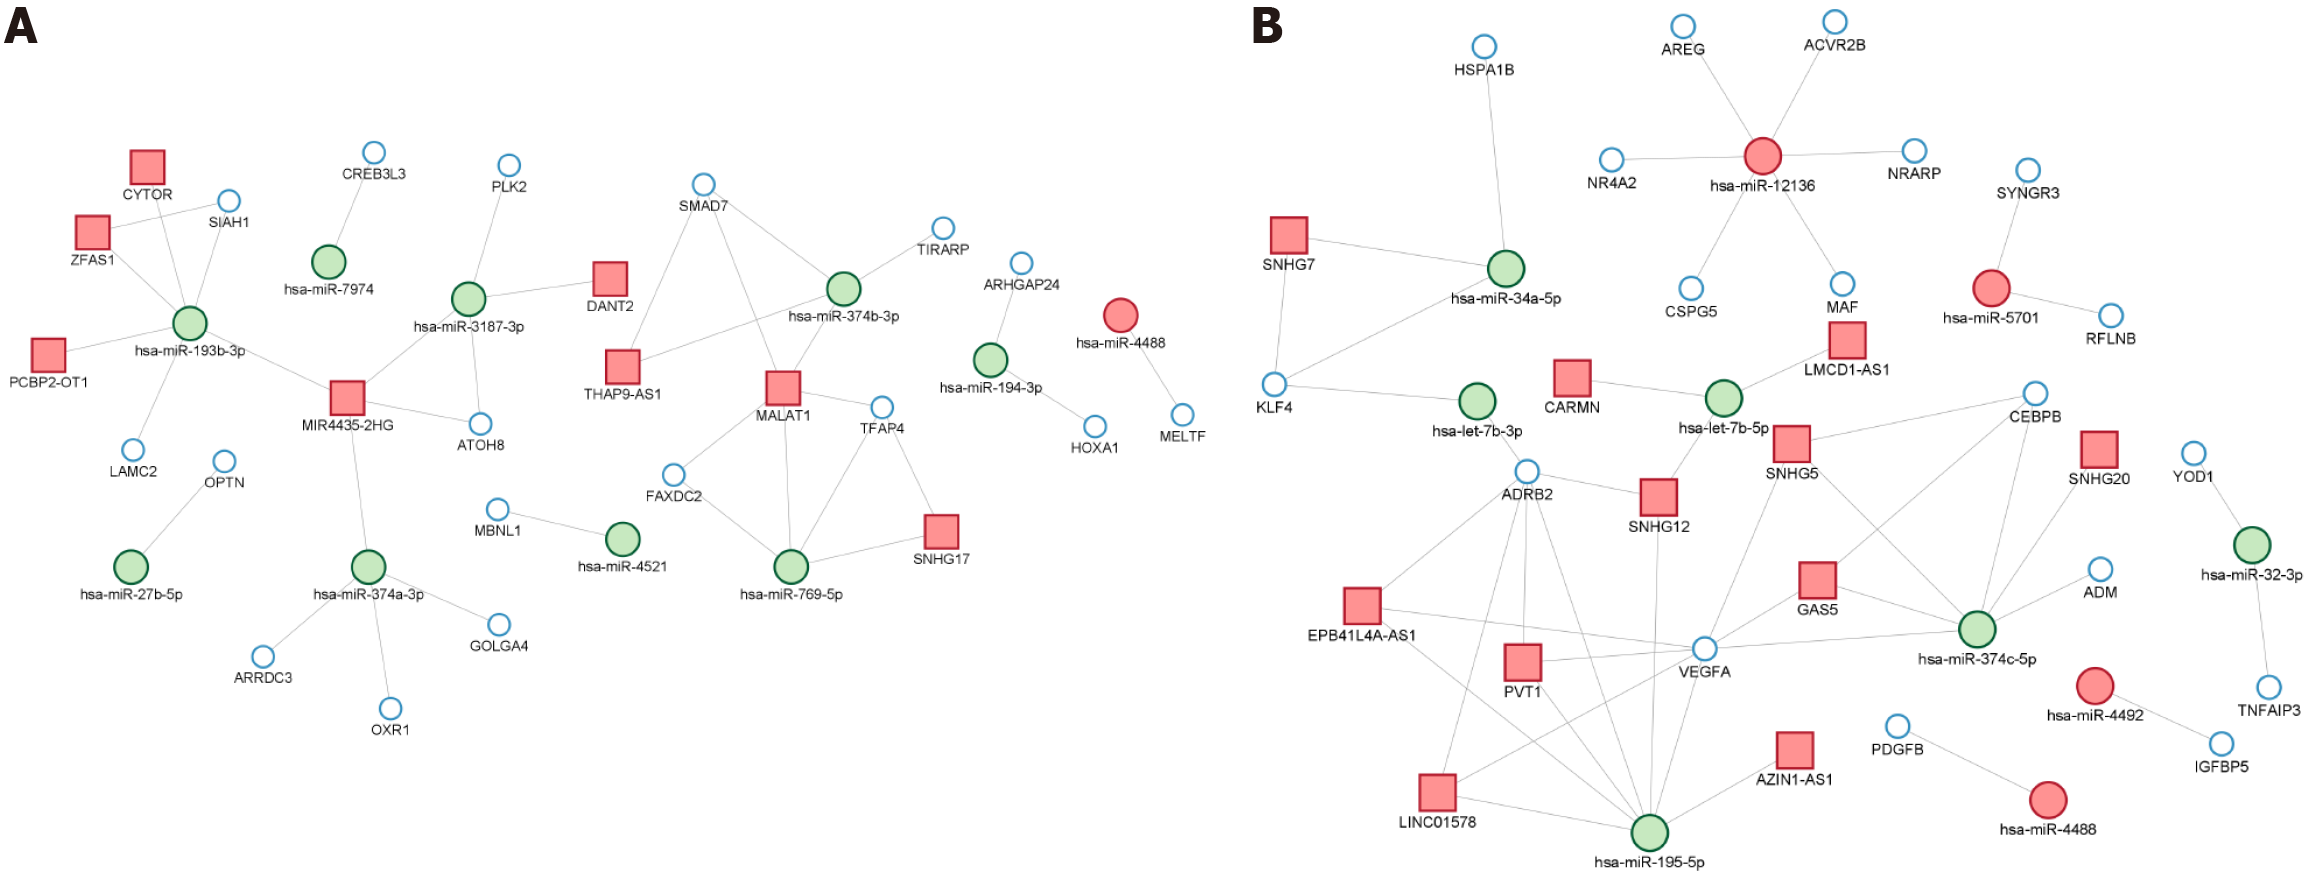
Figure 6 Gene regulatory networks of interactions among miRNAs (large green dots), lncRNAs (red squares) and mRNAs (small light blue dots) in HepG2 and SNU449 cells treated with Sorafenib (24 hours).
A: HepG2 cells; B: SNU449 cells.
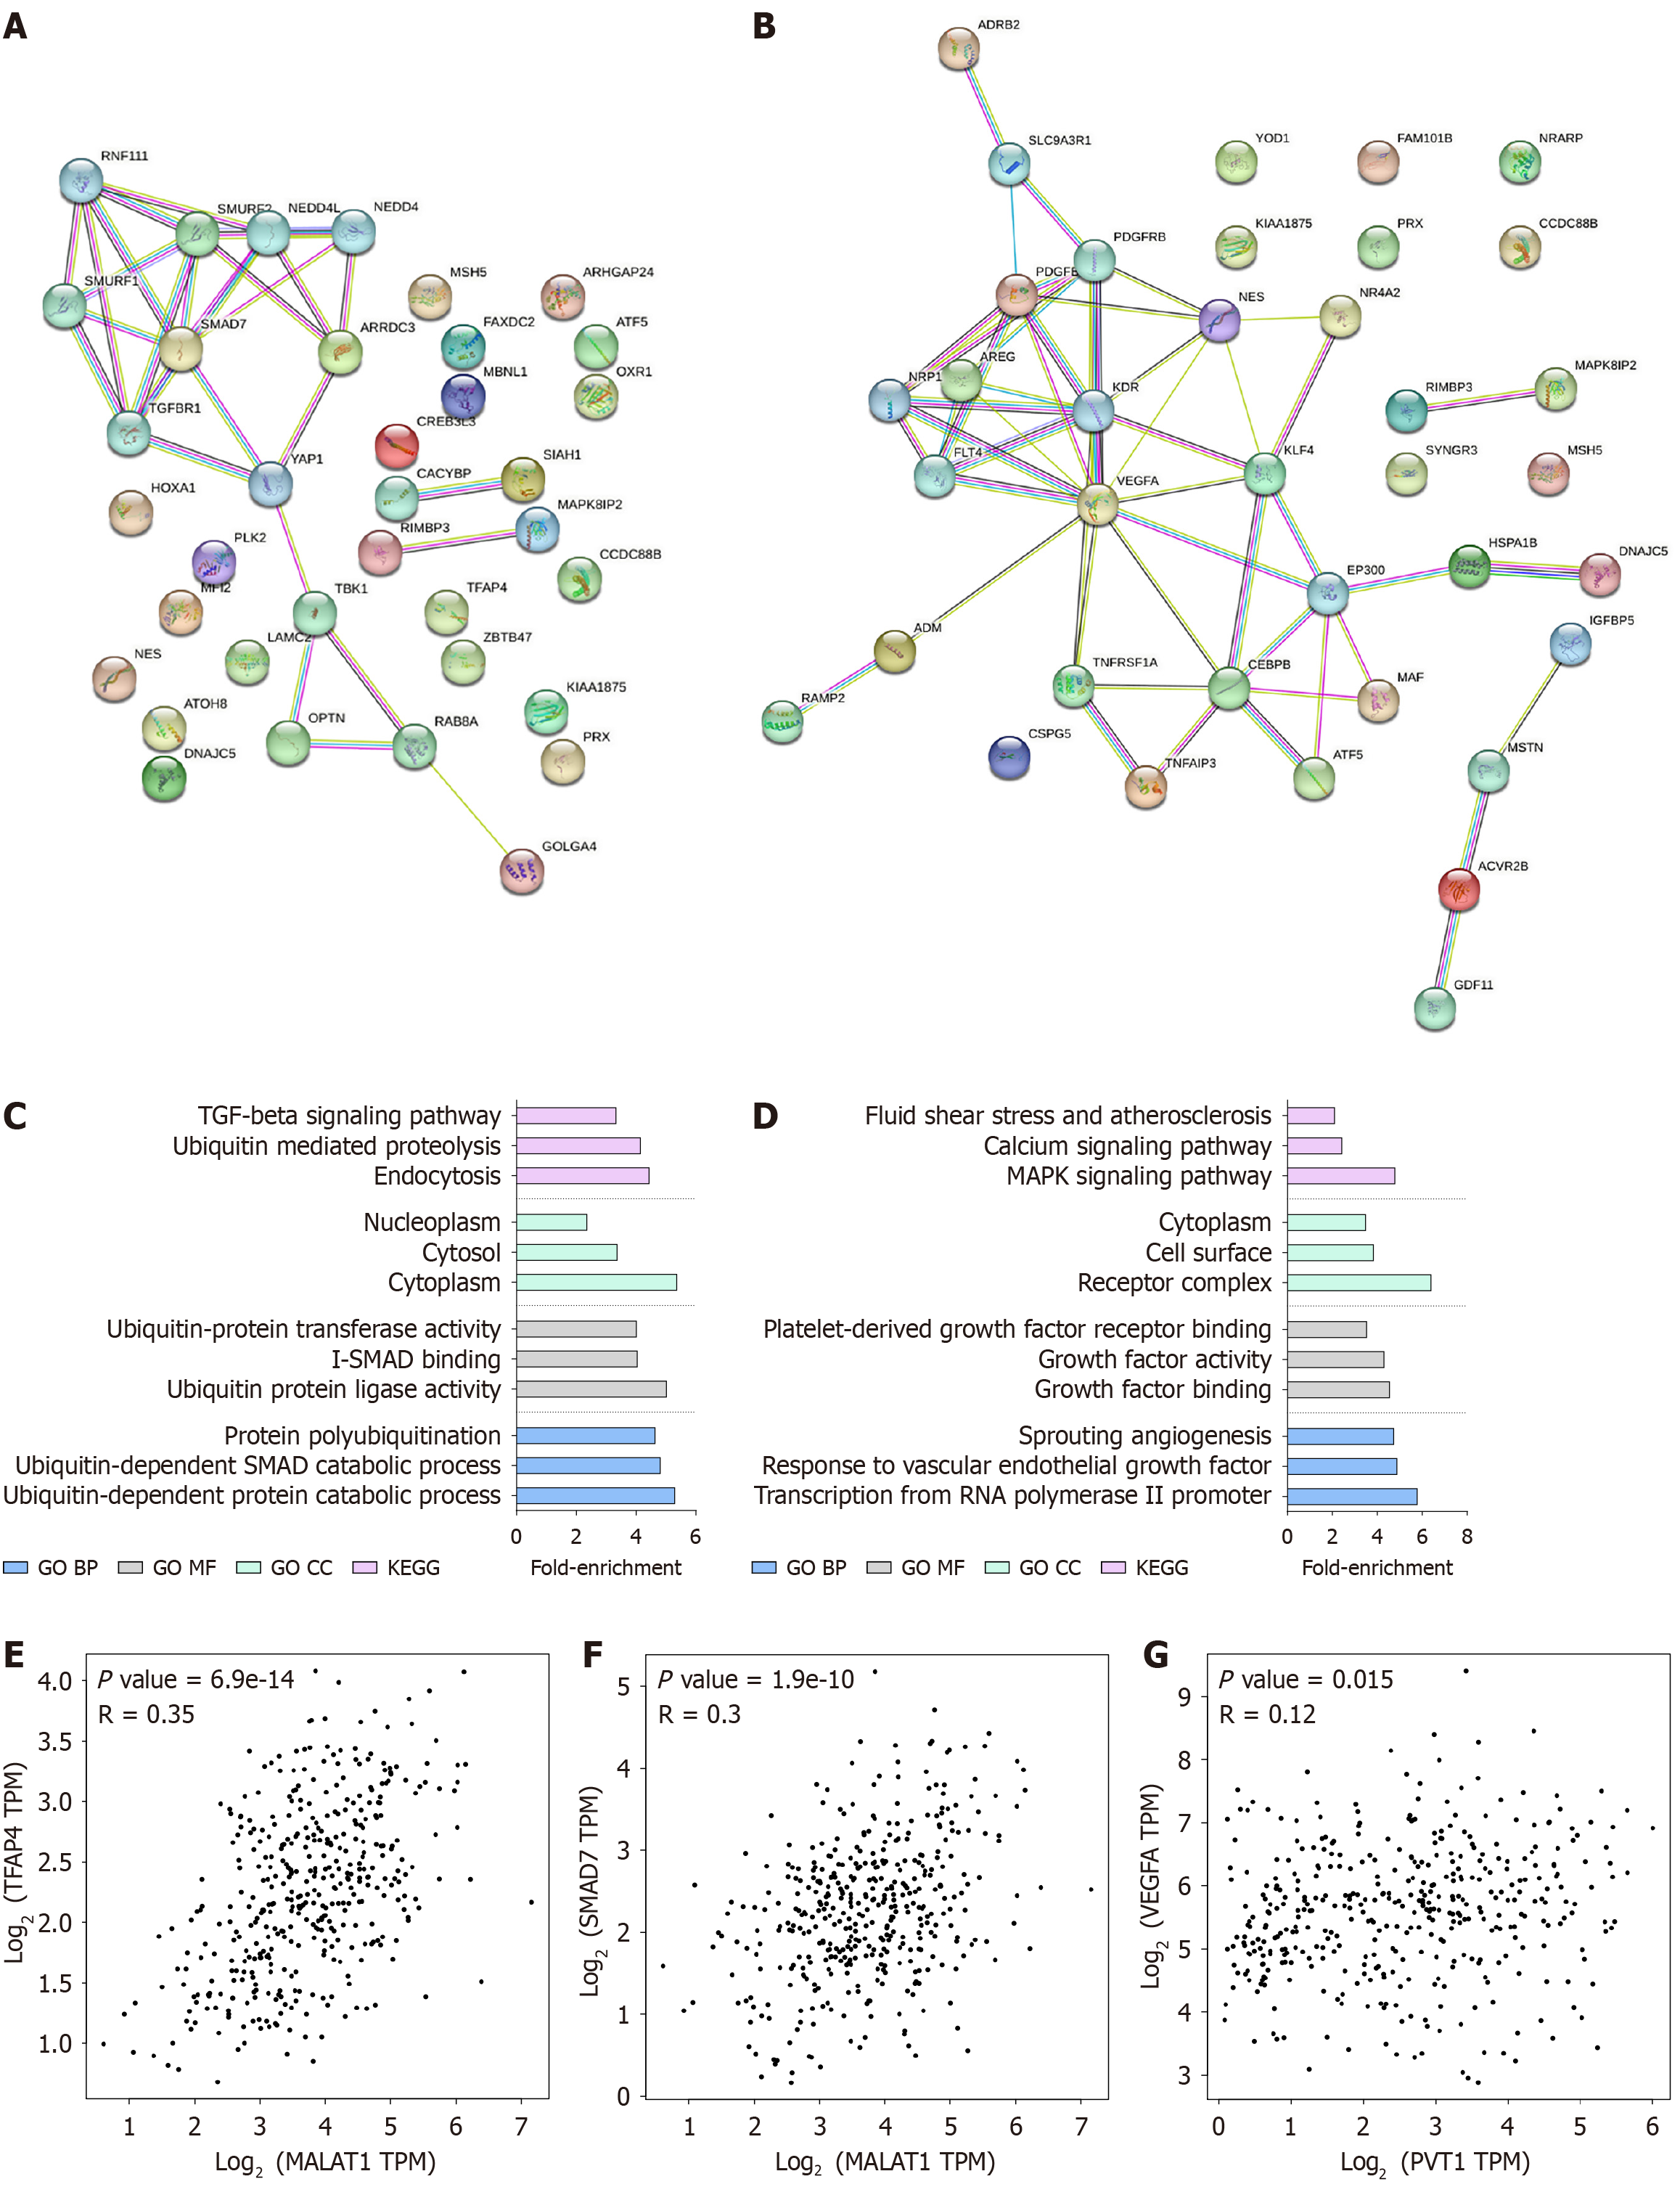
Figure 7 Identification of protein interactions at 24 hours.
A and B: Identification of protein interactions at 24 hours. STRING pathways of targets regulated by lncRNAs or miRNAs with no more than 10 interactions in HepG2 and SNU499 cells treated with Sorafenib (24 hours); C and D: Top 3 enriched Gene Ontology and Kyoto Encyclopedia of Genes and Genome terms in the STRING pathway analysis in HepG2 and SNU499 cells treated with Sorafenib (24 hours); E-G: Validation of proposed interaction networks using GEPIA data between MALAT1 and TFAP4, and MALAT and SMAD7 in HepG2 cells, and PVT1 and VEGFA in SNU449 cells.
- Citation: de la Cruz-Ojeda P, Parras-Martínez E, Rey-Pérez R, Muntané J. In silico analysis of lncRNA-miRNA-mRNA signatures related to Sorafenib effectiveness in liver cancer cells. World J Gastroenterol 2025; 31(3): 95207
- URL: https://www.wjgnet.com/1007-9327/full/v31/i3/95207.htm
- DOI: https://dx.doi.org/10.3748/wjg.v31.i3.95207


