Copyright
©The Author(s) 2025.
World J Gastroenterol. Jun 14, 2025; 31(22): 105201
Published online Jun 14, 2025. doi: 10.3748/wjg.v31.i22.105201
Published online Jun 14, 2025. doi: 10.3748/wjg.v31.i22.105201
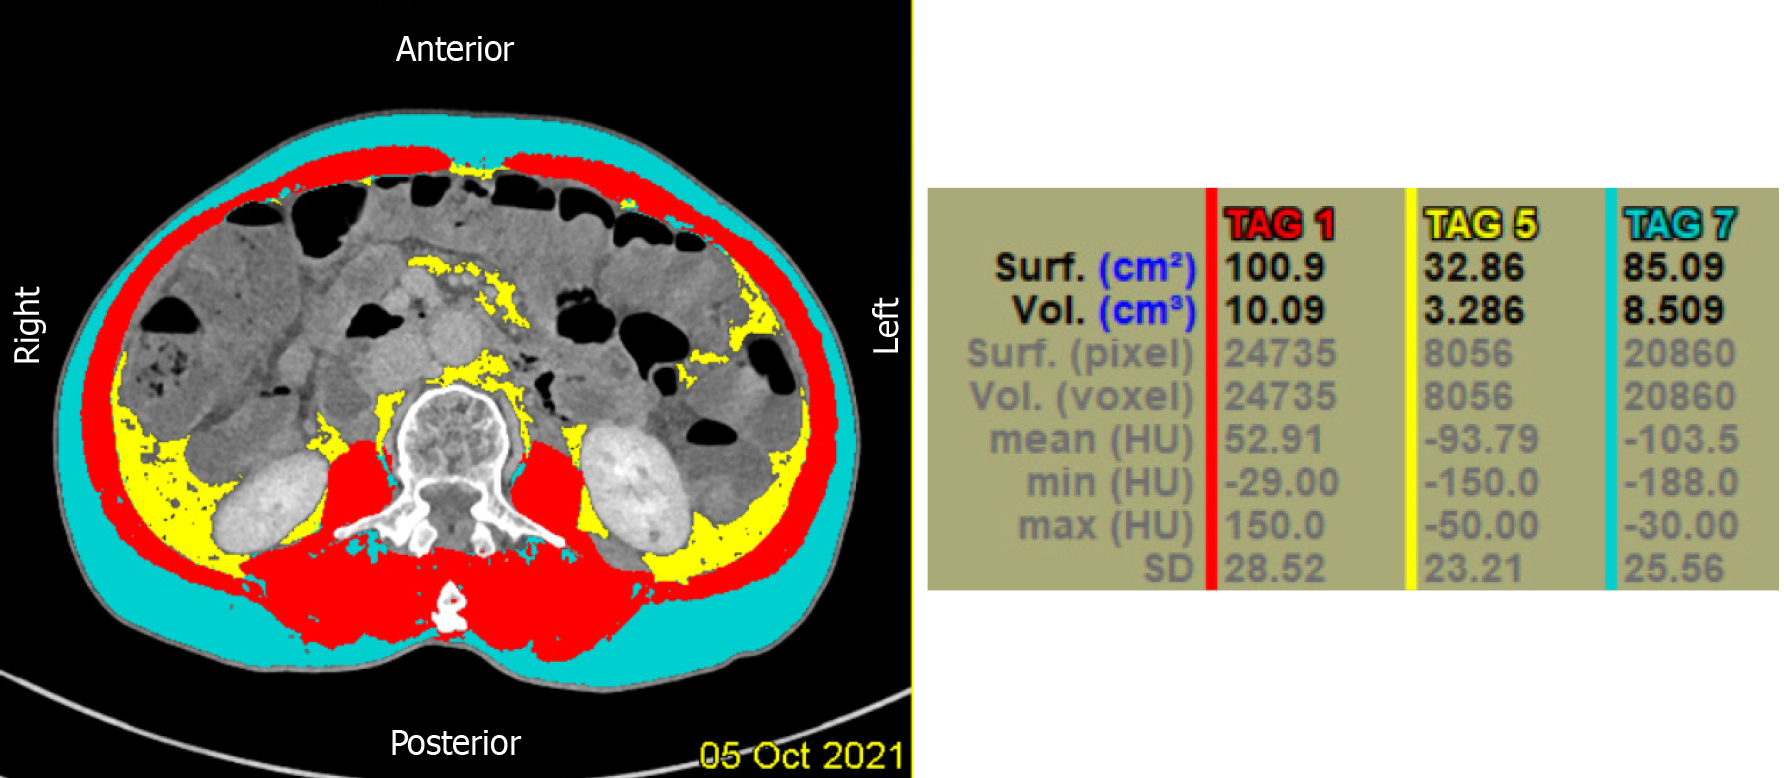
Figure 1 Measurement image of abdominal fat distribution.
The red, blue, and yellow areas indicate muscle, subcutaneous, and visceral fat, respectively. The software automatically identifies visceral and subcutaneous fat according to the selected area boundary and fat density range and completes the measurement of fat volume and average density, allowing the observer to correct the boundary.
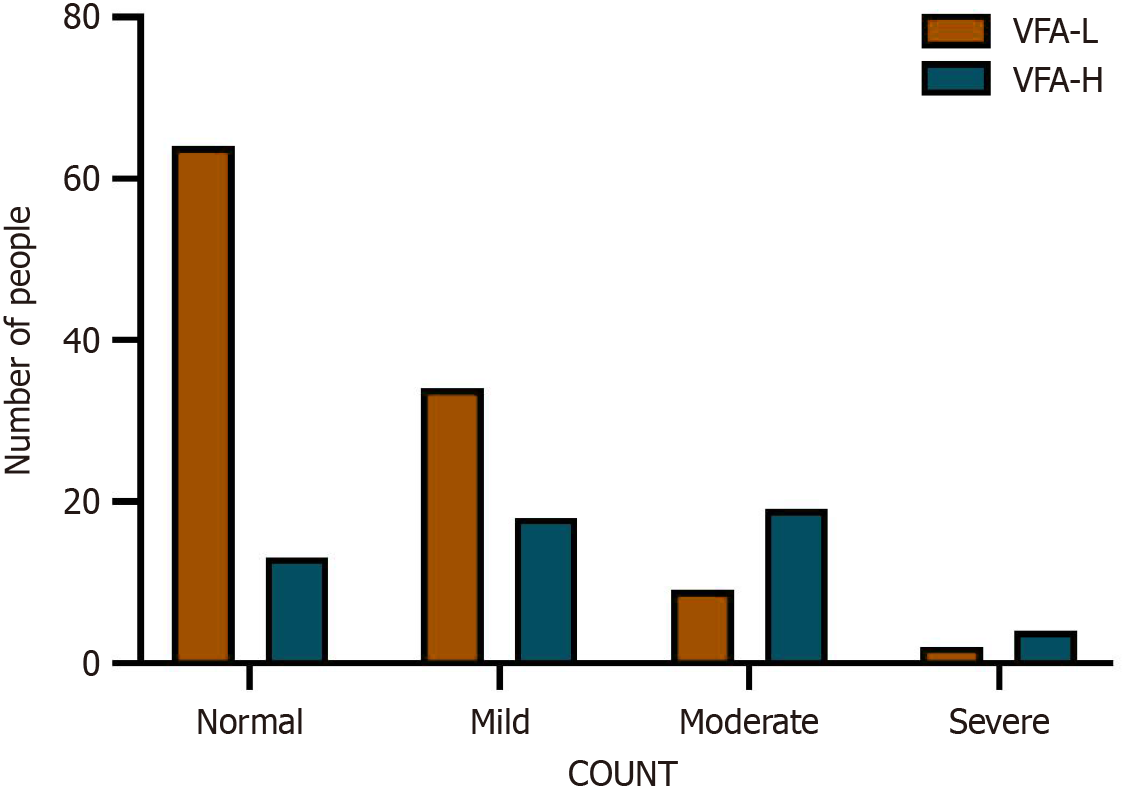
Figure 2 Comparison of controlling nutritional status between the two groups.
This column depicts the distribution of the number of patients in each of the four categories of the controlling nutritional status score for the two groups: Low visceral fat area and high visceral fat area. COUNT: Controlling nutritional status; VFA-L: Low visceral fat area; VFA-H: High visceral fat area.
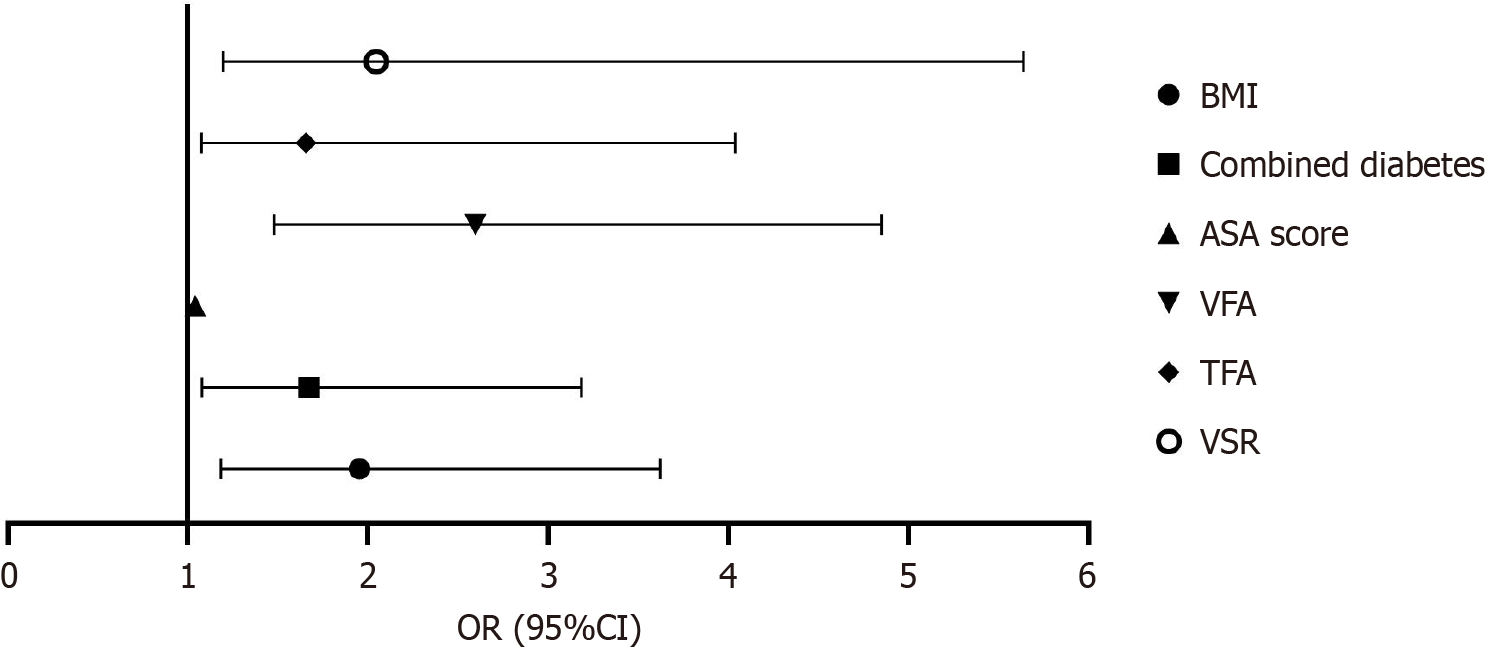
Figure 3 Forest plot of complication risk factors.
The forest plot presents six independent risk factors identified by binary logistic regression analysis as influencing the occurrence of complications in elderly patients after gastric cancer surgery. BMI: Body mass index; ASA: American Society of Anesthesiologists; VFA: Visceral fat area; TFA: Total fat area; VSR: Visceral to subcutaneous fat area ratio; OR: Odds ratio.
- Citation: Li WF, Que CR, Xu DB, Li P. Impact of visceral fat distribution on postoperative complications in high-aged patients undergoing gastric cancer surgery: A cross-sectional study. World J Gastroenterol 2025; 31(22): 105201
- URL: https://www.wjgnet.com/1007-9327/full/v31/i22/105201.htm
- DOI: https://dx.doi.org/10.3748/wjg.v31.i22.105201


